3 Main Spheres of Global Investing [Where to Invest Your Money]


The Three Main Geographical Spheres to Invest Your Money
Broadly speaking, you have three main places to invest your money:
1) The three main reserve currency areas – US, European Union (can also include the UK), and Japan
2) China and maturing Asia (i.e., South Korea)
3) Emerging markets
1) Main reserve currency countries
The US has more room in its curve to stimulate its asset markets than Europe and Japan. But it’s been lumped into the same group because it’s very close to joining them.
Reserve currency country cash and bonds
In all these countries, cash and bonds are no longer investments as much as they are sources of funding. If you have cash or you own sovereign bonds denominated in these currencies you’re probably not doing it because you think they’re great investments.
You’re probably buying them as a means of diversification, a way to have balance in your portfolio, as a reserve or source of capital to deploy opportunistically, or because they’re attractive for another reason, such as what they yield if hedged into your own domestic currency (e.g., hedging a JPY bond back into USD).
Bonds in the US yield between 1.5 and 2 percent. The inflation rate is targeted to be around 2 percent. So, the inflation rate eats up the yield or a bit more. This means they yield zero to somewhat negative in real (i.e., inflation-adjusted) terms. This is still better than holding money in a checking account or cash in a safe, but it’s still a bad return. You also have to pay taxes on the coupon distributions.
Traders also may buy them when they expect interest rates to decline. When rates decline, bond prices go up based on their duration. If you buy a 30-year bond that has an effective duration of 25, that means each 100-bp fall in interest rates would raise the price of that bond by about 25 percent. Because low rates are holding the markets together, many traders view rates as an asymmetric bet – going lower is a possibility, especially in the US where there’s still room, but not that feasible to go higher.
The longer the duration of an asset – in other words, the amount of time it would theoretically take to get your initial investment back – the more sensitive it will be to movements in interest rates.
When interest rates go lower, this lengthens the duration of assets. This means central bankers need to increasingly factor asset prices into their reaction function. Drops in asset prices have a negative feed-through into the economy.
So, it’s important to look at what the market thinks in terms of interest rates priced in because that’s how the cash flows of assets are discounted to determine their present values (i.e., their prices).
Disrupting that can lead to unwanted swings in asset prices either way. Being too tight relative to what’s priced in will cause a decline in asset prices. Being too loose brings financial stability risks, such as excess speculation and pushing asset prices to a level that is not sustainable.
But central bankers should not be of the belief that what the market thinks doesn’t matter or is just “an opinion” and they know what’s better for the economy. The opinions of traders and investors matter a lot.
Not only because they have “skin in the game” in contrast to policymakers who don’t bear direct responsibility for their actions. But the financial system and economy are highly interlinked.
The financial system is what provides the capital (money and credit) that feeds into spending in the real economy.
We know that some sovereign debt is held by the domestic central bank to set policy (e.g., Federal Reserve holding Treasuries, ECB holding German bunds).
We also know that some sovereign debt is held by domestic commercial banks as a capital buffer, by foreign central banks, monetary authorities and sovereign wealth funds as reserves, and by investors as a capital preservation asset or for prudent hedging purposes.
But some of it is used for speculative purposes. They don’t provide much or anything as an investment, so for certain players in the market they become used as a way to ideally sell to somebody else down the line if their conviction on the future path of interest rates – or belief of broader “risk off” sentiment – proves correct.
Cash and bonds as a hedge against equities
Cash and bonds may also be used as a direct hedge against equities.
For most of the past three decades, stocks and bonds have had a negative correlation to each other.
If we do a correlation analysis between SPY and TLT since 2003, we can observe a steadily declining inverse relationship (before the 2021-22 inflation surge) and about 0.00 correlation coefficient overall (on a scale running from -1.00 to +1.00).
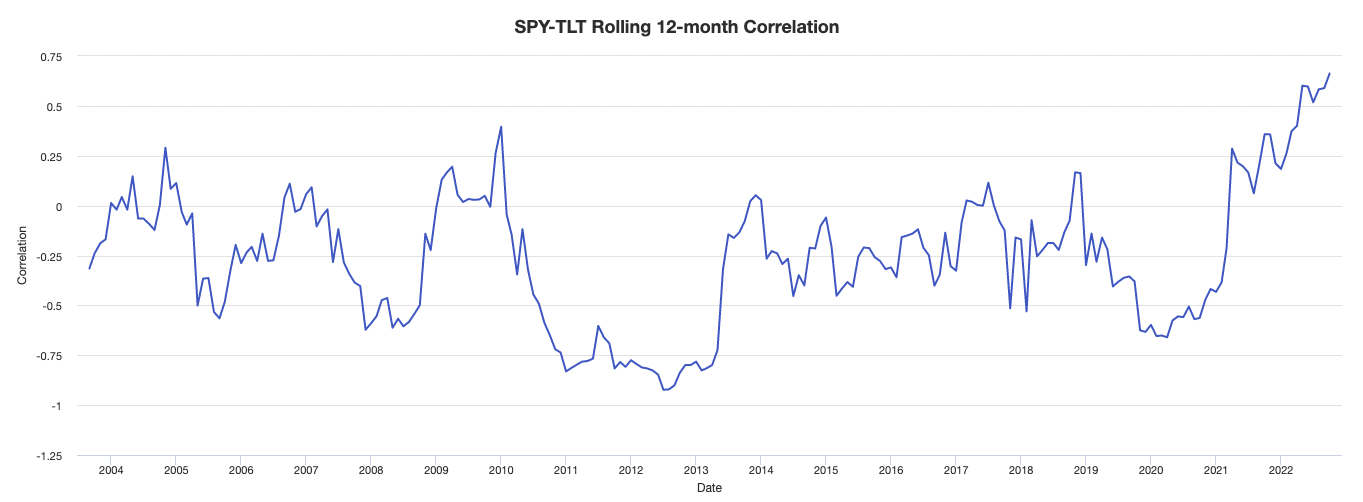
This inverse relationship will not always be true because inflation and/or interest rates running above expectation (relative to what was priced in) may cause both asset classes to fall in conjunction.
But traders tend to extrapolate what they’ve gotten used to and presume that a certain way of operating will continue even when that’s not going to last forever.
When the concept “term premium” comes up, this is, conceptually, your yield if you were to take short-term Treasury bills and roll them continually for a certain duration, such as ten years. Then, how does that compare to the actual 10-year yield?
If the actual 10-year yield is lower, this is generally because traders buy 10-year bonds as a way to hedge against equities. Equities are long-duration instruments. So, bonds of a long duration are also bought to match this in order to have a balanced hedge-like arrangement in place. It’s not a guarantee that it will be an effective hedge, but it can act like one as different types of assets behave differently.
Recently, the 10-year term premium was at an all-time low, some 1.5 percent below what your yield would be if you rolled Treasury bills continuously.
Traders also like buying bonds as a hedging instrument because they’re a “positive carry” way to do it. In other words, it’s a type of hedge where you get paid to put it on. Other types of hedges cost money, like buying puts on equities, bear spreads, or other types of hedging trade structures.
Foreign bond yields when hedged back into domestic currency
Traders will often look at what’s called the cross currency basis to find how cheaply they can hedge one block of foreign exchange currency into another. Having exposure to foreign currency can be dangerous, especially if you borrow in it. If that currency goes against you, it’s effectively like having your interest rate increased.
When the cross currency basis is neutral, when you hedge a foreign bond back into your domestic currency, it will yield approximately the same as a domestic bond of a similar duration.
When the cross currency basis is favorable that means you could actually buy a foreign bond, hedge it back into your domestic currency and see it yield higher than a comparable domestic bond. These opportunities tend to not last long because many traders are always looking for them.
If you are a US-based trader, then if you are looking for foreign bonds to invest in, you will probably be interested in what the yield is when hedging that back into USD.
If you do not hedge a foreign currency bond back into USD, then you’re essentially making a FX trade. In other words, you’re betting on that foreign currency. And maybe you want this exposure because you think that currency will outperform or perhaps you want the diversification away from having all of your assets in only one currency.
But if you buy a German bund and hedge it back into USD, you can probably expect that to yield something comparable to a US Treasury bond of the same duration.
The general mechanism or getting bond yields to be apples-to-apples
The one-year implied forward exchange rate on the EUR/USD is 1.138, which one can trade as a swap or forward. The spot rate is 1.109. So, in one year’s time, that’s an extra 2.6% in yield.
For a US investor buying a German bund at say, minus-50bps, you can hedge out the FX risk by selling the EUR 1-yr forward.
So, you effectively net the forward 1-yr €/$ yield (2.6 percent) over the spot rate via the hedge because that converts the bund proceeds into dollars. Then subtract the nominal yield of the bond (-0.5 percent) to come up with the dollar-hedged yield.
That gives you a bund yield in US dollars of 2.1 percent.
From a European investor’s perspective, buying a Treasury bond at 2 percent isn’t very good when the euro-hedged equivalent is minus-0.6 percent through the same process. Unless they want to take currency risk – keep it in USD – and not hedge.
If a US investor wants to invest in Italian sovereign debt, the cash ($-hedged equivalent) will give you about 2.5 percent and the longest duration forms will give you up to 5.2 percent.
In Switzerland, the 1-yr fwd on the USD/CHF is about 1.05 vs. 1.02 currently for a fwd 1-yr yield of just under 3 percent. So, if you buy Swiss cash and convert it back to dollars, you’re earning about 2 percent. Your yield will be 2.5-2.6 percent if you want to take duration risk on the long end.
That’s why comparisons of yields among bonds denominated in different currencies isn’t fair because you have to calculate all the currency conversions to make it apples it apples.
Stocks in reserve currency countries
Central banks purposely need to make cash and bond sources of funding – rather than investments, as bonds normally are – in order to push people into buying riskier financial assets.
The theory goes that if you buy financial assets this makes capital cheaper and easier to raise, collateral is worth more, which provides certain advantages. Companies can hire more, invest more into projects with lower hurdle rates to their success, and help out overall economic behavior.
But this also bids down their forward returns and investors will only bid up their prices so far before they also become unattractive like cash and bonds.
The cash flows of stocks are theoretically perpetual. So, unlike a bond, we don’t know exactly what they “yield”. But if we can determine what earnings are likely to come in at, and the price level of a representative index, we can back out what this yield is.
Earlier, we derived our current Sharpe ratio for US stocks to approximate 0.24.
Translating this into something more concrete, this means that you’d need about a 20-year investment horizon to have an 85 percent chance of making money.
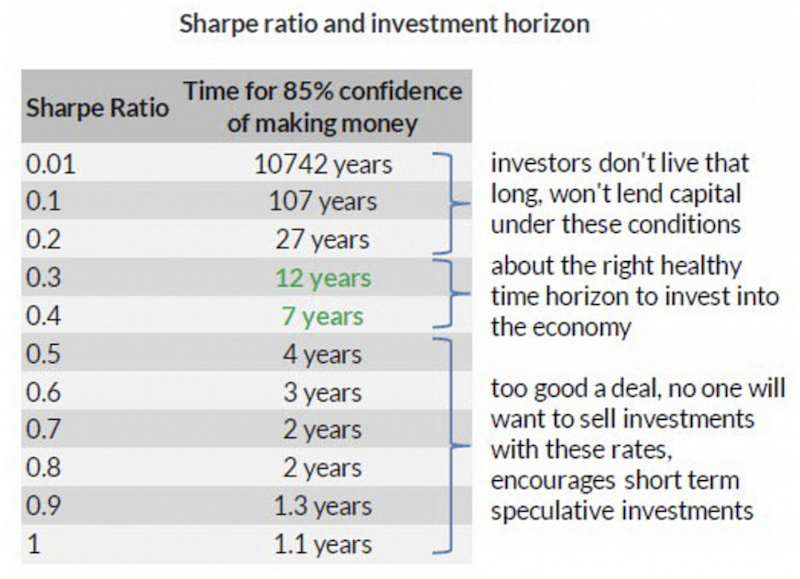
Put another way, once you get below a Sharpe ratio of 0.2, which would happen when the yield on stocks over cash gets to less than 3 percent, that means you’re saying you’d be willing to go 30 years with a material risk (~15 percent) of not making any money.
Currently, this would represent an SPX index value of 3,617. If earnings improve to 180, then 3,829. Or else cash and other funding rates would need to come down to improve the spread.
Bottom line on developed market equities
They are high and not that attractive relative to their risk, but they haven’t gone to such grossly overvalued levels relative to cash.
2) China and maturing Asia
China and maturing Asia is the second main place to invest your money.
China’s financial markets are now the second-largest in the world by liquidity and size. On its current track, it can, at some point, surpass the US as the largest economy in the world, which will bring with it certain benefits in terms of global influence – e.g., technological sophistication, military, potential reserve currency.
China has certain advantages relative to the main reserve currency countries:
1. Higher yields on cash and bonds
The yield on China’s 1-year bond (a de facto cash rate) is 225bps. Its 15-30 year maturities range from 335-360bps.
By extension, we know that:
2. China has more room to ease to stimulate its domestic markets and economy
China can squeeze more out of its asset markets to stimulate its economy because they have normal interest rates and yield curves without inflation or stagflation issues.
3. Higher secular growth rates
The Chinese government releases numbers that are a bit overinflated, but we do know that their productivity rates are higher at about 3.0-3.5 percent annualized.
The remainder of their growth is driven by credit. Because most of their debt is denominated in their own currency, this isn’t too much of a problem if it’s managed in a prudent way by lowering the rates and extending out the maturities.
4. China is heavily technologically focused
Europe, which was once on the frontier of productivity, has lagged behind the US in financial asset returns because it largely hasn’t participated in the tech revolution. All the main top tech companies – Apple, Microsoft, Amazon, Google, Facebook – are American.
China restricts the operations of foreign firms, such as banning Facebook and Google and YouTube outright.
But they do have tech companies that do many of the same things. The indebted, manufacturing-based “old economy” that characterized the interior is slowly being replaced with the service- and tech-based “new economy” that characterizes the coastal portion. Such companies like Baidu, Tencent, and Alibaba serve many of the same purposes.
5. They have an independent monetary policy and unique savings behavior
When a country doesn’t have an independent monetary policy, that’s a problem for you as a trader or investor. That means if they run into problems, but don’t have the means or authority to rectify them, this can cause major issues for not only the country but for its asset markets.
Take the example of Greece when it had to come face to face with its debt problem in 2012. It was pegged to the euro and so therefore didn’t have autonomy over its monetary policy. That fell under the ECB and is one of the major downsides in joining a currency bloc.
If it had stayed on the drachma it would have simply devalued its currency and spread the effects externally. Exports would have become cheaper internationally, stimulating external demand for their products and services. Being monetarily linked to everyone else in the EU, it didn’t have control over its situation and had to take the effects internally, with GDP decreasing some 40 percent.
In cases where you can control your monetary policy because you have your own currency and the debts are poorly managed, it can take usually about a decade to return to your previous level of economic output. (Each situation is different, but that’s where you get the term “lost decade”.) When you don’t have an independent monetary policy, this can take quite a bit longer. In Greece’s case, it will take about 30 years.
In general, this type of pegged currency regime makes Europe the most vulnerable of all developed market economies when there’s a contraction in output. Individual countries largely lack the tools to combat their problems.
And because China has a high savings rate relative to other markets, this makes investment returns less dependent on Chinese growth. This is because those savings can eventually serve the purpose of going into consumption or investment. For a country like China, which 1-2 generations ago was mired in widespread poverty (more than 85 percent of the population), many, particularly those in the older generation, have never lost their cautiousness with money. When a country becomes richer, the newer generation who was never immersed in these circumstances tend to be more willing to spend.
Other more developed parts of Asia, like South Korea, Singapore, Taiwan, and Hong Kong offer more stable markets. But they offer comparatively low returns, with cash rates (and many bond rates) in the 1-2 percent range.
3) Emerging markets
Today, the developed markets aren’t going to give you much in the way of return on anything.
China is an option, but China has its own host of issues related to its rule of law, lax regulatory regime (e.g., insufficient penalties and quality checks for financial and securities fraud), less stringent respect for private property rights, and still under-developed capital markets.
China might be the second-largest economy in the world, and have the second-deepest capital markets in the world behind the US. But it is still better characterized as an emerging market then a developed market. You can build a China portfolio, but you probably don’t want it to be too large of an allocation.
You never want to bet too much on any given thing given the range of unknowns is always going to be larger than whatever it is that you do know.
So, this brings us to the third main global sphere for investing. That’s the other emerging markets.
We’re in a world where developed markets are “capital rich”. Cash and bonds have been driven down to zero, negative, or zero-ish yields and other parts of the world remain undercapitalized with 4.5 percent or better rates.
These include places like Brazil, Indonesia, India (which will become a massive economy as the 21st century moves forward with its population), Vietnam, South Africa, Russia, Mexico, Ecuador, Turkey, Ukraine, and Ghana, going from lowest to highest prospective returns. Other countries can also be included, but this is a representative sample.
With these countries, you can form a basket of 7-8 percent average yields funded at 0-2 percent, depending on where you are – i.e., USD, EUR, JPY, or similar lower yielding funding currency.
Riskier emerging markets should never be a large part of your allocation. They typically have myriad issues, which is why the yields are as high as they are. EMs are inherently more volatile and subject to risk given they underlie jurisdictions that may be exposed to a less robust rule of law, poor institutions, political instability or corruption, low levels of investment and innovation, poor attitudes toward commercialism, lack of property laws for private entities, and/or poorly developed debt and capital markets.
If you look at the way reserve managers go about their portfolios, they are heavily focused on the main reserve currencies.
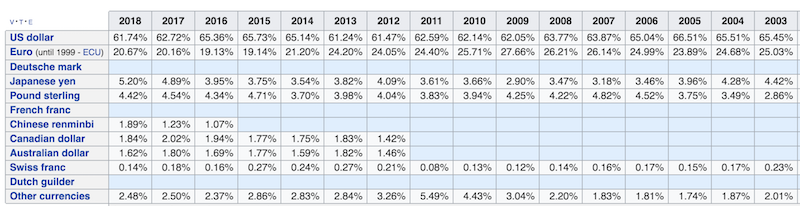
(Source: World Currency Composition of Official Foreign Exchange Reserves International Monetary Fund)
As of 2018, sixty-two percent of all foreign currency reserves are concentrated in the US dollar. Another 21 percent is in EUR (83 percent collectively between the top two). Roughly 10 percent is split between JPY and GBP.
Then there are traces of the Chinese renminbi (RMB), Canadian dollar (CAD), Australian dollar (AUD), and Swiss franc (CHF). Beyond that, only 2.5 percent are comprised of other currencies.
Emerging and frontier markets are simply too risky for reserve managers to deal with. That means institutions that are more willing to go out over the risk curve, like hedge funds, family offices, prop traders, and similar entities, will predominantly be the ones to fund these countries. They are also more nimble than banks when it comes to getting funding to these areas, whether its through direct investments in their capital markets, public or private, or through specialty lending.
Emerging markets should not necessarily dominate a portfolio due to their risks, but having balanced allocations in these countries, with some 10-20 percent of the overall allocation could make sense to tap into the higher returns streams.
Wrapping it all together
Personally, as a US-based trader/investor, my allocation goes something like the following:
– 60% US
– 5% other developed markets
– 5% China
– 15% emerging markets
– 10% gold
– 5% commodities
These include positions taken in rates, fixed income, and equities markets. Of course, when you invest in US-domiciled companies that are included the S&P 500, you are still getting considerable foreign exposure. Forty-three percent of S&P 500 revenue comes from abroad/non-US sources. If you go to tech companies, that goes up to 60 percent.
So, the driver of the cash flow that underlies US equity markets is still materially driven through overseas sales. For those who want more domestic US sales exposure, they should allocate more to US small caps, whose sales operations are typically domestic, with 79 percent of S&P Small Cap 600 revenues US-based.
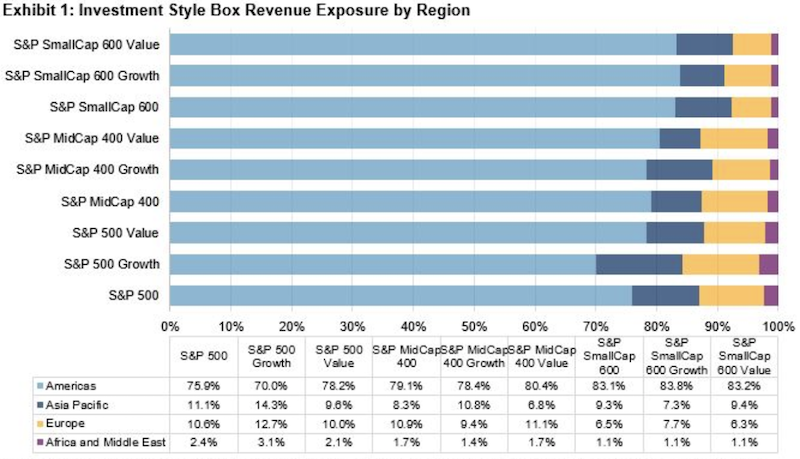
(Source: S&P Dow Jones Indices LLC, FactSet)
Conclusion
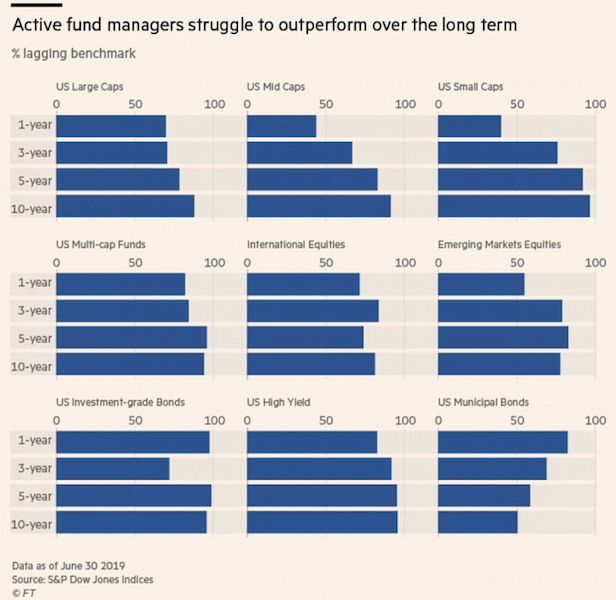
Long-term, we’ve all heard the statistic that 95 percent of traders lose money.
Even among professional institutional funds, this is true in the sense of underperforming a basic benchmark. The chart below, courtesy of the Financial Times, shows the percent of active managers underperforming benchmarks based on 1-, 3-, 5-, and 10-year timeframes. The statistics are particularly poor in all asset classes.
Traders tend to be best off having a more passive, balanced allocation in order to ensure their success over the long-run.
Categorically, they have three main geographical areas to invest in.
First, are developed markets, which are “over-invested” and have low forward returns across the board.
This is because the central banks in these parts of the world (Federal Reserve, ECB, BOJ, BOE) are struggling with low growth and low inflation; to compensate, they’ve pushed a lot of cash into the private sector through quantitative easing. This pushes up the prices of financial assets and decreases their yields.
Then you have China and parts of Asia that are most similar to developed markets with low interest rates (e.g., South Korea, Singapore, Taiwan, Hong Kong). China is a burgeoning economy that’s expected to challenge the US at some point in economic and technological supremacy. The others are more export-oriented economies.
Then you have the emerging markets, which carry higher returns in exchange for higher risk. This gives you access to higher growth rates and diversification to different markets and currencies.
You also have the non-geographic sources of diversification like commodities, including gold. Commodities are assets that are unique in that they are no one’s liability, unlike financial assets. One person’s debt or one company’s equity is another person’s asset.
Commodities can be thought of as alternative stores of wealth, a growth-sensitive asset class, and a mix of individual markets subject to their own supply and demand considerations. They’re not the best investments over time, but they do well in a certain environment. They are, in my view, key to having a balanced portfolio along with having the standard mix of financial assets.