Balanced Beta: Efficiently Balancing Risk, Not Capital


Traders and investors increasingly recognize that concentrated portfolios are very risky and unnecessary for meeting their long-run return objectives.
This is leading more asset allocators to the balanced beta approach, which we’ll explore in this article.
Key Takeaways – Balanced Beta
- Risk Balancing
- Balanced beta focuses on equalizing risk across different economic environments (rising/falling growth, rising/falling inflation), not just allocating capital.
- Improved Risk-Adjusted Returns
- A balanced portfolio can achieve similar returns to equity-centric portfolios with significantly lower volatility and drawdowns.
- Structural Approach
- Instead of relying on unstable correlations, balanced beta uses the inherent pricing structure of assets to create diversification.
- Four-Quadrant Strategy
- Allocate risk equally across assets that perform well in four key scenarios:
- rising growth/inflation
- rising growth/falling inflation
- falling growth/rising inflation, and
- falling growth/falling inflation
- All assets have environmental biases where they have a higher probability of performing well when the discounted expectations are favorable to them.
- Of course, many approaches may modify this based on changes in discount rates and risk premiums between assets if the extra return justifies the imbalance.
- Flexibility
- Balanced Beta can be calibrated to achieve desired risk-return profiles, potentially offering 2-3 times higher return-to-risk ratios compared to traditional portfolios.
Balanced Beta Asset Breakdown
- Rising growth/inflation – Commodities, energy stocks
- Rising growth/falling inflation – Equities (tech, growth stocks), long-term government bonds, corporate bonds
- Falling growth/rising inflation – Gold, precious metals, some commodity equities, some defensive stocks, short-term bonds, inflation-linked bonds (TIPS)
- Falling growth/falling inflation – Cash, Treasuries, high-quality government bonds, defensive sectors like utilities
Balanced Beta Example Allocations
- Conservative Balanced Beta:
- 25% US Treasuries
- 20% TIPS
- 20% High-quality corporate bonds
- 15% Gold
- 15% Broad market equities
- 5% Commodities
- Growth-Oriented Balanced Beta:
- 45% Broad market equities
- 20% Long-term government bonds
- 15% TIPS
- 10% Commodities
- 10% Gold
- Income-Focused Balanced Beta:
- 30% Dividend-paying stocks
- 20% High-yield corporate bonds
- 15% TIPS
- 15% Long-term Treasuries
- 10% REITs
- 10% Precious metals
- Global Balanced Beta:
- 35% Global equities
- 20% Developed market government bonds
- 15% Emerging market bonds
- 15% Gold
- 10% International inflation-linked bonds
- 5% Global commodities
- Tactical Balanced Beta:
- 40% Sector-rotated equities
- 20% Intermediate-term Treasuries
- 20% TIPS
- 10% Managed futures
- 10% Actively managed commodities
- *Be sure to have sufficient cash on hand for liquidity purposes and to take advantage of opportunities.
What is Beta?
Beta, in this case, refers to a market exposure to a certain asset class.
For example, investing in the S&P 500 through an ETF or through the futures market would be considered stock/equity beta.
Investing in a mix of US Treasuries would provide exposure to nominal rate bond beta.
A commodities mix, such as the Dow Jones AIG Commodity Mix, would provide access to commodities beta, and so on.
Different asset classes are accordingly often called betas.
Balanced Beta Asset Allocation
The balanced beta asset allocation principles laid out in this article is fundamentally about better balancing a portfolio’s risk exposures relative to what is offered by traditional, equity-centric approaches to asset allocation to better improve investment outcomes.
More investors are moving increasingly in this direction by balancing their bets in an efficient way, which is good to see.
The 2008 financial crisis helped provoke such a shift.
Achieving reliable balance is based on an understanding of the environmental sensitivities that are intrinsic in the pricing structure of asset classes (e.g., stocks, nominal and inflation-linked bonds, gold, commodities, and so on), and risk-adjusting them to neutralize their influence in a portfolio.
The result is an efficient extraction of the risk premium over time.
The Issue with Traditional Asset Allocation
Traditional asset allocation takes an approach where it tolerates higher risk through a concentration in equity risk in order to obtain higher long-run returns.
A conventional portfolio like the 60/40 has, as implied, 60 percent of its dollars in equities. Because stocks are more volatile than bonds, it has roughly 90 percent of its risk in equities as well.
That’s anything but a balanced portfolio. While seemingly somewhat balanced based on dollar amounts, it’s heavily skewed on risk. The idea is to balance risk, not capital.
Accordingly, the standard 60/40 approach (and similar variations) has a major flaw – if the source of risk is a heavy concentration in a single type of asset, then underperformance in that asset can undermine the entire strategy.
This approach brings with it a significant risk of poor long-term returns that threatens the ability for many managers to meet future obligations.
This is especially true given how pervasive large concentrated bets in equities are among individual and institutional portfolios.
Every asset is vulnerable to poor performance. Everybody’s favorite asset class – whether that’s stocks, bonds, gold, oil, or whatever it is – will see a 50-70 percent (or more) decline in their lifetimes.
Moreover, such poor performance can last for a decade or more as a result of a sustained shift in the economic environment.
These shifts also occur with enough frequency that you are essentially certain to experience them in your lifetime.
As a result, the long-term risk of holding a portfolio that is concentrated in equities, or in any other asset or asset class, is much greater than most investors realize. It’s also, in reality, a risk that’s too great for them to withstand.
Unfortunately‚ this concentration is a type of risk that the global pension fund industry has widely taken‚ where they take various types of equity risk – e.g., stocks, real estate, private equity (a form of leveraged equity), and hedge funds heavily concentrated in stocks and other equity-like investments.
This type of inefficient portfolio construction, in turn, has led to today’s widespread underfunded status.
The good news is that this form of concentration risk is not necessary to take in order to achieve the higher returns they’re seeking.
A balanced portfolio will also have short-term risk. But it can be neutralized to the sustained shifts in the economic environment.
This implication that short-term risks can cancel out over time, allowing an investor to more consistently achieve the higher long-term returns that they’re looking for.
Collecting the Risk Premium Efficiently
The basic question boils down to:
What mix of assets provides the best chance of delivering good returns over time through all economic environments?
Achieving more return for less risk is the goal for anyone in the financial markets, or in any business generally.
You know that if you pile into stocks you’re making a big bet on growth running above expectation. That comes with big, painful drawdowns when that isn’t the case.
You also can’t get to a reliable answer through the traditional approach that depends on correlation and volatility assumptions.
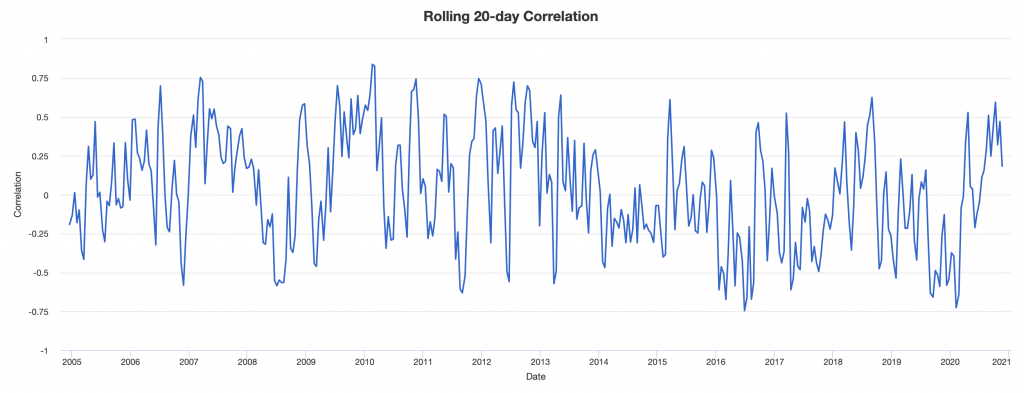
Correlations are neither stable nor predictable over time. They also tend to change in the worst way at the worst possible time.
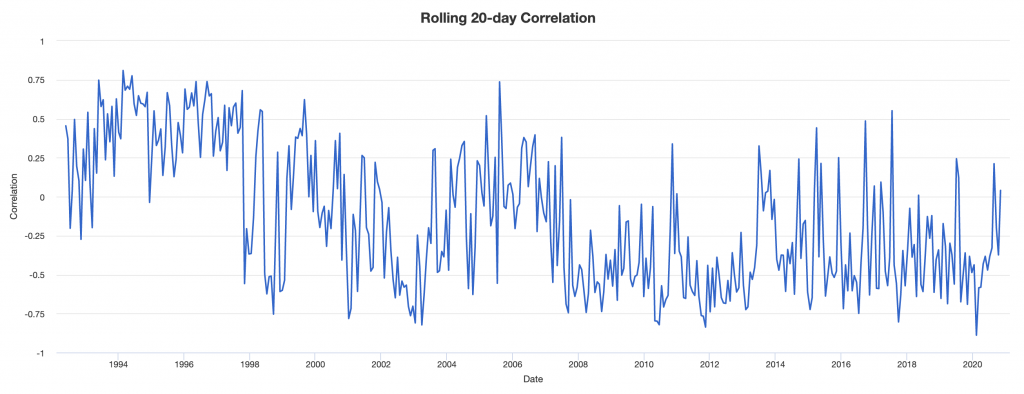
A couple correlations are shown below on a 20-day rolling average basis.
The first is stocks and US Treasury bonds; the second is stocks and gold. Notice their instability over time.
Stocks – US Treasury bonds correlation

Stocks – gold correlation
Also, asset risk is difficult to predict. When things get bad, risks tend to go substantially higher in the worst way.
On top of that, most measures of risk don’t sufficiently account for the potential that sustained unfavorable environments can produce chronically poor investment returns.
The Pricing Structure Inherent to All Asset Classes
To answer the question of how you can get an excellent strategic asset allocation mix that can produce reliable returns in all economic environments, you have to go back to the pricing structures inherent in all asset classes.
There are a couple things that you can be pretty sure of over time. There are two enduring and universal truths about asset pricing. These are principles that form the foundation of the balanced beta approach:
i) Asset classes outperform cash over time
People with good uses for cash take it and use it to create goods and services that are needed and/or desired by other people.
When this isn’t true, you have a depression. When you have a depression, policymakers have big incentives to get the economy going again.
ii) Asset prices reflect the discounted expectations of future economic scenarios
These two principles are the primary determinants of asset pricing. This is because they bear out the essential factors that market participants require from an investment transaction.
Assets must outperform cash
Regarding the first, whenever you make an investment you are transferring liquidity from yourself to someone else.
That transfer carries risk. Giving up liquidity today creates an opportunity cost.
This is the risk that you lose an opportunity to put that liquidity to work in something else that either gives you immediate utility (buying goods and services) or something else of a different return and risk characteristic (savings of investment assets).
So, any investment needs to offer you a compensation – known as a risk premium – that’s beyond what you could earn by keeping your money in cash.
By that same rationale, the more risk you take on, the more compensation you require.
Assets reflect discounted future discounted cash flows
Regarding the second, an asset’s present value (i.e., its price) reflects the discounted value of the asset’s expected future cash flows.
These expected cash flows, in addition to the discount rate, take into account expectations about the future economic environment.
This includes such things as the level of inflation, economic growth (which feeds into earnings growth), the probability of default of a credit asset, and so forth.
As the economic environment and expectations about it change, the asset pricing will change as well.
For instance, if inflation goes up, expectations about the value of money going forward change. Accordingly, this change in future inflation expectations will be priced into the value of assets today.
So with these structural elements of pricing, we have two primary drivers:
i) the accrual of and changes in risk premiums, and
ii) shifts the economic environment (inflation and growth being the primary two) relative to what’s already discounted in
The goal of strategic asset allocation is accordingly to collect risk premium in the most consistent and efficient way possible.
This is done by minimizing the amount of risk taken on due to unanticipated shifts in the economic environment.
This is different from tactical asset allocation, such as betting on what stocks are going to be good and bad, which is a zero-sum game (i.e., adding value relative to a representative benchmark).
The Flaw in Relying on Correlation and Volatility Assumptions
The balanced portfolio framework de-emphasizes the reliance on correlation and volatility assumptions due to the differing reactions of stocks and bonds to different economic conditions.
Stocks, representing the value of discounted earnings over time, increase in value with higher-than-expected economic strength.
Conversely, bonds benefit from lower-than-anticipated interest rates, reflecting economic weakness.
While these asset classes respond oppositely to growth expectations, they share similar reactions to inflation expectations, which challenges the predictability of their correlation based on past trends where growth surprises dominated.
Note the mostly inverse correlation between stocks and bonds going back to 1992. The average over the period is minus-0.23 (minus-1.00 being a perfect negative correlation and positive-1.00 being a perfect positive correlation).
But if inflation were the thing that mattered you would think that stocks and bonds would be positively correlated.
Given the opposite sensitivities to growth and same sensitivities to inflation, what will be the future correlation of stocks and bonds?
You don’t know this information without knowing what the future economic environment will be like relative to what’s already discounted into the markets.
This is what makes trading and investing difficult to do on a tactical level.
Betting on what countries or what companies are going to do better or worse than each other isn’t hard. (The same is true if you’re betting on horses at the racetrack or betting on which teams will win certain matchups on the field.)
But it’s difficult to convert this knowledge into winning bets in excess of a benchmark because what’s already known is already discounted in the price. In addition, the range of unknowns is large relative to the range of knowns.
And that’s a problem if you’re trying to build a portfolio that does well in all environments.
So, you need to go beyond just stocks and fixed-rate bonds when constructing a portfolio if your goal is to weather all environments equally well.
Balanced Beta Will Help You Reliably Weather Shifts in Economic Conditions
The pricing structure of different assets leads one to the balanced beta approach.
A balanced portfolio recognizes that the only way to achieve reliable diversification is to balance a portfolio based on the relationships of assets and asset classes to their environmental drivers.
This will give better results than making assumptions about correlations and/or volatilities.
Correlations are transient byproducts of these relationships. They are unstable and not reliable enough to bet on.
From this, you can recognize that different asset classes provide about the same risk premium once adjusting for risk.
For example, bonds provide about the same risk premium as equities when adjusting for the fact that stocks are riskier than bonds; namely, when they are risk-matched.
Stocks have longer duration being perpetual instruments while most bonds have a fixed maturity.
But at the same time, their intrinsic sensitivities to changes in the economic environment are different.
To obtain balance, structuring the portfolio involves:
a) risk-adjusting asset classes, and
b) balancing them well so that their environmental biases reliably offset one another
If this is done well, it leaves the risk premium as the dominant driver of the portfolio’s returns.
Earlier, we covered the instability of the correlations between stocks and bonds.
They have opposing sensitivities to economic growth (stocks are biased to positive growth relative to expectations and bonds biased toward negative growth relative to expectation).
And they have similar sensitivities with respect to inflation.
Though assets of various types include a wide variety of information in their prices beyond these two factors, growth and inflation and their future path are the most important.
This is due to the fact that the total cash flows of an asset class and the rate at which these cash flows are discounted are determined by:
a) the volume of economic activity (growth), and
b) the pricing of that activity (inflation)
As a consequence, the returns of asset classes will be largely determined by how these two forces shift in relation to what’s discounted into the expectations of all asset classes.
Namely, does growth come in higher or lower than expectation and does inflation come in higher or lower than expectation, and how discounted growth and inflation change.
Both the discounted level and the discounted rate of change of each factor are important.
Asset performance in relation to growth and inflation is not only reliable, but it’s also ascertainable. It’s based on the durations of assets and in the sources of variability of assets’ cash flows. If the income stream of an asset is longer then we can be pretty that it will have structurally higher volatility.
Moreover, when volatility spikes in one asset class, we can also know that it’s likely to spike proportionately among all asset classes. For example, the risk that the volatility of, e.g., bonds increases by a much greater proportion than that of, e.g., equities for a significant period is low.
Indeed, changes in the volatilities of different asset classes have a significant positive correlation.
If we borrow cash at X% and use it to invest in, for example, bonds at (X+2)%, then we are adding an expected two percent in additional return by taking extra duration risk, which is the key determinant of the risk premium.
Moreover, the equity risk premium (i.e., the extra compensation required for investing in stocks over bonds or cash) is higher because companies have debt. Common shareholders are the last ones paid in a company’s capital structure and get paid after debtholders and other claimants.
The average public company has about equal amounts of debt and equity capitalization. Debt being senior to equity, shareholders demand a higher premium. If companies were no longer able to borrow, the risk and return of equity would be lower.
We know that, for example, each one percent increase in inflation will adversely impact stocks more relative to bonds. This is because the duration of stocks is higher than that of bonds.
The Four Buckets or Sub-Portfolios
To account for these relationships, a balanced portfolio will seek to hold similar exposure to assets that do well in each of the main four environments:
- Rising growth / rising inflation
- Rising growth / falling inflation
- Falling growth / rising inflation
- Falling growth / falling inflation
Essentially you have four different buckets or sub-portfolios within a single portfolio that captures each of these four risk exposures. Twenty-five percent of the risk is put into each.
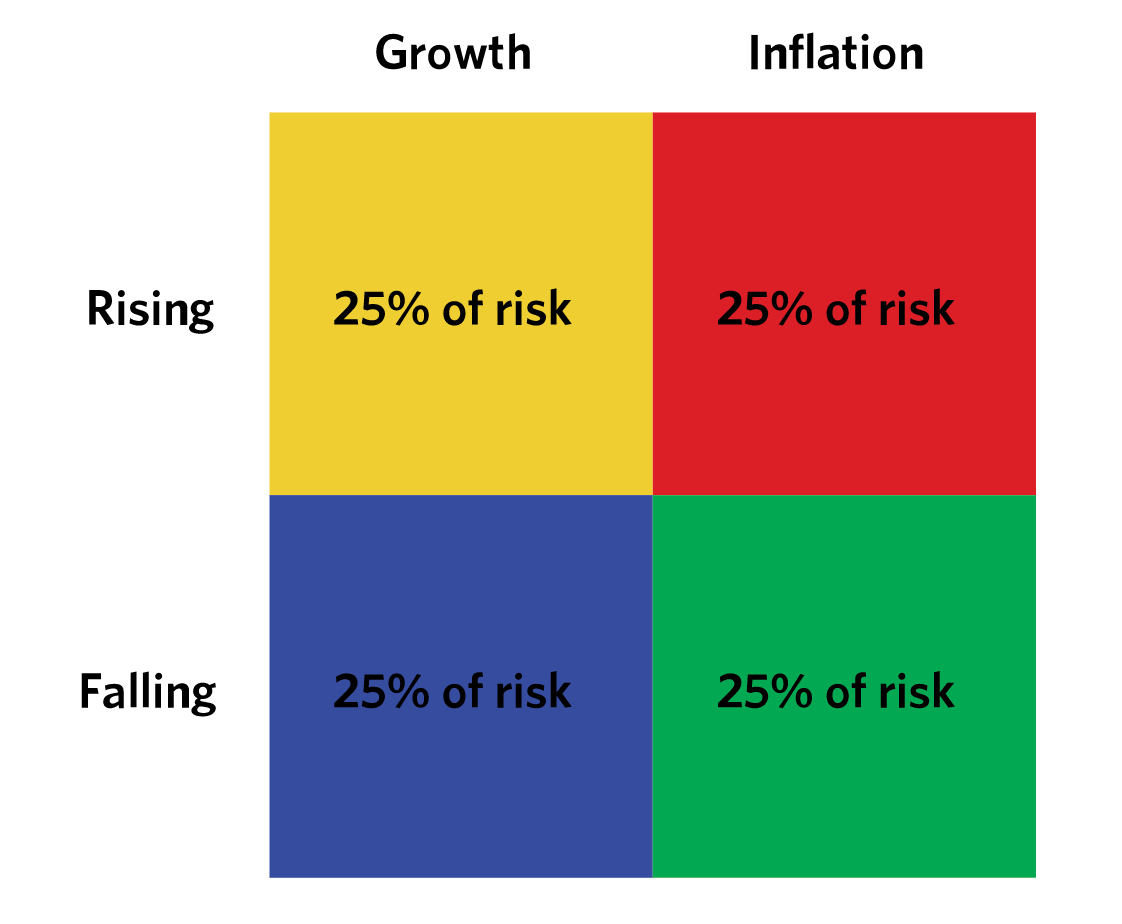
The risk is spread evenly across these four buckets. Namely, this is done to avoid assuming the market has a systematic bias toward over- or under-discounting future growth or inflation outcomes.
One conception of how different asset classes might fit along this dual spectrum is shown below. It’s for illustrative purposes only. It is not necessarily an indication of any actual historical or current implementation of the strategy.
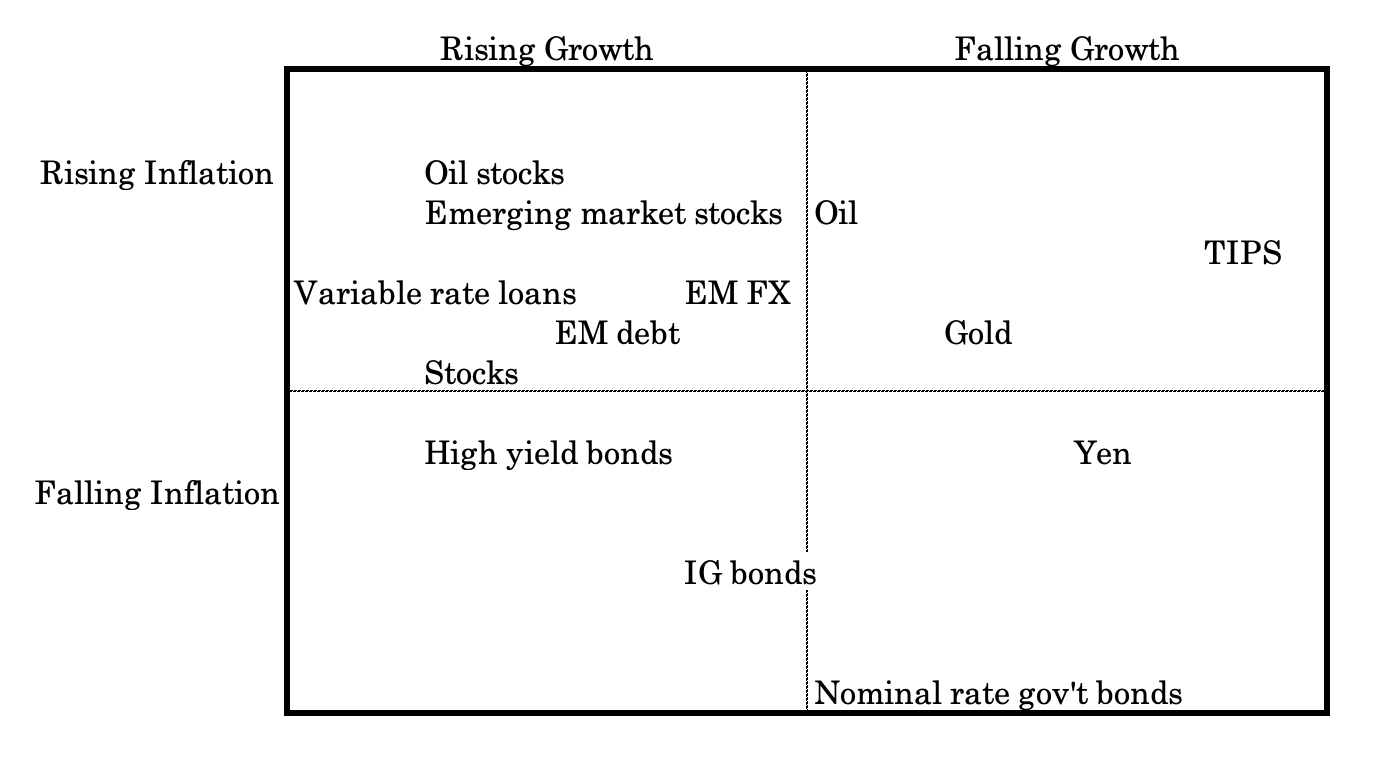
It also shows the general idea that no specific asset class is necessarily a perfect rising/falling growth/inflation asset.
While investment-grade (IG) corporate bonds are a falling inflation asset, they are neither particularly biased heavily toward higher or lower growth. Higher growth benefits corporations and their bonds, but the demand for safety and liquidity increases as markets fall. Safe corporate bonds are often one conduit where this capital flows.
For example, when the stock market fell 37 percent in 2008, safe corporate bonds actually slightly rose.
Oil is also hard to put into a perfect box. While it is clearly a rising inflation asset, its impact on growth is not as clear. For oil-exporting countries, its impact on growth is positive; for oil-importing countries, its impact on growth is negative, all else equal.
Defining Asset Types: ‘Rising Growth’ / ‘Falling Growth’ / ‘Rising Inflation’ / ‘Falling Inflation’ Assets + ‘Risk Matching’
Rising growth, or how to define a “rising growth” asset, for example, might be defined as commodities minus inflation-linked bonds.
In other words, in terms of a “rising growth” trade, this might mean long commodities and short inflation-linked bonds. They both have the same sensitivity to inflation but different sensitivity to growth.
Going long commodities and short inflation-linked bonds would cancel out the inflation component, leaving you with a “long growth” bet.
It’s important to note that they have to be risk-matched.
Risk matching accounts for the different durations among assets (which feeds into their volatilities).
Commodities are more volatile than inflation-linked bonds. So commodities naturally have a lower allocation in the portfolio relative to inflation-linked bonds.
A falling growth asset represents nominal rate bonds minus stocks.
Stocks are more volatile than nominal rate bonds, so the weighting of nominal rate bonds is higher to match their risk.
A rising inflation asset denotes commodities minus stocks.
Most commodities are more volatile than stocks, so the weight of stocks is higher in a portfolio to match their risk.
Certain types of commodities might also be weighted more in a portfolio. For example, gold is a long duration store of wealth asset that is better thought of as a currency.
Its weight would be higher than something like oil, which is more volatile and not as good of a diversifier with respect to “growth” assets like stocks.
A falling inflation asset is represented by nominal rate bonds minus inflation-linked bonds.
With a bond portfolio, you can match their weighted durations to get the same overall risk, holding credit risk constant.
For US Treasury bonds, there is virtually no credit risk. So matching their risk involves matching their durations.
Similarly, isolating the US inflation rate would involve going long TIPS and short equal-duration nominal rate Treasuries.
How Balance Improves Risk-Adjusted Returns
Most people’s favorite asset class is stocks.
They’re liquid and provide higher returns than bonds over the long-run.
So, in terms of the traditional asset allocation, traders and investors will tend to overweight equities to get the most return.
That involves a lot of risk because it’s essentially a huge bet on growth running above expectation with moderate to low inflation.
An underperformance of stocks, or any given asset class relative to its risk premium in a particular environment, will be automatically offset by the outperformance of another asset class with an opposing sensitivity to that environment.
For example, a big drop in growth will benefit government nominal rate bonds.
But if there’s higher than expected inflation, this will hurt stocks and bonds.
This underperformance can be offset by having exposure to commodities and inflation-linked bonds, for example.
If that balance is done well, the risk premium is left as the dominant source of returns. Accordingly, the result is a more stable overall return from the portfolio.
These isolations of rising growth, falling growth, rising inflation, and falling inflation constructions should respond similarly in magnitude if balanced well. Both combinations will rise/fall in opposite directions to each factor.
Accordingly, balancing “rising” assets with “falling” assets should reliably mitigate the impact of these environmental shifts.
This is because it’s derived from an understanding of the nature of assets’ pricing structures and doesn’t depend on volatility or correlation assumptions that aren’t stable.
Balance Outperforms Anywhere on the Risk and Return Spectrum
Target returns and diversification don’t have to be trade-offs.
Under the traditional asset allocation approach, they are. The typical thinking among pension funds is that they want to take equity risk up to a level they feel comfortable with and throw in some less volatile assets (mostly bonds) for the remainder.
Or in the way individual portfolios are traditionally tailored, where they typically have younger individuals in a lot of stocks at first. It’s believed they can tolerate the high equity risk because it’s worth the return. As they get closer to retirement, then the portfolio shifts more into bonds to be defensive and preserve capital.
The standard 60/40 portfolio seems somewhat balanced, but it’s anything but balanced. Equities are riskier than bonds so stocks take up around 90 percent of the portfolio’s risk. Long-run returns are constrained because it takes money out of stocks and puts it in lower-returning bonds.
A balanced portfolio can match the expected return of equities but at a lower risk. It does so by bringing up the other parts of a portfolio, often (but not always) through the use of futures. This gives you access to certain exposures at lower margin requirements.
Or it can be done by leveraging the cash assets by borrowing at the risk-free rate. Risk and return can be calibrated accordingly.
A balanced portfolio will provide a higher ratio or return to risk than one concentrated in any given asset or asset class.
A well-balanced portfolio should provide a return to risk ratio that’s 2x-3x higher than that of a traditional portfolio that’s dominated by equity beta.
Balanced Beta Example
Let’s take this example of a balanced beta allocation:
Portfolio Allocations
| Asset Class | Allocation |
|---|---|
| US Stock Market | 22.00% |
| Long Term Treasury | 35.00% |
| Precious Metals | 3.00% |
| TIPS | 27.00% |
| Gold | 10.00% |
| Global Bonds (Unhedged) | 3.00% |
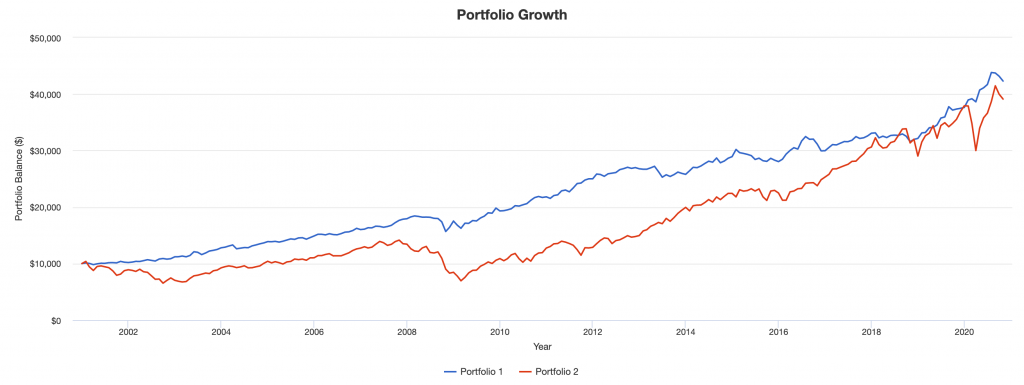
“Portfolio 2” will be a standard allocation toward stocks.
Due to TIPS data that only sufficiently goes back to the beginning of 2001, January of that year is our starting point.
Portfolio Returns
| Portfolio | Initial Balance | Final Balance | CAGR | Stdev | Best Year | Worst Year | Max. Drawdown | Sharpe Ratio | ||
|---|---|---|---|---|---|---|---|---|---|---|
| Portfolio 1 | $10,000 | $42,302 | 7.54% | 6.78% | 17.04% | -3.67% | -14.94% | 0.90 | ||
| Portfolio 2 | $10,000 | $39,117 | 7.12% | 15.38% | 33.35% | -37.04% | -50.89% | 0.43 |
We can see that over this period, we’ve gotten slightly better returns at just 44 percent of the risk. Our max drawdown is only about 30 percent as deep and our Sharpe ratio more than doubles.
We see a smoother overall path for the balanced beta (blue) versus stocks (red).
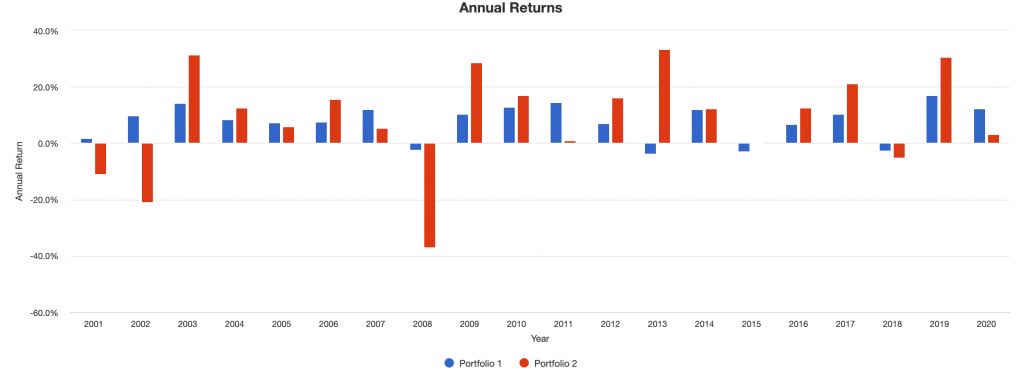
Down years are rarer and much shallower for balanced beta (blue):
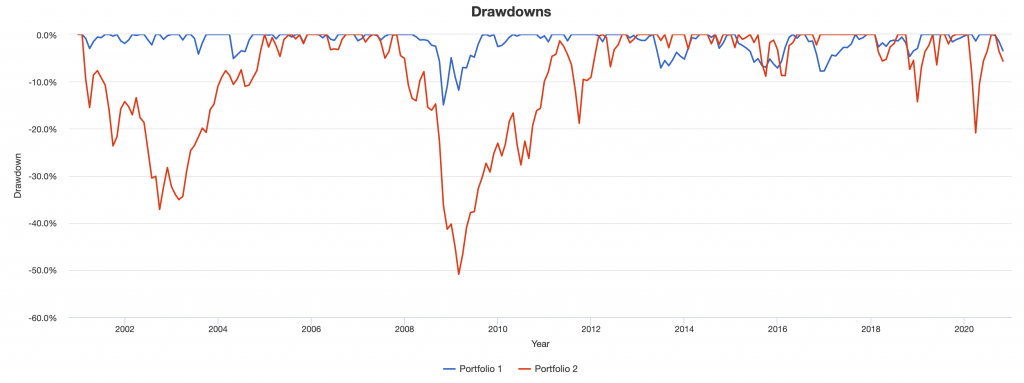
Drawdowns are mild and underwater periods are shorter for the balanced beta allocation.
If we look at the individual assets in the portfolio (shown in the chart below), we can see that if we just concentrated in one, we would have had terrible drawdowns.
Even in this ~20-year sample, stocks, gold, and precious metals as a whole had very large drawdowns.
Portfolio Assets
| Name | CAGR | Stdev | Best Year | Worst Year | Max. Drawdown | Sharpe | ||
|---|---|---|---|---|---|---|---|---|
| US Stock Market | 7.12% | 15.38% | 33.35% | -37.04% | -50.89% | 0.43 | ||
| Long Term Treasury | 7.05% | 11.13% | 29.28% | -13.03% | -16.68% | 0.54 | ||
| Precious Metals | 9.36% | 31.68% | 76.46% | -56.02% | -76.43% | 0.40 | ||
| TIPS | 5.10% | 5.75% | 16.61% | -8.92% | -12.50% | 0.65 | ||
| Gold | 9.80% | 16.62% | 30.45% | -28.33% | -42.91% | 0.56 | ||
| Global Bonds (Unhedged) | 5.65% | 7.18% | 21.33% | -6.36% | -17.49% | 0.61 |
This higher return to risk ratio for the balanced beta allocation can be used to achieve the same return for less risk, greater return for the same risk, some combination in between, or whatever the desired risk one prefers within reasonable constraints.
It also comes with a host of other benefits. For example:
- Left-tail risk will be smaller
- Drawdowns will be milder
- Underwater periods will be shorter (rather than lasting for many years)
- Upside to downside capture will be higher
Your beta to the equity market will also be very low, often somewhere in the 0.0-0.3 range or so, depending on the exact construction.
Some investors may even run a balanced portfolio alongside a traditional equity-centric portfolio, knowing that they have a largely differentiated source of returns, with less risk per unit of return.
For a fuller set of statistics, please see the Appendix to this article.
Balanced Beta Allocations of Various Approaches
Conservative Balanced Beta
This allocation is designed for risk-averse investors who prioritize capital preservation while still seeking moderate growth.
- 25% US Treasuries – Provides a safe haven during economic downturns and helps balance portfolio risk.
- 20% TIPS (Treasury Inflation-Protected Securities) – Offers protection against inflation, which is particularly important in a conservative portfolio.
- 20% High-quality corporate bonds – Generates higher yields than government bonds while maintaining relatively low risk.
- 15% Gold – Acts as a hedge against currency depreciation, a long-term inflation hedge, and a hedge against economic uncertainty.
- 15% Broad market equities – Offers potential for capital appreciation and dividend income.
- 5% Commodities – Provides additional inflation protection and portfolio diversification.
This portfolio has a strong tilt towards fixed income (65% in bonds), which helps reduce volatility.
The inclusion of TIPS and gold (35% combined) offers inflation protection.
The small allocations to equities and commodities (20% combined) provide some growth potential and additional diversification.
This allocation is well-suited for retirees or investors nearing retirement who want to protect their wealth while still maintaining some exposure to growth assets.
Growth-Oriented Balanced Beta
This allocation targets investors seeking higher returns who can tolerate more short-term volatility.
- 45% Broad market equities – Forms the core of the growth component, offering strong potential for capital appreciation.
- 20% Long-term government bonds – Provides a counterbalance to equities, often performing well when stocks struggle.
- 15% TIPS – Offers inflation protection, which is important even in growth-oriented portfolios.
- 10% Commodities – Adds further inflation protection and potential for growth during economic expansions.
- 10% Gold – Serves as a hedge against economic unknowns and currency fluctuations.
This portfolio maintains a significant tilt towards growth assets (55% in equities and commodities) while still incorporating balancing elements.
The large allocation to equities drives potential returns, while the bonds (35% total) provide stability and income.
The commodity and gold allocations (20% combined) offer inflation protection and additional diversification.
This allocation is appropriate for younger investors or those with a longer time horizon who can weather market volatility in pursuit of higher long-term returns.
Income-Focused Balanced Beta
This allocation is tailored for investors prioritizing regular income streams while maintaining some growth potential.
- 30% Dividend-paying stocks – Provides a steady income stream with potential for capital appreciation.
- 20% High-yield corporate bonds – Offers higher income than investment-grade bonds, albeit with more risk.
- 15% TIPS – Protects the income stream against inflation erosion.
- 15% Long-term Treasuries – Balances portfolio risk and provides additional income.
- 10% REITs (Real Estate Investment Trusts) – Offers exposure to real estate, typically with high dividend yields with an obligation to payout 90% of their taxable income to shareholders.
- 10% Precious metals – Acts as a hedge against inflation and economic uncertainty.
This portfolio focuses on income-generating assets (75% in dividend stocks, bonds, and REITs) while maintaining inflation protection and growth potential.
The mix of dividend stocks and high-yield bonds provides higher income than a traditional bond-heavy portfolio.
The inclusion of TIPS and precious metals (25% combined) helps protect the income stream against inflation.
This allocation is well-suited for retirees or investors who rely on their portfolio for regular income but still want some growth potential.
Global Balanced Beta
This allocation provides broad exposure to global markets, trying to capture worldwide growth opportunities while managing risk.
- 35% Global equities – Offers exposure to both developed and emerging market stocks for growth potential.
- 20% Developed market government bonds – Provides stability and income from major global economies.
- 15% Emerging market bonds – Offers higher yields, albeit with more risk, and exposure to fast-growing economies.
- 15% Gold – Serves as a global hedge against economic uncertainty and currency fluctuations.
- 10% International inflation-linked bonds – Protects against inflation across various economies.
- 5% Global commodities – Adds further diversification and inflation protection.
This portfolio provides truly global exposure, with assets spread across developed and emerging markets.
The equity allocation (35%) drives growth, while the diverse bond holdings (45% total) offer stability and income from various sources.
The gold and commodity allocations (20% combined) provide a hedge against global economic unknowns.
This allocation is ideal for those seeking to diversify beyond their home country and capture global growth opportunities.
Tactical Balanced Beta
This allocation incorporates active management strategies within a balanced framework, looking to capitalize on short to medium-term market opportunities.
- 40% Sector-rotated equities – Allows for tactical shifts between sectors based on economic conditions and market trends.
- 20% Intermediate-term Treasuries – Provides a stable core holding while offering some flexibility in duration management.
- 20% TIPS – Offers consistent inflation protection.
- 10% Managed futures – Provides exposure to trends across various asset classes, potentially improving returns and reducing portfolio volatility.
- 10% Actively managed commodities – Allows for tactical positioning within commodity markets.
This portfolio maintains a balanced approach but incorporates more active strategies.
The sector rotation in equities and active management in commodities allow for tactical positioning based on market conditions.
The managed futures component adds a non-correlated return stream.
The fixed income allocation (40% in Treasuries and TIPS) provides stability and inflation protection.
This allocation is suitable for traders/investors who believe in the potential for active management to add value but still want to maintain a balanced, risk-managed approach.
General Considerations
Across all these allocations, it’s important to maintain sufficient cash reserves.
Cash serves two primary purposes:
- Liquidity – Have funds available for short-term needs without having to sell assets at inopportune times.
- Opportunity fund – Allows you to take advantage of market dislocations or particularly attractive investment or trading opportunities as they arise.
The exact cash allocation will depend on individual circumstances, but a general rule of thumb is to keep 3-6 months of living expenses in cash, plus any additional amounts earmarked for near-term large expenses or investment opportunities.
Note that these allocations should serve as starting points.
They should be tailored to individual circumstances, including:
- Risk tolerance
- Investment time horizon
- Tax considerations
- Specific financial goals
- Existing holdings or restrictions
Regular rebalancing is important for maintaining the intended risk profile of these balanced beta allocations.
As different assets perform differently over time, the portfolio can drift from its target allocation.
Rebalancing, typically done annually or when allocations drift beyond predetermined thresholds, helps maintain the intended balance.
Lastly, while these allocations try to provide balance across different economic environments, they aren’t immune to market volatility or drawdowns.
Even well-diversified portfolios can experience losses in severe market downturns.
The goal of balanced beta is not to eliminate risk entirely, but to manage it effectively and provide more consistent returns across various market environments.
‘More Is Better’ Is Not Always Better
It should be prefaced with anything, that there are many, many approaches that can work in the markets. This article is about just one.
That said, there is a common belief that the more risks you take, the higher the reward you can potentially earn.
While it’s true that being less balanced in one’s approach may lead to making more money in the short term, it’s important to note that such a strategy can be disastrous in the long run.
Investors who approach trading with a “more is better” mentality tend to focus on high-risk, high-reward investments, often ignoring the benefits of a diversified portfolio.
While diversification may not provide the highest possible return (especially in the short-run), it can help to lower risk, maximize reward-to-risk, and protect one’s investments from market downturns when done well.
It can also be done without reducing returns.
One of the key failures of an unbalanced approach is that it leaves investors exposed to market volatility.
This can be especially problematic during times where expected outcomes are wider than normal, where investors may experience significant losses due to unexpected market downturns.
While no investment strategy can completely eliminate risk, diversification can help to mitigate some of these risks by spreading out investments across different asset classes and sectors, and also among different countries and currencies.
Another major drawback of a less balanced approach is the inability to adapt to changing market conditions.
When economic conditions shift, different asset classes and investment strategies may become more or less attractive.
Investors who have not diversified their portfolios may find themselves stuck with investments that are no longer performing as well as they once were, leaving them vulnerable to losses.
On the other hand, investors who have diversified their portfolios can take advantage of new opportunities as they arise, potentially earning higher returns in the process.
Where Does The Balanced Approach Do Less Well?
It’s also worth noting that there are certain market conditions that even the most diversified portfolio cannot protect against.
One such condition is a tightening in monetary policy, which occurs when interest rates rise faster than what’s priced into the market.
In these situations, cash tends to outperform other investments, as the present value effect of rising rates leads to lower valuations for other financial assets.
While investors can’t predict when a tightening in monetary policy will occur, they can take steps to prepare for it.
This may involve keeping a portion of their portfolio in cash or other low-risk investments that are less sensitive to changes in interest rates.
By doing so, investors can protect themselves from the worst effects of a tightening in monetary policy, while still benefiting from the long-term growth potential of other financial assets.
In short, while it’s certainly possible to make more money by taking on more risk and being less balanced in one’s investment approach, such a strategy is often not sustainable in the long run.
By diversifying one’s portfolio and not being biased toward one set of market conditions over another, investors can control their risks while still earning respectable returns over time.
While there will always be certain market conditions that are beyond an investor’s control, a well-diversified portfolio can help to provide a measure of protection against the worst effects of market volatility.
Conclusion
Balanced beta is likely to continue to catch on as more traders and investors realize that balance is a better approach to asset allocation.
Fundamental diversification is often considered the “only free lunch” in finance. When done well, even on a modest scale, it provides improved return for each unit of risk taken on.
However, each investor will have their own approach. They will not all be the same nor will each reliably perform through all environments.
It’s prudent to be wary of approaches that are excessively engineered.
These days, with ample amounts of inexpensive computing power, it is easy to feed financial data into a program and get results that suggest how to build a portfolio based on what worked in the past.
The issue with that approach is that markets are complex open systems.
They are not like a game of chess where you can be pretty sure what tactical moves worked before will work going forward. When the future is different from the past and your portfolio is based on the past, you will probably have a problem.
This is why depending on estimations of future volatilities and correlations is dangerous. If your portfolio is optimized to fit what worked best over the past 5-30 years, you’ll see that, for example, stocks and bonds had an inverse correlation.
This is because inflation went down and didn’t have much volatility, leaving quality returns for both stocks and bonds and growth as the main driver. Stocks and bonds have opposing growth sensitivities, so yielded inverse correlations.
But it’s dangerous to engineer a portfolio based on that assumption going forward.
If inflation were to be the dominant driver going forward, you will observe the opposite. So, it’s very risky to assume that past correlations will equal future correlations.
It’s more reliable to estimate the diversification and risk properties of assets based on a fundamental understanding of their pricing structures and approximate assessments of their risks instead of precise or complex quantitative measures.
Some balanced portfolio approaches will also include alpha bets within them. Namely, they do not bet purely on just asset indexes or broad exposure to various asset classes, but rather try to bet on specific components within them.
This is an issue because they may not appropriately size the amounts of alpha and beta based on the quality of each return stream.
To be clear, there is nothing inherently wrong with making tactical bets or concentrated bets one way or another. There are multiple ways to skin a cat; it’s just a different strategy than the balanced beta approach being discussed here.
Most portfolios – both among individual and institutional investors – are way out of balance.
The average institutional portfolio has more than 80 percent of its risk in equities. Accordingly, they are making a big bet that economic growth will run above expectations and inflation will remain roughly in line or below expectations.
Investors naturally cheer higher stock markets because they have so much risk wrapped up in them.
That exposes them to a single adverse event, which could last for decades – a poorly performing equity market. Though it’s not something that has transpired in the lifetimes of most, it does happen.
We are now well more than three decades past the year 1989 – the year Japan’s stock market peaked – and it’s still below that figure.
Some countries are still below their pre-2008 highs, such as Iceland.
The US stock remained underwater from its 1929 highs until 1954, a 25-year underwater period.
US tech had a nearly 16-year underwater period from 2000 to 2016.
Provided the choices investors have, not balancing a portfolio is far riskier than doing so.
Appendix
Below we have more complete statistics on the example balanced beta allocation discussed in this article.
| Metric | Balanced Beta | Stocks |
|---|---|---|
| Arithmetic Mean (monthly) | 0.63% | 0.67% |
| Arithmetic Mean (annualized) | 7.79% | 8.40% |
| Geometric Mean (monthly) | 0.61% | 0.57% |
| Geometric Mean (annualized) | 7.54% | 7.12% |
| Volatility (monthly) | 1.96% | 4.44% |
| Volatility (annualized) | 6.78% | 15.38% |
| Downside Deviation (monthly) | 1.15% | 3.09% |
| Max. Drawdown | -14.94% | -50.89% |
| US Market Correlation | 0.37 | 1.00 |
| Beta(*) | 0.16 | 1.00 |
| Alpha (annualized) | 6.19% | -0.00% |
| R2 | 13.91% | 100.00% |
| Sharpe Ratio | 0.90 | 0.43 |
| Sortino Ratio | 1.48 | 0.61 |
| Treynor Ratio (%) | 37.29 | 6.70 |
| Calmar Ratio | 2.02 | 0.48 |
| Active Return | 0.42% | 0.00% |
| Tracking Error | 14.31% | 0.00% |
| Information Ratio | 0.03 | N/A |
| Skewness | -0.53 | -0.66 |
| Excess Kurtosis | 3.61 | 1.40 |
| Historical Value-at-Risk (5%) | -2.79% | -8.03% |
| Analytical Value-at-Risk (5%) | -2.59% | -6.63% |
| Conditional Value-at-Risk (5%) | -4.17% | -10.32% |
| Upside Capture Ratio (%) | 27.55 | 100.00 |
| Downside Capture Ratio (%) | -0.10 | 100.00 |
| Safe Withdrawal Rate | 8.46% | 5.92% |
| Perpetual Withdrawal Rate | 5.33% | 4.93% |
| Positive Periods | 154 out of 238 (64.71%) | 155 out of 238 (65.13%) |
| Gain/Loss Ratio | 1.29 | 0.79 |
Among the improvements balanced beta has relative to a standard equity-centric portfolio allocation:
- Volatility is cut by 56 percent
- Downside deviation is cut by almost two-thirds
- Max drawdown is only about 30 percent as deep
- Beta is just 0.16 (this is important for an institutional investor trying to offer a differentiated product)
- Alpha is over 600bps per year
- Notable Sharpe, Sortino, Treynor, and Calmar ratio improvements
- Value-at-risk (VaR) is cut by 60-70 percent considering historical, analytical, and conditional approaches
- Upside capture ratio to downside capture ratio is much superior
- Gain/loss ratio is higher