What is a Risk Premium?


The concept of a risk premium is one of the basic foundations of finance and applies to nearly all market participants and private business owners in some form.
A risk premium is the minimum return that a riskier asset must exceed a safer asset in order to incentivize investment into it.
For example, a 10-year US Treasury bond is a relatively safe investment. There’s more price risk than cash given the duration is longer.
But if you invest in a 10-year Treasury bond, you know how much return you’re going to get each year. The yield is consistently advertised.
There are riskier investments that are alternatives. To take on this risk, what does the average investor need to be compensated to move into this asset? This yield differential is known as the risk premium.
Hypothetically, if cash yielded 5 percent interest annually and stocks yielded that same 5 percent, would anyone want to own them with the material price risk associated with the latter?
When people talk about yield curve inversions, this is fundamentally what they’re talking about. It’s a case where a riskier asset (i.e., either duration/price risk and/or credit risk) yields less than a less risky asset.
The 10-year/2-year curve is a common “yield curve inversion” tracker. When an instrument with materially higher duration yields less than something with lower price risk, it’s a signal that the market thinks monetary policy is too tight relative to long-term expectations.
Accordingly, many view the 10/2 curve as a recession signal. It’s often coded into some investors’ algorithms to sell equities and other risk assets. The last time the US 10/2 curve inverted, stocks indeed sold off.
Notice how the 10/2 tends to invert before recessions.
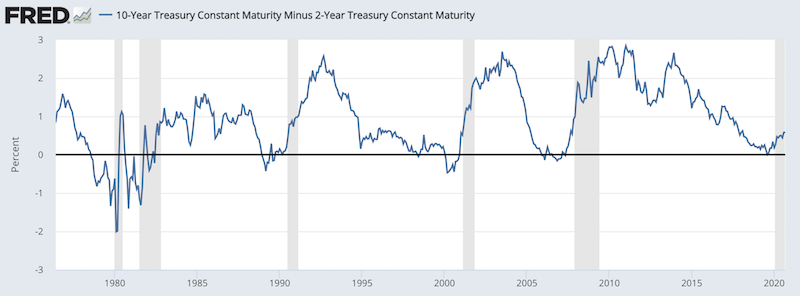
(Source: Federal Reserve Bank of St. Louis)
The recession after the August 2019 inversion was more happenstance.
When riskier assets yield less than safe assets, this incentivizes investors to hold the less risky assets. That generally means less productive investment and a pullback in lending.
There is some level of causal transmission between tighter monetary policy and recession risk, which reflects in the yield curve. The long end of the curve gives some idea of where the average interest rate is expected to settle in the future.
So, the more inverted the curve, the tighter monetary policy is today relative to where the market (i.e., weighted-average opinion) expects it to be down the line.
Key Takeaways – Risk Premiums
- A risk premium is the extra return investors demand to hold a riskier asset instead of a safer one.
- If a risky asset doesn’t yield more than a safe one, there’s no incentive to take risk.
- Risk premiums explain why stocks outperform bonds, and bonds must outperform cash given enough time.
- Yield curve inversions occur when riskier assets yield less than safer ones, signaling tight policy and higher recession risk.
- Central bank policy can compress risk premiums, especially in bonds, making them expensive relative to cash.
- Risk premiums vary by investor type, market volatility, and economic/market environments.
- Higher volatility raises required risk premiums.
- Risk premiums are a key input to valuations, portfolio construction, and discount rates.
What Are the Various Risk Premiums?
You can observe their relative risk premiums by roughly looking at the differences in their returns over long stretches of time.
For example, since 1974:
Portfolio Assets
| Name | CAGR | Stdev | Best Year | Worst Year | Max Drawdown | Sharpe Ratio | Sortino Ratio |
|---|---|---|---|---|---|---|---|
| US Stock Market | 11.38% | 15.69% | 37.82% | -37.04% | -50.89% | 0.49 | 0.71 |
| 10-year Treasury | 6.41% | 8.12% | 39.57% | -15.19% | -23.18% | 0.26 | 0.41 |
| Long-Term Corporate Bonds | 7.28% | 8.85% | 28.68% | -25.62% | -33.85% | 0.34 | 0.52 |
| Cash | 4.50% | 1.00% | 15.29% | 0.03% | 0.00% | -0.15 | -0.18 |
| Gold | 7.08% | 18.76% | 126.55% | -32.60% | -61.78% | 0.22 | 0.35 |
Let’s look at the relative risk premiums.
Naturally, these are not set in stone and even despite 50+ years of history, they can vary over time.
US Stocks vs Cash: +6.9% annual risk premium
Stocks (11.38%) minus cash (4.50%).
This is the classic equity risk premium for bearing volatility and drawdowns.
US Stocks vs 10-Year Treasuries: +5.0% risk premium
Compensation for higher volatility, deeper drawdowns, and cyclical risk.
US Stocks vs Long-Term Corporate Bonds: +4.1% risk premium
Reflects additional equity risk beyond credit and duration risk.
Long-Term Corporate Bonds vs Treasuries: +0.9% credit risk premium
Extra return for taking default risk and spread volatility.
Treasuries vs Cash: +1.9% duration risk premium
Compensation for interest rate sensitivity versus capital stability.
Gold vs Cash: +2.6% alternative risk premium
Return comes with high volatility and large drawdowns, not income.
Gold vs Treasuries: +0.7% volatility premium
Modest excess return.
Gold vs US Stocks: –4.3% relative return gap
Gold underperformed equities long term.
Overall
These risk premiums are not meant to be taken as guides for the future, as there are various reasons why the past won’t be representative of the future.
For example:
- central bank policy (i.e., bringing bond rates down to cash rates)
- volatility
- mix of investor participants (e.g., does an aging population, who are more inclined to save, bring down risk premiums?)
Central banks are not only keeping cash rates down to aid the economy, but longer-duration bond rates as well. That 250-bp premium we’ve seen historically has shrunk down to 10-70bps in most developed markets.
That makes bonds overvalued relative to cash. But central banks are price-insensitive coming from a public policy mandate and have large control over this process.
Stocks don’t have an advertised yield like cash and bonds. It involves taking the value of the index and dividing by the earnings of the companies within it.
Risk premium based on investor type
Different investors have different implied risk premiums.
For example, retirees and savers are less prone to making risky investments. Therefore, the equity risk premium for them is a lot higher. In other words, they demand more compensation to hold risky investments.
Savers are determined to save, so it’s very hard to get them into more volatile investments.
Younger investors, or those who simply might have more appetite for volatility or generally want or need higher returns, will generally be less risk averse. Their equity risk premium is lower.
Some (pure speculators) have no risk aversion.
Risk premium based on market action
When markets are volatile, risk premiums are higher.
When price risk is more extreme, this causes market participants to be more picky about what they buy.
When markets are more placid, yield becomes the more important factor and risk premiums are lower.
Related concepts
The Sharpe ratio measures excess returns over excess risks.
Example
Say the return on cash is 2 percent annually.
Cash has no real price risk so its volatility is close to zero. Three-month bills, which are typically considered a cash equivalent, have a very small amount of volatility that could be considered zero for all intents and purposes.
Consider that the yield on a 10-year bond is 4 percent annually and assume its volatility is 8 percent.
What’s the Sharpe ratio of the 10-year bond?
We take the excess return of the bond, which is its 4 percent minus the risk-free rate, which in this example is 2 percent. That’s the risk premium of the 10-year bond over cash.
Then we divide by the extra risk, which is the 8 percent minus the zero percent of cash.
Sharpe = (2 – 0) / (8 – 0) = 2/8 = 0.25
The Sharpe ratio is commonly in the vicinity of 0.2 to 0.3 over the long-run.
Any lower and the prospective reward isn’t worth the risk and any higher and more money comes flowing in, bidding up the price and lowering the return relative to the risk.
Now let’s say stocks yield 7 percent and have an annual volatility of about 16 percent.
This represents a 5 percent risk premium relative to cash and 3 percent risk premium relative to the 10-year bond.
So, the Sharpe ratio of stocks relative to cash becomes:
= (7 – 2) / (16 – 0) = 0.31
And the Sharpe ratio of stocks relative to 10-year bonds becomes:
= (7 – 4) / (16 – 8) = 0.375
In this example, stocks are priced particularly well relative to bonds and well (but less so) relative to cash.
Investors and portfolio allocators use a version of this methodology when determining how to construct a portfolio that provides the most yield relative to its risk.
Risk premium as a component of the discount rate
The price of a stock is a function of the present values of future earnings. This involves a discount rate.
The discount rate is a function of a risk-free rate plus the risk premium.
Some investors think that the present value math of stocks is no longer viable because of zero or negative interest rates theoretically gives a notional value of infinity.
But they’re ignoring the influence of the risk premium.
Rates on cash and bonds can be minus-50bps. But investors demand extra return for holding stocks over safe assets.
If the risk premium is still only 300bps, then the implied yield on stocks is 2.5 percent. That gives an earnings multiple of 40x, not infinity.
Market-specific risk premiums
Credit
In the credit market, the risk premium between two different forms of debt is called a credit spread. This is typically between a safe government bond and a type of corporate credit of similar duration.
When credit spreads narrow, that means investors collectively tend to be more bullish the market as they bid riskier forms of credit closer to the risk-free rate.
When credit spreads widen, investors are more bearish on the market, demanding a higher risk premium to hold credit over government bonds.
Equity
As mentioned earlier in the article, the “yield” of equities is unknown. The return of equities is the sum of dividend payments and capital gains.
Some companies pay out some portion of their earnings as dividends if they believe such earnings to be “guaranteed”. The rest is made up of capital gains or movement in the stock price.
Each individual market participant effectively knows – implicitly or explicitly – their own risk premium.
For example, most investors choose to put at least some of their money in stocks because they believe that equities are likely to return more than bonds or cash.
The weighted average mix of all these participants expectations creates the overall equity risk premium.
Cash vs. Stocks vs. Bonds
Risk premiums between asset classes is a component of the major three equilibriums in terms of how the economy and markets are continually interacting with each other.
Stocks must yield more than bonds, and bonds must yield more than cash, and by suitable risk premiums.
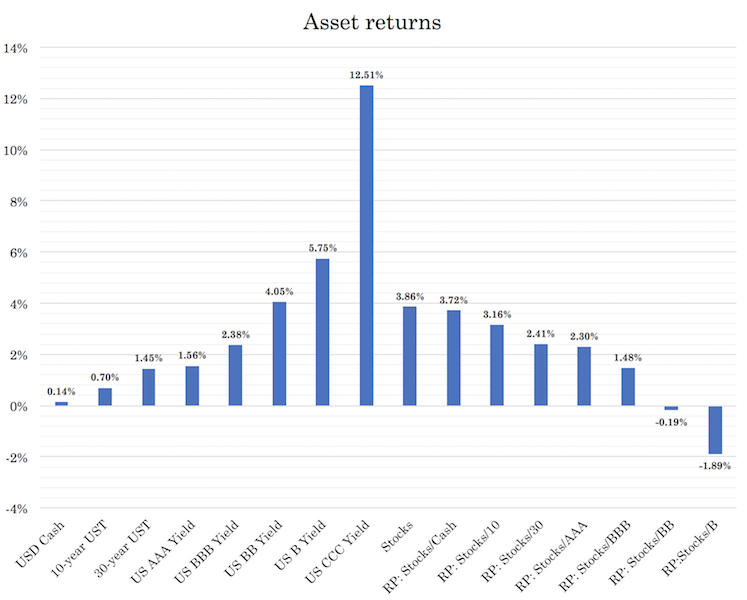
We can also see this if we plot out a representative sample of the forward yields of various asset classes and observe the risk premium concept. There is an upward sloping curve as you go from safe and lower duration assets to riskier and higher duration assets.
The metrics on the right side of the graph show the risk premiums (“RP”) between various asset classes.
Non-financial contexts
Game shows that provide rewards on basic choices offer examples of cases where risk premiums sometimes do and don’t exist.
For example, suppose a contestant has the ability to choose between two doors.
Consider a car worth $10,000 is behind one door and a goat (worth $0) is behind the other. The host also gives the contestant the choice of a taking a $5,000 cash prize.
The expected value of choosing a door is $5,000 with a 50 percent chance of selecting the $10,000 prize and 50 percent chance of getting nothing.
If the contestant is risk averse he will select the $5,000 guarantee to avoid the prospect of ending up with nothing.
This is because there is no incentive to take more risk. The risk-free options provides the same payoff as the riskier bet.
In other words, there is no risk premium.
In cases where expected values are equal in value to the “risk free” option, rationally more players will make the choice that gives them the most benefit with the least risk.
It’s the same concept in the markets where longer duration assets come closer to the cash yield, causing more investors to hoard cash.
However, if we provide a twist on the game above, let’s say the car is worth $20,000. Now the expected value of choosing between the two doors is $10,000 versus just $5,000 for the cash prize guarantee.
Some contestants who are risk averse would still take the guaranteed $5,000, considering they still have a 50 percent chance of coming up with nothing.
But the $10,000 expected value provides a $5,000 risk premium for selecting. This helps incentivize more contestants to continue playing.
Contestants who need a minimum compensation of under $5,000 for taking on the risk will decide to play the game. Those who need more than a $5,000 minimum risk compensation will still take the cash prize.
Risk premium and its tie-in with marginal utility
The risk premium required in some games can be enormous.
For example, consider a person has a choice between a guaranteed cash prize of $1 million versus doing a coin flip to win $100 million (versus $0 if the coin flip is called incorrectly).
Even though the expected value of choosing to play the game $50 million, the guarantee of $1 million would make the prospect of coming away with nothing (50 percent chance) unacceptable. This many might rationally take the guarantee even when provided with a 50x risk premium.
This gets into matters of marginal utility. While $50 million is quite a bit, for many $1 million can set up a high perpetual level of income to meet their basic needs and more.
So even though the expected value of playing the game is 50x higher, it isn’t necessarily 50x better from the perspective of marginal utility.
Risk premiums can also be very high in the financial markets in certain contexts, such as with the securities of pre-bankruptcy companies.
Conclusion
A risk premium represents the extra amount of return required on a risky asset (e.g., credit, stocks) relative to a safer asset, such as a government bond.
This extra compensation is necessary in order to incentivize market participants to hold the risky asset over the risk-free asset.
The risk premium is positive for those who are risk averse, which is most individuals. Namely, people expect to be compensated more for taking on higher risk.
Risk premiums are typically expressed as percentages in the markets, such as what a bond of a certain risk and duration yields over cash, and what a stock or index is expected to yield over bonds or cash.