Covered Call Strategy: Generating Income with Options


A covered call strategy is a type of implementation where a trader will sell a call option while at the same time owning the corresponding amount of the underlying security or instrument.
Fundamentally, options are a form of financial insurance. The volatility risk premium associated with options is compensation paid by option buyers to the option sellers who underwrite this insurance
The covered call can be executed in any market where there’s an options market in the underlying.
This includes most commonly stocks, where options are typically the most liquid. But can also include markets in certain types of bonds, commodities, currencies, and even interest rates and swaps.
Key Takeaways – Covered Call Strategy
- A covered call earns income by selling call options on stocks/assets you already own.
- It captures both equity and volatility risk premiums, reducing portfolio volatility.
- Profits are capped above the strike price, but downside losses are cushioned to some extent by premiums.
- Risk-managed versions like delta-hedging improve Sharpe ratio (by neutralizing equity timing risk).
- CBOE’s BXM and BXY indexes show covered calls outperform during flat or declining markets.
- ATM options maximize volatility premium.
- OTM options allow equity upside.
- Selling more calls than shares owned increases short vol exposure and adds risk.
- The strategy is commonly misunderstood due to its mixed exposures and nonlinear returns.
- Proper strike selection, hedging, and sizing are key to managing trade-offs.
- A covered call strategy typically improves Sharpe ratio over time by reducing volatility through option premium income, even if total returns are slightly capped.
- This, of course, is not true in all environments.
Buy-Write Strategy
When a trader buys the underlying at the same time as selling the call option, this is called a buy-write strategy.
The long position in the security provides the “cover” in the strategy. When a call option goes in-the-money (ITM), the buyer has the option to exercise by taking control of the underlying shares.
When the seller of the option owns the underlying shares, the brokerage will execute a sell order of the shares from their account when the option is exercised.
Since the position is covered, the sell order will simply delete out the shares the option seller already owned.
Moreover, it’s covered in the sense that if a call option goes ITM, if a seller owns the underlying instrument, he will not lose money being short the option. The losses from the option are netted out by owning the underlying shares.
As a result, this is how a call option payoff diagram appears:
Covered call payoff diagram
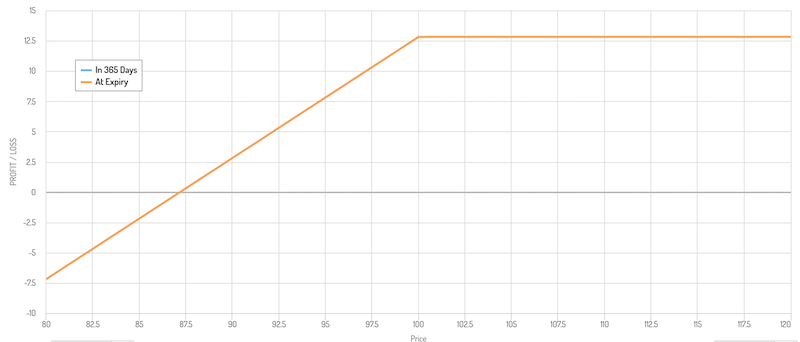
(Source: optioncreator.com)
There is a maximum profitability achieved at or above the strike price.
There’s also a smaller positive profitability zone just below the strike. Since the option seller is compensated for selling the option, the stock can go against them by the size of the premium before the trade nets a loss.
Example
For example, let’s say a trader buy 100 shares of a $50 stock ($5,000 total). And let’s say the premium on the option is $1.00 per share on a $50 strike.
That means the trader can sustain a $1 per share loss on the underlying before he starts to lose money. By expiration, if the stock trades at $49 or above, the trader will make money. If $49 or below, the trader will lose money.
Naturally, this means the stock needs to go up or not lose much for the trader to make money on the trade.
If the stock increases, then more income may have been made had there not been a call option written, depending on the extent of the increase.
On the other hand, if the stock decreases, then the trader won’t lose as much in comparison to if the call option hadn’t been sold at all. And as mentioned, the trader could still make a profit on the trade depending on the extent of the loss.
Covered call and short put are analogous
A covered call is generally the same type of trade as a basic short put position. If the underlying is stable or runs above the strike price, the trader earns the premium. If the instrument falls in price, then the trader is likely to lose money.
Losses can therefore be reduced, but this comes at the trade-off of capping your upside.
Profit/Loss Diagrams
Let’s use some visuals.
1. Performance vs Stock Returns (Line Chart)
- X-axis: Stock return performance (from worst to best)
- Y-axis: Actual returns for both strategies
- Blue line: Stock-only returns (diagonal line)
- Purple line: Covered call returns (flattens out at higher stock returns due to the cap)
Let’s say we have a simple covered call strategy where there’s 1 sold call for every 100 shares of the underlying (i.e., 1:1 coverage of the underlying):
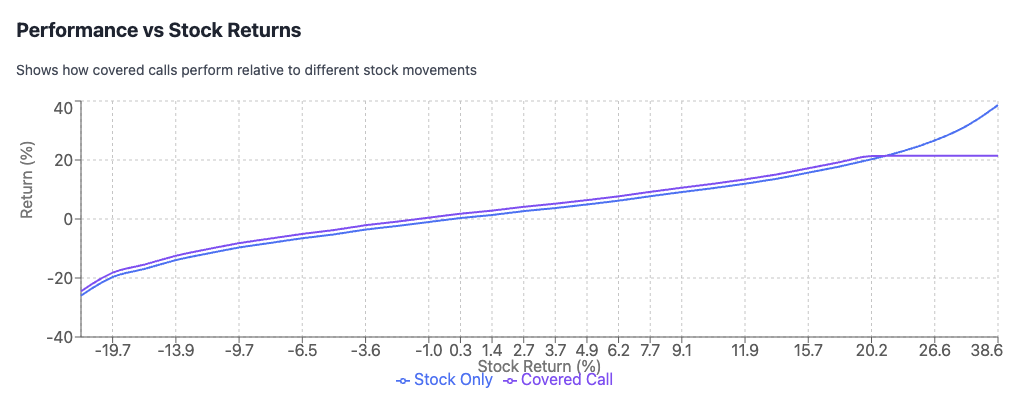
Here it outperforms the majority of the time, but leads to losses when the stock rises a lot.
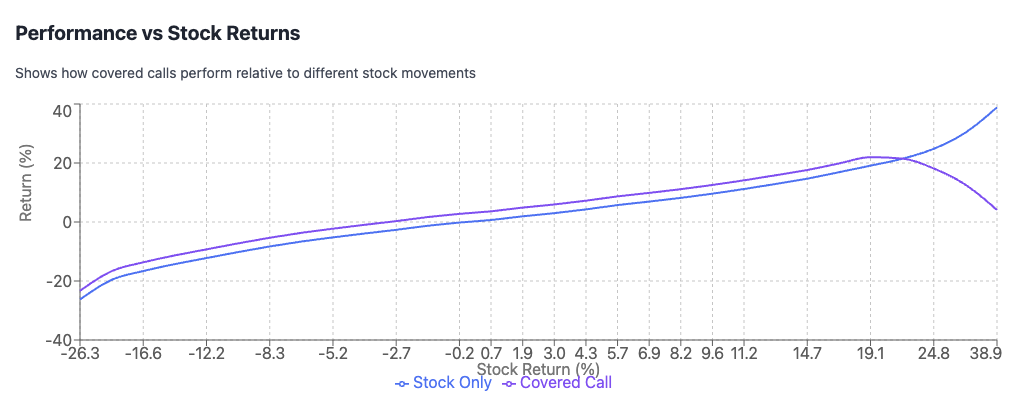
And let’s say we now have a 2:1 (two calls for every 1 unit of the underlying) to get more premium income, but generates losses when the stock outperforms.
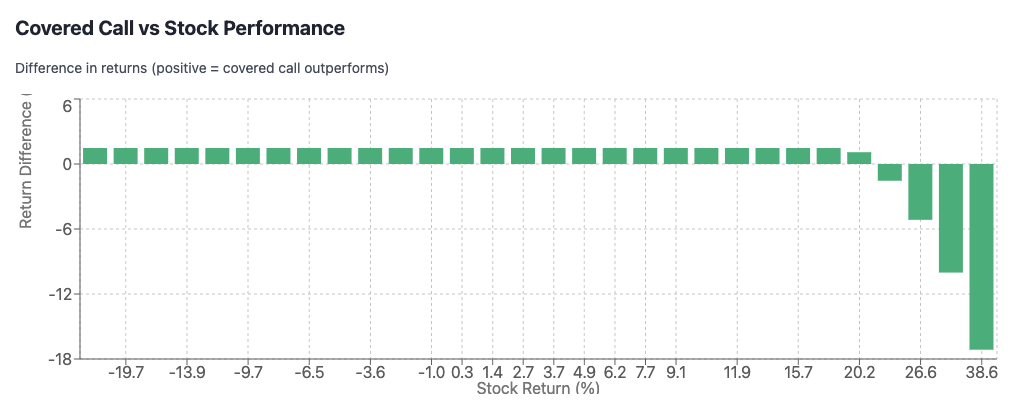
2. Covered Call vs Stock Performance (Bar Chart)
- X-axis: Stock return performance
- Y-axis: Difference between covered call and stock returns
- Green bars: Show when covered calls outperform (positive) or underperform (negative)
From the 1:1 strategy showing differences in relative returns:
From the 2:1 strategy:
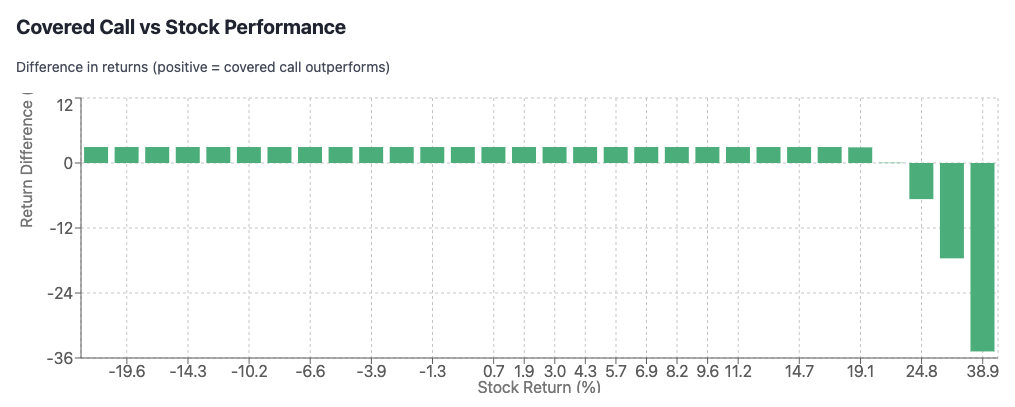
What You’ll See
- When stocks fall significantly: Covered calls perform better (positive green bars) due to the premium income cushioning losses
- When stocks rise moderately: Covered calls still do well, often outperforming
- When stocks rise significantly: Covered calls underperform (negative green bars) because gains are capped at the strike price
This demonstrates the trade-off: you give up unlimited upside potential in exchange for premium income that provides downside protection and reduces volatility, typically improving your Sharpe ratio.
Naked or uncovered calls
A covered call is less dangerous than selling a naked call – i.e., not owning the underlying.
In such a case, if the stock were to go up a lot, the trader would have outsized losses.
To take our example in a preceding section, let’s say a trader sells a call option of an at-the-money (ATM) security – a 50 strike of a $50 security. He gets $1 per share in premium.
Now let’s say the stock goes up to $75, a 50 percent increase.
Given there are 100 shares per each option contract, the trader now has a liability of a $2,500 ($25 loss per share times 100 shares) against a premium of just $100, for a net loss of $2,400. (That’s 24x(!))
If the trader had the position covered, the gains in the shares he would have owned would have offset the loss in the options. Accordingly, he would have netted out a profit equal to the premium ($100).
How covered calls can lose a lot of money
Again following the same example, if the trader owned 100 shares of a stock he bought at $50, sold a 50 strike call at a premium of $1 per share ($100 per contract), his breakeven would be $49 per share by expiration.
If the stock fell to $25 per share his loss would be $2,500 ($25 loss per share times 100 shares) against a premium of just $100, for a net loss of $2,400.
He would also still own the shares since the option was out-of-the-money (OTM) by expiration.
This is why the covered call is essentially the equivalent of being short a put option. If the stock remains stable or rises, you earn the premium. If it falls by a lot, you can lose a lot of money.
This is why being short put options or having on a covered call is considered a trade structure where you can earn a small amount of money consistently, but punctuated by large losses that may exceed the premium you earned.
That’s not to say that the covered call is a bad strategy. Trading is about distributions, probabilities, and expected values and there are pros and cons associated with various strategies and trade structures.
The covered call can be a very good one when the implied volatility is high relative to realized volatility.
The appeal of the covered call
Many traders like the covered call because they provide returns comparable to equities but generally with lower volatility.
This is due to the fact that if the stock declines in price, being short the call option helps to provide an offset. An option seller wants the option to expire worthless as an ideal outcome.
At the same time, the owner of a stock in a covered call either wants it to go above the strike price or near it to maximize the amount of profit that can be gained from the strategy.
The returns of a regular covered call strategy are less than the stock market, but the risk-adjusted returns are superior over time (which we’ll get into more below).
The lower relative returns are more than offset by the lower volatility, giving it a higher Sharpe ratio than a plain equities portfolio.
CBOE Buy-Write Index (BXM) vs. S&P 500
The CBOE created a covered call index that went live in 1993 to track the covered call strategy. It commonly goes by the ticker BXM.
BXM involves a basic covered call strategy, selling one-month at-the-money (ATM) call options on option expiration dates.
If we do a comparison of BXM versus SPY (the S&P 500 ETF) since 1993 (both went live in January 1993), we see a slight underperformance of BXM over time.
BXM vs. SPY
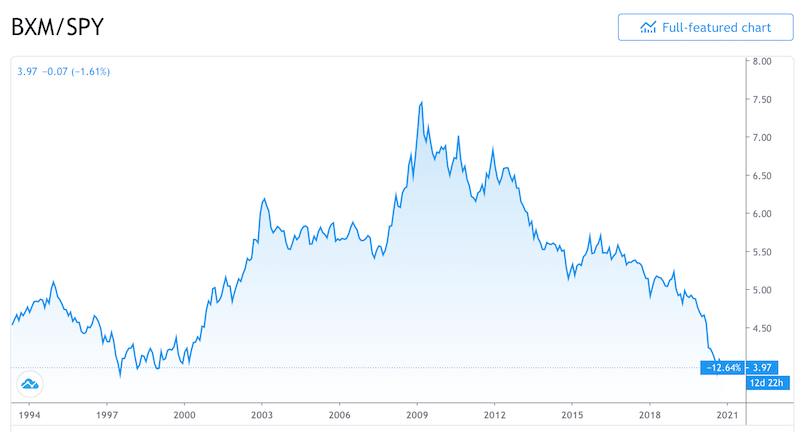
(Source: Trading View)
We see strong outperformance during the dot-com bust and the same during the 2008 financial crisis.
Its performance over this timeframe peaked when the stock market bottomed in 2009.
Since then, a plain stocks strategy has outperformed in absolute terms.
The CBOE also has another, but less popular, covered call index under the ticker BXY.
The CBOE S&P 500 2% OTM BuyWrite Index (BXY), sells one-month two percent out-of-the-money (OTM) call options on option expiration dates.
BXY vs. SPY
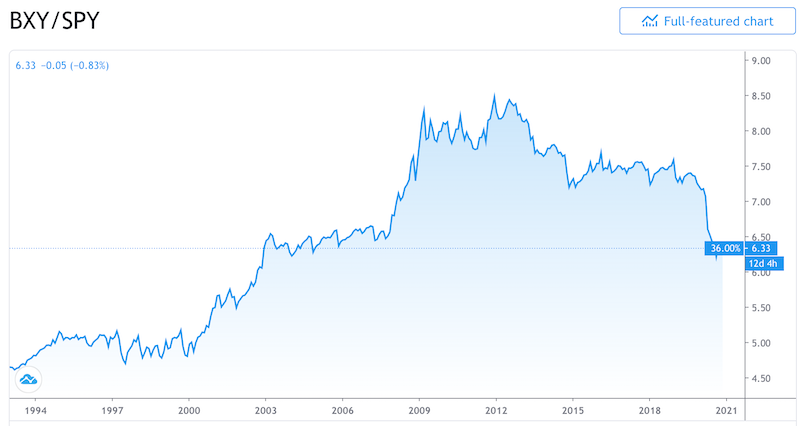
(Source: Trading View)
While ATM covered call strategies contain the volatility risk premium only (because there’s no room to obtain gains from the stock moving higher), the BXY index looks at a strategy that has both the equity risk premium and volatility risk premium in some quantity.
As we can see, given BXY’s inclusion of the equity risk premium, it has done well, outperforming the S&P 500 and BXM (the pure volatility risk premium covered call strategy).
When the covered call strategy works best
We know that the covered call strategy works best in more of a sideways market and especially when volatility doesn’t transpire relative to expectations (i.e., implied volatility is less than realized volatility).
It will outperform by a bit in down markets and underperform in up markets (especially strong bull markets).
Covered calls give you access to two forms of risk premiums
Some traders use covered calls heavily because it gives them access to two forms of risk premiums:
i) equity risk premium
ii) volatility risk premium
The equity risk premium comes from owning a stock.
When people invest in equities they put up a lump sum with the expectation of getting a stream of income in return.
Stocks are liquid and pay higher than cash and bonds over the long-term.
The volatility risk premium is the compensation provided to an option seller. It is like insurance, where the seller essentially absorbs and manages somebody else’s risk for them.
It can also fit into the category known as a liquid alternative or ‘liquid alt’, a type of alternative risk premium that generates an uncorrelated return stream (full article).
The owner of an option pays the option seller for taking on the risk of having to deliver a security or instrument to the owner of the option in the future at an agreed upon price.
The buyer of the call option has capped downside but unlimited upside.
The seller of the call options ideally hedges against that uncapped risk by either delta hedging it or covering the position completely by being long the underlying.
Not doing so is to be “uncovered” or have “naked” exposure. Selling volatility in this way can be dangerous.
Being covered against the risk of having to deliver the shares limits the upside losses should the call option land ITM.
This gives you the dual exposures of being long the equity risk premium and being short volatility, which provides a different type of risk premium. Said differently, you are both long the underlying security while adding a volatility risk exposure in addition.
The volatility risk premium is positive over time. In other words, options are inherently priced a bit higher than they should be. This incentivizes options sellers to enter into the contract in the first place.
Just as a private insurance business works because they price risk in a way such that the pool of buyers of the premiums pay too much collectively, giving the policy sellers a margin (i.e., net profit).
The chart below of Apple (AAPL) options gives an example of the margin inherent in options for the seller.
The distributions above zero show times when implied volatility was higher than realized volatility (i.e., good for an option’s seller and bad for an option’s buyer). The distributions below zero show cases when implied volatility was lower than realized volatility (i.e., bad for the seller, good for the buyer).
The red line represents the option seller’s profit margin. It is thin and comes with plenty of movement. (Many private insurance businesses have long-run margins below 10 percent.)
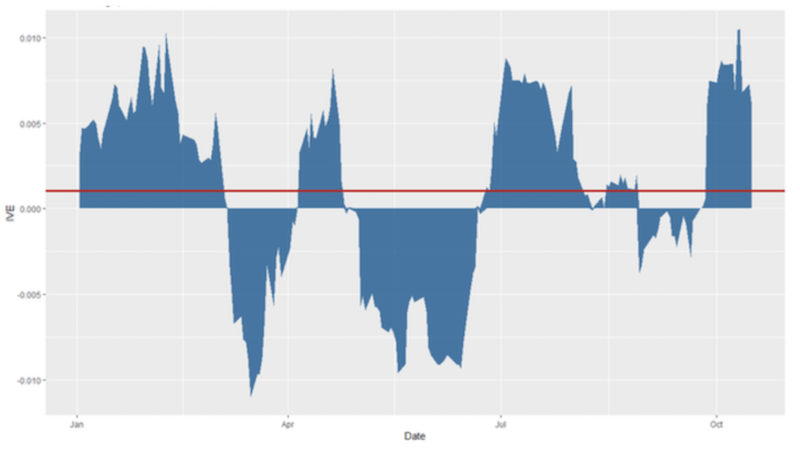
This is because the implied volatility backed out from the options pricing is more than the expected volatility (future realized volatility) of the underlying security or instrument.
This generally has to be true in order to have a market for options in the first place. The seller of the option needs to have an incentive to take on the risk.
This spread between implied volatility and realized volatility is called the volatility risk premium.
This volatility risk premium is the backbone of many strategies. We covered more about the strategy in a separate article.
The common aversion to covered call strategies
A covered call strategy is perhaps the most accessible source of the volatility risk premium for most investors.
However, it is largely absent from most investors’ portfolios despite its potential return-enhancing and risk-reducing properties.
The equity risk premium is the most dominant source of returns for most investors, putting most of their portfolios in equities, especially those from their domestic markets. This also makes generating market-beating returns more difficult.
In other words, the equity market (i.e., stock picking) is one of the hardest ways to generate alpha.
By providing both equity and volatility risk premiums, covered calls returns have been attractive historically, almost matching the returns of the underlying indices but with lower volatility.
Still, many traders and investors remain skeptical of the covered call strategy and other options strategies.
Even though the covered call strategy is basic enough to be used by nearly every trader, it’s still not well understood.
The securities or instruments chosen and the strike and maturities of the call options to be sold should be selected to achieve an allocation to the equity and volatility risk premiums without taking undue risks.
The uncertainty of the strategy’s risk exposures may be one source of confusion.
It’s straightforward to backtest an equity portfolio back through time to assess risk and return exposures. Or a mix of stocks, bonds, gold, and so on.
It’s less clear how to backtest a covered call strategy. The CBOE Buy-Write Index provides insight, but it’s very general.
Many investors do not have a general framework by which to assess the impact of underlying security selection, strike, maturity, leverage, and risk management on future outcomes and how to approach portfolio construction.
For instance, if an investor sells at-the-money (ATM) options, this provides the highest exposure to the volatility risk premium.
If the underlying is $50 and the strike is 50, there is virtually no exposure to the equity risk premium and the strategy is essentially trying to purely extract the volatility risk premium.
A trade where the underlying is $50 and the strike is 55 with a maturity one month out is somewhere in the middle. For a highly volatile security, most of the trade would still be in the volatility risk premium; for an instrument that has little volatility, most of the trade would be in the equity risk premium.
Lower-strike options may have better risk-adjusted performance than high-strike options due to the higher demand for portfolio protection.
Namely, a trader may be more inclined to go shift some long equity exposure into buying put ATM options to get rid of the left-tail risk associated with owning a stock and its linear exposure.
We see this phenomenon in the form of the ‘volatility smile‘ (a type of volatility skew) where implied volatilities are higher at lower strikes than higher strikes.
For example, when looking at the implied volatilities across a range of different strike prices for Apple (AAPL), we can see higher demand for lower-strike options than the higher-strike variants. We also see this across multiple maturities.
Apple (AAPL) Volatility Skew
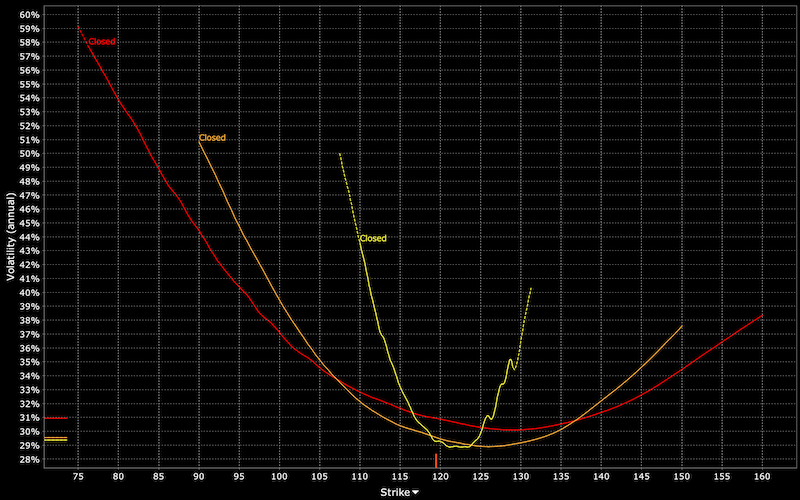
(Source: Interactive Brokers ‘Implied Volatility Viewer’ tool)
Options and market timing
Market timing is one of those things that’s very difficult to do.
Market participants that are involved heavily in options markets, such as market makers, are well aware of the market timing element, which is a type of active equity exposure.
Market makers often use a delta hedging program that’s specifically designed to reduce the risk associated with this dynamic exposure.
The covered call benchmark (CBOE S&P 500 Buy-Write Index, BXM) and most traders running covered call books nonetheless do not hedge the time-varying equity exposure associated with option convexity.
There are various complications that come with doing so. There are trading costs involved in dynamic hedging. There’s also the element of timing.
In addition the risk and return contribution of unhedged short option equity exposure is generally not reported by those who use covered call strategies.
It’s also difficult to measure because of the eccentric shape of the returns distribution. Shorting options is a type of strategy that tends to make a little bit of money frequently only to see occasional big losses.
In one study (Israelov and Nielsen, 2015), they found market timing to be responsible for roughly 25 percent of the risk of an ATM covered call’s risk.
Because of options’ time decay properties, timing risk is largest just prior to expiration. On the day before a call option expires, the equity timing element provides about as much risk as the passive equity exposure.
Delta hedging covered calls
The covered call’s active equity exposure can be understood by looking at the delta of the strategy’s call option.
The covered call’s equity exposure can remain constant by trading an offsetting amount of the underlying security. For example, if a short call option’s delta is 0.6, then 60 shares of the underlying can be purchased to offset the delta.
Many brokers will show the delta of an option when selecting it within the option’s chain.
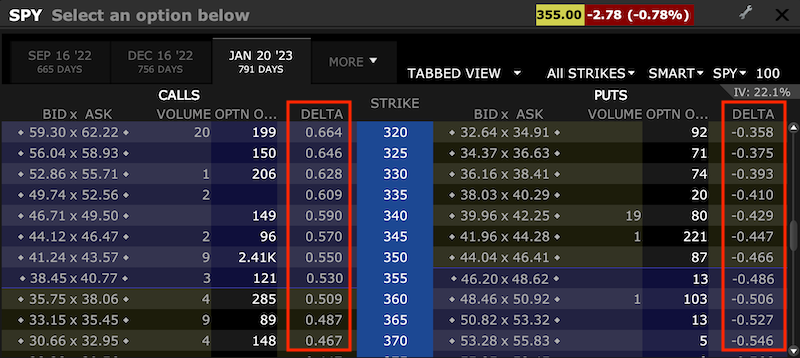
(Source: Interactive Brokers)
This type of risk management practice is a lot like the delta-hedging approach used by volatility trading desks.
Using this risk management practice, the covered call achieves higher risk-adjusted returns relative to the traditional covered call because it collects the same amount of equity and volatility risk premium. At the same time, it is no longer exposed to the risk of equity market timing.
In the previously cited study, the delta-hedged covered call strategy increased its Sharpe ratio to 0.52 from 0.37 while reducing its annualized volatility to 9.2 percent from 11.4 percent.
Delta hedging covered call exposure also has the advantage beyond better risk-adjusted returns – its design, goal, and execution are clear.
Delta hedged covered calls are long equity and short volatility in some proportion to each that is up to the trader. Ideally, the trader will then measure their resulting contributions to the performance of the strategy.
The main drawback to the strategy involves the heightened trading costs in addition to the people- and/or technologically-intensive necessity of delta hedging options on a regular basis. (Most big traders do it algorithmically using programs that help them accomplish this.)
Return composition of basic covered calls
Israelov and Nielsen (2015) analyzed the risk and return contribution of the main parts of the basic ATM covered call strategy running from March 1996 to December 2014.
The results are shown in the table below:
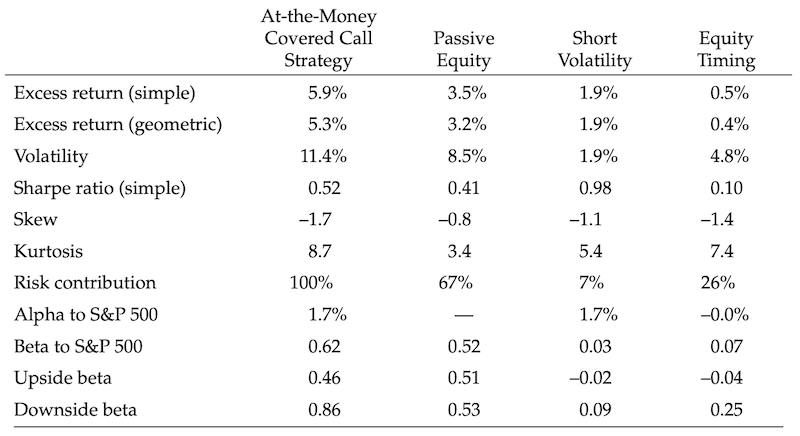
(Note: The backtest is long the S&P 500 and short ATM front-month S&P 500 call options, held to expiry. Risk contribution is defined as the covariance of the component with the full strategy, divided by the variance of the full strategy. Volatility, skew, kurtosis, alpha, beta, upside beta, and downside beta were computed using 21-day overlapping returns.
Sources: AQR, OptionMetrics, Chicago Board Options Exchange, and Standard & Poor’s.)
A few interesting things stick out.
The short volatility part of the portfolio had a Sharpe ratio of about 1 yet was just 7 percent of the risk contribution.
The passive equity portion had a Sharpe ratio of 0.41 and was 67 percent of the risk contribution.
The equity timing element – i.e., as a buy-write strategy, it involves buying the stock and selling the call option at the same time – had a Sharpe ratio of just 0.10 and contributed 26 percent of the risk.
Equity timing realized moderately positive returns over our sample period. But the 0.5 annualized return isn’t statistically significant, given its 4.8 percent annualized volatility (i.e., provides a t-statistic of 0.4).
The extra alpha that’s derived from the strategy is in the short volatility component.
This makes sense because simply buying the index by definition adds no alpha. You are simply being the market. Owning the market is by definition beta returns.
Equity timing is also not an alpha generator, which makes sense. Alpha is a zero-sum game. If you’re deviating from an index, if you win that means somebody else is losing and vice versa.
The alpha generation is therefore in selling volatility.
The short volatility return stream also has a very low correlation to the market with a beta of close to zero.
The passive equity exposure realized 8.5 percent annualized volatility. Short volatility realized a modest 2 percent annualized volatility.
Passive equity and short volatility had a correlation of +0.26. This is due to the negative relationship between equity returns and changes in implied volatility.
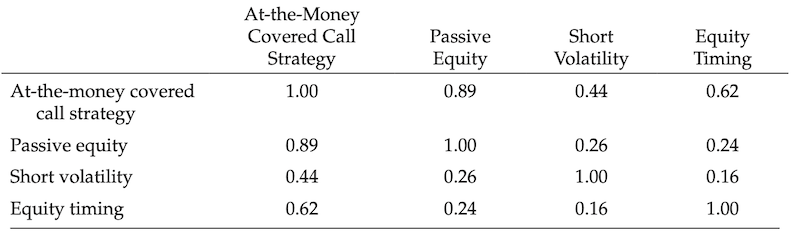
Namely, when equity returns are negative, it usually means implied volatility is increasing. Therefore, shorting volatility would imply a positive relationship with being long equity.
Equity timing was a material source of risk, realizing more than half the volatility of the passive equity exposure. It also contributed almost four times the risk of short volatility.
Short volatility provided about two-thirds of the return of long equity but with only one quarter of its risk. The short volatility component provided one-third of the covered call’s average return. This is despite the fact it’s responsible for only less than 10 percent of its risk.
Figelman (2008) did a study looking at the returns of the covered call strategy from March 1994 through September 2005.
He found that the equity and volatility risk premiums each contributed 2.9 percent to the ATM covered call’s annual expected return.
The Israelov and Nielsen study (March 1996 through December 2014) showed a somewhat higher equity risk premium and a lower volatility risk premium.
Same exercise using the CBOE S&P 500 2% OTM Buy-Write Index
They repeated the exercise for a strategy that mimicks the CBOE S&P 500 2% OTM Buy-Write Index. On rebalance dates, the strategy’s average portfolio delta is 0.70.
The same charts are reproduced as in the first exercise.
2 Percent Out-of-the-Money Overwriting Sample: Return Decomposition (Annualized)

(Notes and Source: Same as in preceding section, but the backtest is long the S&P 500 and short 2 percent OTM front-month S&P 500 call options, held to expiry.)
As a natural reality, the OTM covered call strategy has higher passive equity exposure and therefore collects a larger equity risk premium than its ATM counterpart.
Likewise, OTM options have lower short volatility exposure than ATM options.
OTM options have lower short volatility exposure than do ATM options.
OTM options have lower convexity (gamma), and they have lower exposure to changes in the options implied volatilities (vega).
Under such a strategy, you do not see a significant impact on the risk or return of the short volatility exposure.
This means that the 2 percent OTM delta-hedged call option is not materially different from an ATM delta-hedged call option.
You might also notice this should you try covered call strategies in your own trading.
For example, let’s say you’re doing a buy-write of a stock trading at $98 per share. If you’re going to sell an option that’s as close to ATM as possible, which expiry do you sell?
Some stocks don’t have options strikes at each $1 or $2.50 increments. In such a case, your choice is probably between the 95 and 100 strikes.
The 95 strike would be ITM.
If you do an ITM option, the drawback is that you won’t capture much volatility risk premium. Once ITM, an option acts quite similarly to the underlying instrument. It does limit your risk, given you’re ITM, but the return is constrained.
So you’d naturally likely do the 100 strike. It’s about 2 percent OTM. But it’s not that much different than the stock trading at $100 and choosing the 100 strike.
If 2 percent OTM, you have a bit of exposure to the equity risk premium and less to the volatility risk premium. If ATM, you have no exposure to the equity risk premium and all of the trade in the higher amount of volatility risk premium.
But it’s not a material difference either way.
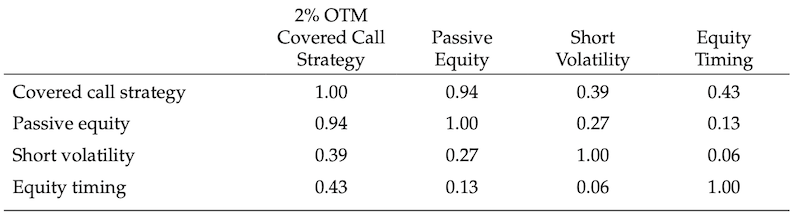
Correlations
2 percent OTM Overwriting Sample: Correlation Matrix
Robustness over time
To check whether the results were robust over time, three sub-periods were tracked within the sample of similar lengths: 1996 to 2001, 2002 to 2008, and 2009 to 2014.
In all of these periods, the short volatility component had a higher Sharpe ratio than the passive equity component.
It was also responsible for less than 10 percent of the covered call strategy’s risk. Risk contributions were similar in the three sub-periods.
The Sharpe ratio was 1.49 and 1.39 in the first and last sub-periods. It was just 0.40 in the middle sub-period running from 2002 to 2008. 2002 caught the tail-end of one bear market, while 2008 is a historically well-noted bear market.
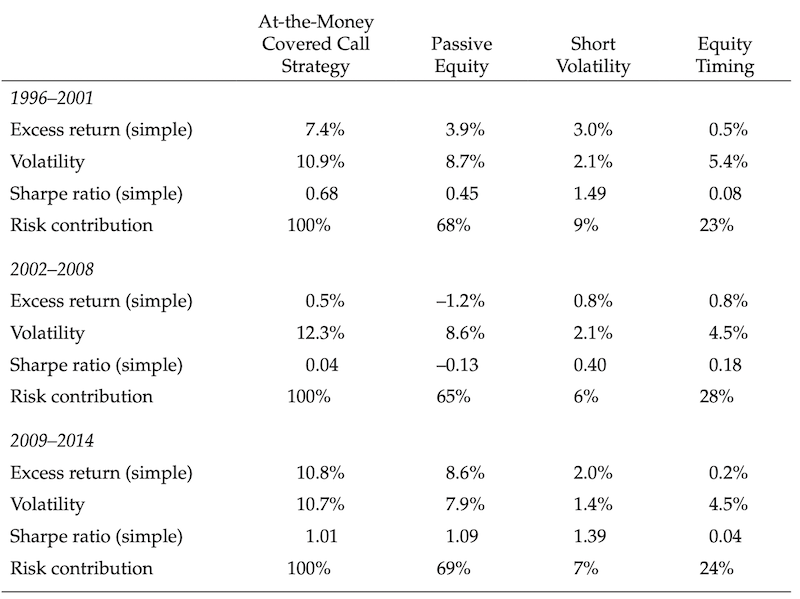
(Notes: Table shows summary statistics for the decomposition of an ATM covered call strategy following the methodology of the BXM over three sub-periods: March 25, 1996 to December, 31 2001; January 1 2002 to December 31, 2008; and January 1 2009 to December 31, 2014. The backtest is long the S&P 500 and short ATM front-month S&P 500 call options, held to expiry. The returns are decomposed into three parts: passive S&P 500 equity exposure, dynamic S&P 500 equity timing exposure from the call option’s time-varying delta, and short volatility exposure.)
The two examples of each buy-write strategy (ATM and 2 percent OTM) enable one to determine the effect of how portfolio construction impacts risk exposures and realized returns.
One choice of option strike influences the level of exposure to passive equity, active equity, and short volatility.
Other factors also affect exposures, for example:
– option maturity
– option strike
– the amount of the portfolio that’s overwritten
If a trader overwrites their entire portfolio, they will have more exposure to short volatility than otherwise.
Some may choose to overwrite only a portion of their portfolio. In such a case, they’ll have more exposure to the equity risk premium.
Some traders may even choose to overwrite more than their entire portfolio. In other words, they’ll increase their short volatility exposure to the point where they’ll be net short the underlying should the option go ITM.
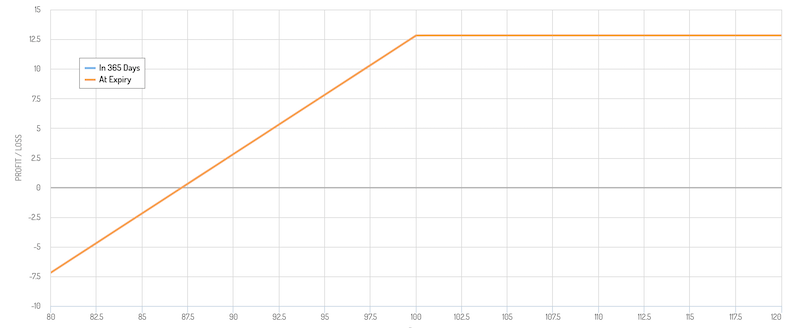
In terms of a payoff diagram, if they were long 1,000 shares of a stock and sold 10 call options, they would have a standard call.
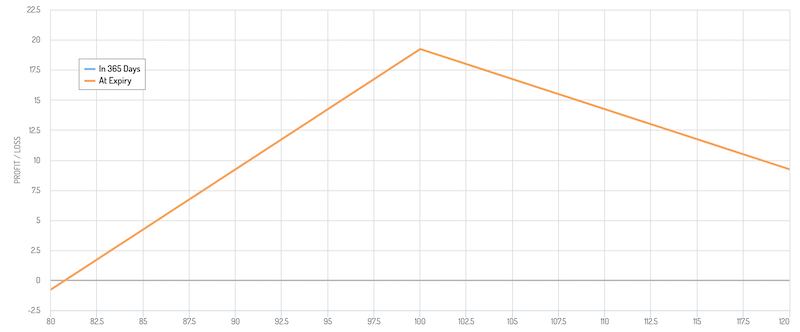
If they were long 1,000 shares of a stock and sold 15 call options, they would have this type of payoff diagram.
If they were long 1,000 shares of a stock and sold 20 call options, they would actually have a trade on that’s essentially a straddle.
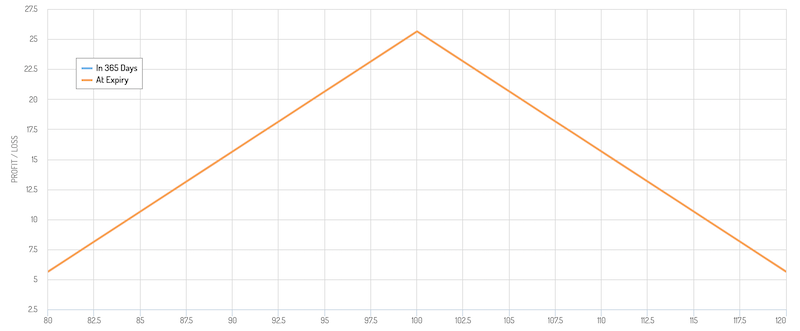
A straddle is the equivalent of selling one ATM put and one ATM call, which would profit so long as the movement in the underlying doesn’t go far enough in one direction such that it exceeds the premium they receive from the options.
The overweighting strategy helps mitigate losses if the stock falls. It also provides more exposure to the volatility risk premium, an appealing source of risk-adjusted returns in a portfolio.
However, it comes at the trade-off of potentially losing money if the stock does well.
For example, let’s say a trader goes long 100 shares of a $100 stock and shorts two call options contracts with a strike price of 100 and premium of $2.00 per share ($4 per share multiplied by two contracts by 100 shares per contract, or $400).
That means this trader has a maximum profit at $100 per share and would actually start losing money if the share price went over $104. In a normal covered call strategy, the trader wouldn’t care how much the stock rose because the position was covered and he’d get the $2 per share premium either way.
In this case, he wouldn’t want the share price to rise too much. As soon as the price goes above $100 he begin losing money since one half of the options contracts are uncovered.
The positive trade-off, however, is that he still makes money if the stock trades within the $96 to $104 range. He loses money if it trades above $104 and loses money if it trades below $96.
Another way a trader could do it is by having a standard covered call structure, and also shorting an OTM call option.
For example, a trader could go long 100 shares of a $100 stock and short one call option contract with a strike price of 100 and short another call option contract at a strike price of 105.
This would give a flat maximum profitability zone between $100 and $105 per share, before the trader would have less profit above $105 and could lose money depending on how far the shares rise above $105. This is essentially a strangle options strategy.
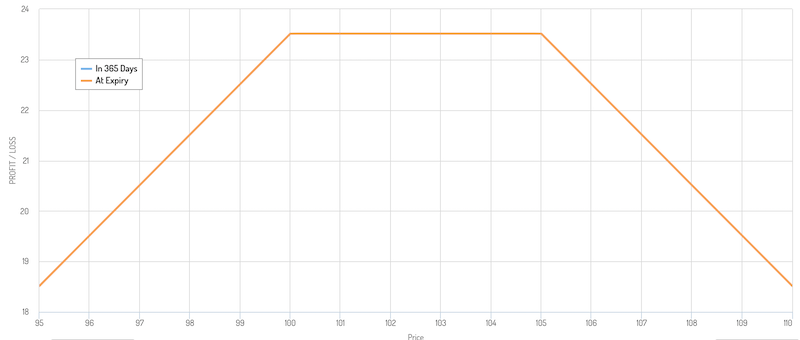
This would provide more downside protection than a standard covered call and wouldn’t lose money as quickly as the straddle structure (mentioned above) if the stock went above the call options’ strike price.
This strangle type of trade structure is essentially the same as selling a 100 put and 105 call in equilibrium.
If delta hedging (i.e., risk-managed covered calls)
If a trader is delta hedging, option risk-adjusted performance may depend on the option’s strike and maturity.
Based on this covered call performance attribution, it’s clear that active equity exposure is a material source of risk.
Analyzing the relationship between the covered call’s equity exposure and the S&P 500’s index level provides insight as to why this is.
The covered call’s equity exposure is known ex ante (i.e., beforehand). So, equity exposure can be easily hedged with instruments like ETFs and futures.
Therefore, any trader wanting to pursue a risk-managed covered call strategy for purposes of improving risk-adjusted returns might want to hedge away the undesirable active equity exposure.
After doing this, the resulting risk-managed covered call portfolio is essentially a position (or positions) of long equity and short volatility portfolio. Accordingly, their risk and return characteristics arise from the combination of these two exposures.
The proposed strategy is straightforward. Each day begins with an existing covered call allocation.
Every day, the portfolio’s equity exposure is calculated according to an options model – e.g., the Black–Scholes model is common.
The active equity exposure is hedged using S&P 500 futures. For example, let’s say the delta of a call option according to the Black–Scholes model is 0.20. Because the expected delta of the strategy’s call options on rebalance dates is 0.5 (the delta of an ATM option), one would hedge the strategy with a short futures position sized at 30 percent of net asset value (0.5 minus 0.2 as a percent). This exercise would be repeated each day.
The table below reports performance statistics for BXM (CBOE Buy-Write Index – i.e., ATM covered calls) and BXY (CBOE two percent Buy-Write Index – i.e., two percent OTM covered calls) and for the two indexes after using the delta hedging risk management process for both BXM and BXY.
Hedging the active equity exposure of the covered call strategies was successful in reducing the strategies’ volatilities.
Hedging reduced BXM’s volatility to 9.2 percent from 11.4 percent. The lower risk increased its Sharpe ratio to 0.52 from 0.37. Similarly, hedging reduced BXY’s volatility to 12.4 percent from 13.3 percent. This increased its Sharpe ratio to 0.46 from 0.41.
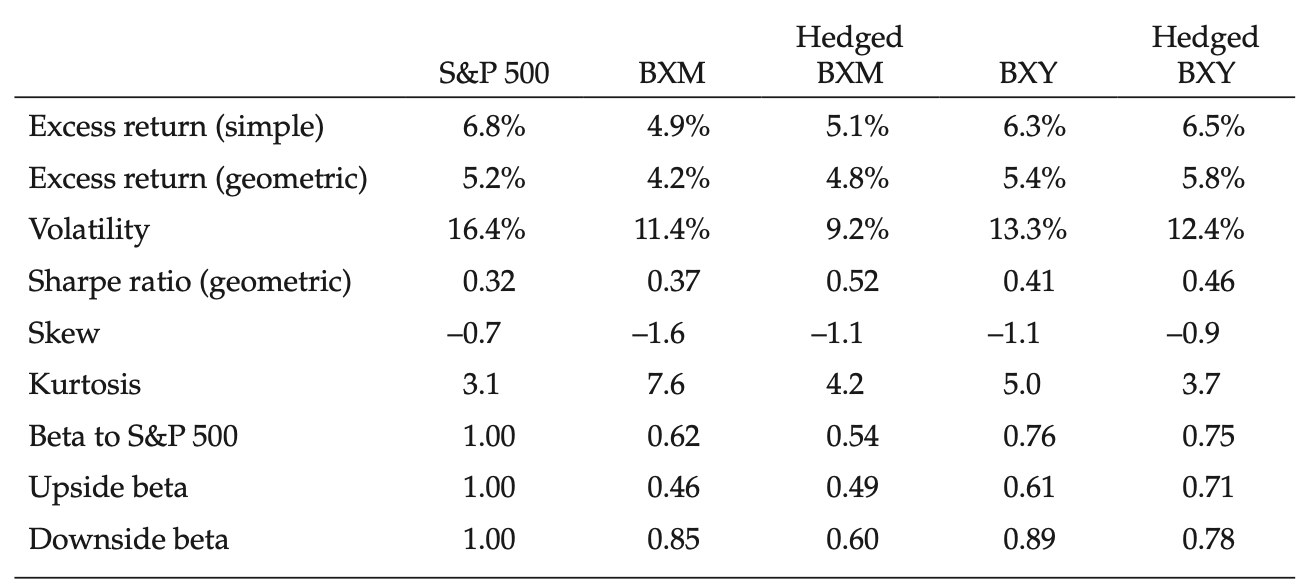
(Notes: The “BXM” column refers to the actual returns of the CBOE S&P 500 BuyWrite Index. The “BXY” column refers to the actual returns of the CBOE S&P 500 2% OTM BuyWrite Index. To compute the “Hedged” series for the BXM and BXY, we first simulate covered call backtests mimicking the methodologies of the indexes. Each day, we compute the equity exposure of the call option according to the Black–Scholes model. We then hedge the “active equity exposure” using S&P 500 futures, where active equity exposure is defined as the difference between the call’s delta and the expected delta of the selected call options on option rebalance dates (defined as 0.5 for the at-the-money backtest and 0.3 for the 2% out-of-the-money backtest). The “Hedged BXM” column refers to the sum of the actual BXM returns and the time series of index future hedge returns for our simulated BXM backtest. The “Hedged BXY” column refers to the sum of the actual BXY returns and the time series of index future hedge returns for our simulated BXY backtest. Returns are in excess of US three-month LIBOR.)
The betas of the buy-write indexes are unique because of their active equity reversal exposure. In other words, as the S&P 500 decreases in value, their exposures to the index increase.
This is because the value of the call goes down (good for a call option seller) when the stock gets further away from the strike price.
The further away from the strike price the index is, the more exposure the strategy will have to equity.
Naturally, because a covered call strategy sells a call option, it is receiving the volatility risk premium in exchange for capping its upside.
That means buy-write indexes have more exposure to a stock’s (or index’s) loss than they do to their gains.
For instance, the BXM has a downside beta of 0.85 (less than 1.00 because the call option revenue can absorb some losses), but an upside beta of just 0.46.
The delta hedging risk management process can bring these two exposures closer to parity. In the hedged BXM strategy, the result is a downside beta of 0.60 and an upside beta of 0.49.
The remaining asymmetry in the beta is due to the short volatility exposure.
To get the upside beta higher than the downside beta, a trader could take other measures that would add to the complexity of a portfolio but help improve return per each unit of risk.
For example, using risk parity elements in the portfolio could help. Namely, instead of just having long equity covered calls, a trader could add in gold, bond futures, commodity futures and other assets that help diversify a portfolio.
We outlined the general balancing process here.
Another easy way to diversify a portfolio is to be both long and short. For instance, a trader could be long an equity index buy-write strategy (i.e., covered calls) and do covered puts on a different part of the portfolio.
But this is starting to branch into a different topic.
The hedged covered call will necessarily have higher trading costs than the unhedged covered call. This is a drawback for the regular trader.
Even in cases where commissions costs are zero or near-zero, there are other trade-offs, such as order execution. Some brokers may offer free trading, but monetize through payment for order flow (popularized by Robinhood).
Nonetheless, these examples are intended to show how performance attribution can help identify a risk that may be hedged out of a portfolio, and that hedging such risk can successfully reduce the volatility of the strategies involved.
In short, isolating the different types of exposures (i.e., active equity, passive equity, short volatility) may help portfolio managers assess and improve the design of their covered call strategies.
Other tidbits
Does pursuing a covered call strategy on more volatile stocks/instruments or shorter-duration maturities provide better return?
One widely held belief is that having a bias for selling options that are closer to ATM, are shorter duration (i.e., premium received per unit of time), and on more volatile instruments can help provide more income.
This is because if you take those characteristics they have higher relative premiums in comparison to options that are OTM, longer duration, and on less volatile instruments.
However, everything is relative. Prices are what they are because they reflect the consensus of all that is known.
Going back to the insurance example, if you are selling car insurance to a 30-year-old driver with a long accident and infraction history driving a $75,000 car you are going to want charge a higher premium relative to a 50-year-old driver with a clean history on those fronts and a $5,000 car.
There is simply less overall measurable risk involved in the latter case than the former. The prices of their premiums will reflect this.
Option sellers need to be compensated for taking on this higher risk because the liability is associated with greater potential loss. The cost of two liabilities are often very different in nature.
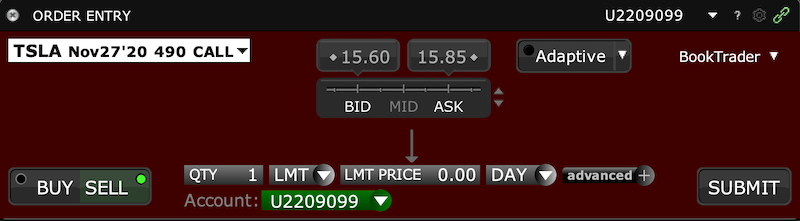
For example, take the two examples:
- a very volatile stock like Tesla (TSLA) selling an ATM call with a 5-day expiry (note: “days to expiration” is often abbreviated DTE), and
- selling at ATM call on mid-duration Treasury inflation protected securities (TIPS) out over two years
TSLA
TIPS
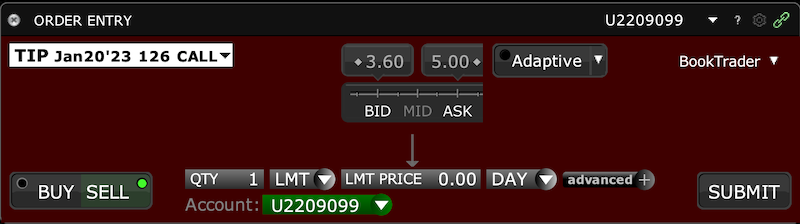
The Tesla call premium has more than 3x the value as an ATM call on the lower volatility TIPS despite very different maturities.
Such is the case involving speculative equity versus safe government bonds of moderate duration.
Some traders prefer to sell shorter dated calls (or shorter dated options more generally) because the annualized premium is higher. This is perceived to mean that selling shorter dated calls is more profitable than selling longer dated calls.
However, this is not necessarily the case.
What’s the implication of the high Sharpe ratio of short volatility relative to the other components (equity and market timing)?
It could mean you want more of the volatility risk premium exposure. And in a safe way, of course.
One way to do this could be to actually sell ITM call options covered by stock.
That would mean you could actually suffer a little bit of a loss on the stock before you start losing money on the trade overall.
The trade-off, however, is that once an option goes ITM, it begins acting a lot like the underlying. At a point, an option acts basically the same as the underlying The volatility premium shrinks accordingly. You are also effectively neutral the equity risk premium.
You have no chance of obtaining the equity risk premium in such a trade structure like a buy-write of ITM calls. The only thing it can do is go against you if the option goes from ITM to OTM due to a drop in the stock price.
But if you are looking to do a buy-write strategy – i.e., sell a call option and buying the underlying – and you’re between expiries, it could be a possibility.
For example, let’s say there’s a stock that’s trading at $103 and you have a choice between 100 calls or 105 calls.
If you want to be long the equity premium to an extent, you would choose the 105 strike under this dichotomy.
If you wanted to be neutral to the equity risk premium, you would choose the 100 calls, also knowing that your upside on the volatility risk premium is limited as well, being an option begins to mimic the underlying security when ITM.
Final Thoughts
Many traders and portfolio managers look to hedge their portfolios risks by purchasing stock or index options or by using them as a fixed-risk instrument to make bullish or bearish wagers.
Because of this, options tend to include a risk premium as a form of compensation to option sellers. This is the same type of model as insurance. If insurance firms perfectly priced risk, they would have no profit.
So, the price risk in a way such that they have some margin. Options markets work in the same way as a form of financial risk insurance.
Covered calls, which are long equity and short call options, collect this volatility risk premium as well as the equity risk premium earned from their long equity exposure.
Because of option convexity, covered calls also include active equity exposure that behaves like a reversal strategy. Namely, when the stock(s) or index(es) in the portfolio decline in value, the call option helps offset some of that loss.
Covered calls are still a strategy that’s not well understood in the trading world because it’s difficult for many traders to understand the risk exposures they’re bearing when they put on the strategy.
Namely, when a covered call is put on, you can decompose the strategy’s return into its passive activity, active equity, and short volatility exposures.
The strategy’s alpha is derived heavily from the short volatility exposure.
Active equity on net provides no alpha because that’s a zero-sum game. When you deviate from an index, if you win somebody else is losing and vice versa.
Passive equity is pure beta, by definition.
Most of the covered call’s risk is in the equity exposure as well (the adverse moves in the equity).
A strategy that has different risk and return components is naturally more nebulous to the public.
But if traders can breakdown exactly what types of risks and return components they have and understand things like how a call option’s strike and maturity influence risk and return, they may help understand exactly what they’re doing and improve their strategies.
For example, a trader pursuing a covered call strategy with ATM options will know he has no passive equity exposure. The covered call strategy caps out how much can be gained from the equity. If the options are ATM, there is no room left to obtain gains from the stock exposure.
If a trader is pursuing a covered call strategy with OTM options, he will have some passive equity exposure, given there is still some room left.
Delta hedging is a way to hedge away the uncompensated active equity exposure. It’s a material contributor to the covered call’s risk.
The delta hedging covered call strategy covered in this article has similar returns to the basic covered call strategy but has lower risk, a reduced downside beta, and better risk-adjusted returns through a higher Sharpe ratio.
The motivation to delta hedge a covered call strategy is to help earn both the equity and volatility risk premium with long equity and short volatility exposure.
It is ultimately up to the trader to determine which amount of which risk premium is wanted. Most traders hold a lot of equity risk premium but not much volatility risk premium.
This is largely because the equity risk premium is well-known. On the other hand, the volatility risk premium may evoke horror stories of traders selling premium uncovered, only to see a big adverse move in the underlying, and destroying their trading accounts.
While selling volatility can be dangerous, when done in a smart way (covered and/or with a delta hedging component) it can be a worthwhile liquid alternative source of return to capture within a portfolio.
Whatever the case, when the goals are laid out, creating a portfolio strategy customized to one’s needs can be straightforward.
For those who want to collect more volatility risk premium, they have a few potential opportunities:
- selling options closer to ATM to increase the amount of premium
- sell more options to increase short volatility exposure – e.g., instead of a basic covered call, a trader can sell more calls either at the
- strike price desired or further OTM to create more of a straddle or strangle trade structure sell put options below the current price of the underlying to potentially add to their equity exposure, assuming doing so would remain within prudent concentration and risk limits
Those who want to supplement their equity exposure with capturing the volatility risk premium can pursue a delta-hedging strategy. A trader can try delta-neutral straddles or strangles, or a delta-hedge ATM covered call strategy.
There are various permutations of what can be attempted.
Regardless of the exact strategy, it’s important to understand that everything comes with trade-offs.
If you add more ATM call options, you limit your equity upside and capture less of the equity risk premium. If you have more OTM options, you limit the amount of volatility risk premium you can capture.
If you add more call options than it takes to be covered to increase your short volatility exposure, this comes with potentially uncovered exposure and can cause losses if the stock rises too far. And so on and so forth.
You need to have a plan and a strategy and carefully test it out, both through backtesting (ideally) and trying it out in a simulated demo environment. Or even with a small amount of real money.
When you have seen that it works, you will need to continually monitor what you’re doing to make sure that your trades are going as expected in terms of their return and risk characteristics.