Is the 60/40 Portfolio Dead?


The 60/40 portfolio pertains to an asset allocation that is 60 percent stocks and 40 percent bonds.
The general thinking is that the 60 percent in stocks gives the portfolio a high enough risk asset allocation such that it can generate quality returns while the 40 percent in bonds gives diversification and a capital preservation element and helps cut down on the portfolio’s overall volatility.
If we look at portfolio returns since 1972 in an all-stocks portfolio versus the 60/40, we see comparable returns in 60/40 (about only 80bps less per year) but with only 64 percent of the volatility (a common stand-in for risk).
Portfolio Returns
| Portfolio | Initial Balance | Final Balance | CAGR | Stdev | Best Year | Worst Year | Max. Drawdown | Sharpe Ratio | ||
|---|---|---|---|---|---|---|---|---|---|---|
| Stocks | $10,000 | $1,240,168 | 10.39% | 15.60% | 37.82% | -37.04% | -50.89% | 0.42 | ||
| 60/40 | $10,000 | $879,298 | 9.62% | 9.94% | 31.69% | -15.07% | -28.54% | 0.51 |
The good years aren’t quite as good for the 60/40, but the worst year was just a 15.1 percent drawdown versus a 37 percent drop for a pure equities portfolio.
The maximum drawdown was only about half as bad. The Sharpe ratio is about 20 percent higher.
The blue bars below represent the annual returns of the all-stocks portfolio while the red shows the yearly returns of the 60/40.
Annual Returns: Pure Stocks Portfolio vs. 60/40 (US-based)
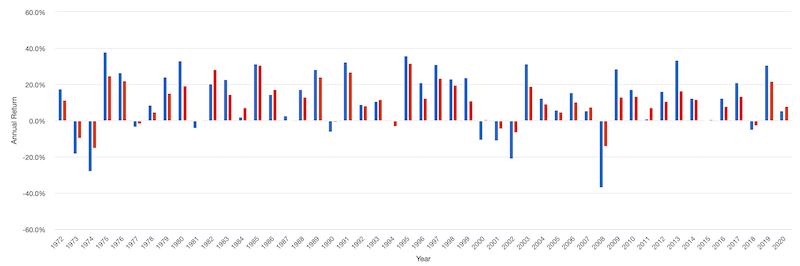
(Source: portfoliovisualizer.com)
Given the asset class concentration of the stocks-only portfolio – and hence the environmental bias – the drawdowns are more severe.
The problem with the 60/40 these days is that bonds no longer provide much in the way of income.
The “bonds” component of the allocation studied here is the 10-year Treasury. Those now yield only 60bps per year.
They also come with material price risk given their duration – in other words, movements in interest rates change their prices. So, even a minor daily shift in interest rates can wipe out the totality of its annual returns.
Over the course of this backtesting sample, US 10-years averaged 7.2 percent annual returns against 10.4 percent for stocks.
These returns came heavily from the huge tailwind of interest rate declines over the past four decades, when 10-year yields declined from 15 percent down to their near-zero number.
| Name | CAGR | Stdev | Best Year | Worst Year | Max. Drawdown | Sharpe Ratio | ||
|---|---|---|---|---|---|---|---|---|
| US Stock Market | 10.39% | 15.60% | 37.82% | -37.04% | -50.89% | 0.42 | ||
| 10-year Treasury | 7.21% | 8.03% | 39.57% | -10.17% | -15.76% | 0.34 |
Bonds are now useless for income generation purposes
The inability to push nominal rates down much further likely means the end to the bond bull market that’s been in effect since 1981 in the US. At the least, it’s running out of gas.
Even if Treasuries were to go from their 0-1 percent return down to minus-1 percent (i.e., to the world’s lowest yields), that only adds up to about seven percent annualized returns over three years.
If there was a normalization in real yields and an uptick in inflation to four percent – as a standard bear case – would mean holders of 10-years would lose about 20 percent annualized over three years.
Interest rates can’t go down much below zero, but there’s no ceiling in terms of how high they can go.
Just taking those bull case and bear case returns, the bear case has about 3x more to it in terms of price movement from that vantage point.
Though Treasuries are considered safe, having practically zero nominal returns and negative real (inflation-adjusted) returns makes them unappealing to US-based investors. (This also goes for all other developed bond markets from a domestic investor’s perspective.)
For non-domestic traders and investors, the risks are actually worse because of the currency situation.
If bonds don’t yield anything and central banks are creating a lot of currency to deal with their debt problems – and there is too much debt relative to income which will necessitate a lot more printing over time – that’s bearish for the currency.
For example, from a Chinese investor’s perspective looking at US Treasury bond debt, not only does owning those bonds not really produce any income, but there’s the currency risk as well.
There are also other factors, such as the increasing conflict between China and the US. This brings risks in terms of capital flows and disruptions. The US can unilaterally decide to suspend its interest payments to China if it wanted to.
Bonds as diversification are not likely to work as well
Over the past three decades, traders and investors have become accustomed to bonds gaining when stocks slide. Bonds provided a type of offset to make the downswings in equities not as painful.
But now with interest rates pinned near zero across all yield curves in developed markets, that kind of dynamic is no longer likely.
Not only do bonds generate little to no income in nominal terms (and likely negative returns in real terms), but they no longer have the diversification potential if their price upside is limited.
Interest rates can only be pushed so low (in nominal terms) before it fails to stimulate new borrowing and lending activity.
Extrapolation of current conditions
Because of the bull market in bonds that has stretched forward from the early 1980s, from a 15 percent 10-year to a near-zero 10-year yield, these conditions tend to be extrapolated forward.
While it’s possible that the 10-year yield goes from half a percent to negative territory along with some other developed market yields, it’s also possible that real yields can normalize and inflation can pick up.
If demand stays constant but supply shrinks, then inflation can pick up.
The deflationary forces could win out just because they’re still so large, including:
- High debt relative to income (i.e., if debt has to be paid it diverts away from spending on goods and services, savings, and the purchases of financial assets)
- Aging demographics (higher dependency ratios, increasing obligations relative to revenue)
- Offshoring production of various forms to more cost-efficient places, a drag on worker salaries
- Technological developments to increase economy-wide pricing transparency, create supply-side expansions, and reduce reliance on expensive labor
- Diminished role for organized labor (e.g., unions)
But with unemployment going to remain higher and various industries slow to come back, supply-side constraints could bite faster.
Overall, there are a wide range of outcomes with respect to inflation over the next decade-plus.
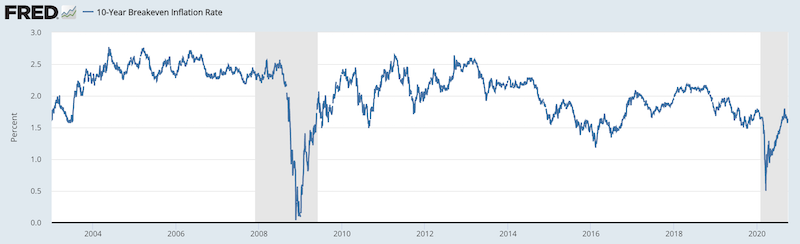
Investors expect it to remain under two percent over the next ten years and thirty years, based on the pricing of inflation-linked government debt.
10-year breakeven inflation rate
30-year breakeven inflation rate
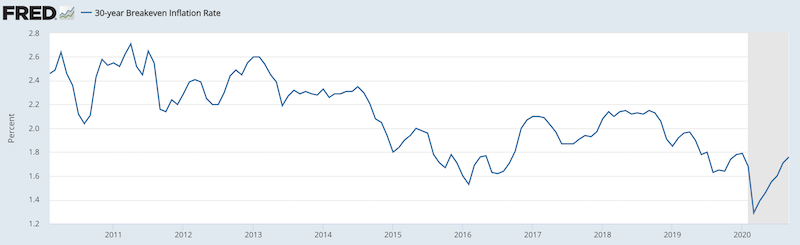
(Source: Federal Reserve Bank of St. Louis)
Both inflation rates are priced in the 1.6 to 1.8 percent range, below the Fed’s two percent mandate.
Investors expect more of the same, but a lot can change.
While in 2008, and in various years beyond that, interest rates hit zero, in the early 1980s they were the highest in US history. Back then, the prevailing belief was that double-digit interest rates were a permanent fixture of the environment.
Those conditions were based on a bear market in bonds that had characterized the previous 30+ years (late 1940s to 1980).
Yield curve control from the World War II era had ended in 1947. Yields on 10- to 30-year debt rose from 2.5 percent to more than 15 percent by 1981.
This had battered bond prices and those yields were further hit by inflation eroding their yields in real terms.
From 1981 and into the 2020s, you see the mirror image of that situation.
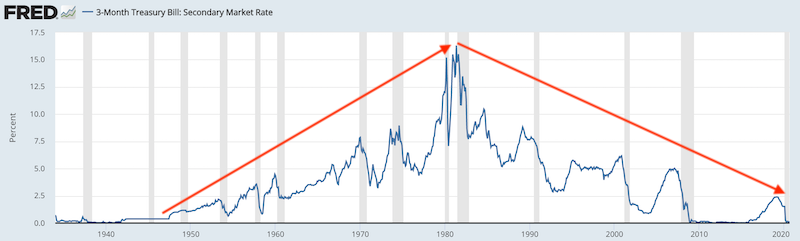
(Source: Board of Governors of the Federal Reserve System (US))
The super-low interest rates of the period are believed to compound for a long time forward.
That expectation is a function of extrapolation. What’s worked well in the past is assumed to work well going forward.
Anyone from the US, and most of the developed world, whose trading and investing lifetimes go back up to 40 years is conditioned by the reality of interest rates falling.
They are also not used to the idea that an inflation shock could occur (the late-60s and 1970s) that could derail both stocks and bonds and the entire basis behind a 60/40 portfolio.
This disinflationary trend from 1981 forward (in the US, but in most of the developed world) has occurred irregularly yet persistently over each cycle, with each cyclical peak and trough shallower than the previous one.
Debt relative to income went higher, reducing how much interest rates could rise before causes debt servicing issues.
In turn, this environment has conditioned investors to build portfolios that would have done well in the recent past.
The 60/40 portfolio, in particular, is popular because of how it has performed over the past forty years even if the next decade-plus is unlikely to follow the same paradigm that gave it quality returns.
Lower interest rates provided a tailwind to bonds and stocks, leading to high nominal and real returns over the past forty years.
Over that time, bonds were not only a reliable diversifier to other riskier assets, but also added quality gains to a portfolio.
With a 10-year at around half a percent annual returns and a 30-year at around one percent, they’re almost out of room.
And since bonds of that duration have price risk, all it takes is a slight move in interest rates (which can happen at the daily timeframe) to wipe out the entirety of the annual yield.
That also means there’s little room for them to fall further in an economic downturn. That means they can’t reliably diversify the risk of a stock portfolio, which in turn undermines the concept of the 60/40 portfolio.
Low, zero, and/or negative interest rates also have implications for stocks. Falling interest rates increase the present value of future cash flows from stocks, or the basic discounting process that drives their values.
In normal recessions, lower interest rates can help offset the impact of lower cash flows.
Lowering rates is the main tool central banks use to boost the economy in downturns. But at zero, they’ve lost the power to lower the discount rate or do much to offset lost earnings.
The 60/40 portfolio has worked well under disinflationary conditions.
But it is not likely to do well in inflationary environments, which hurt both types of assets.
A stocks and bonds portfolio can diversify with respect to growth but diversifies poorly with respect to inflation.
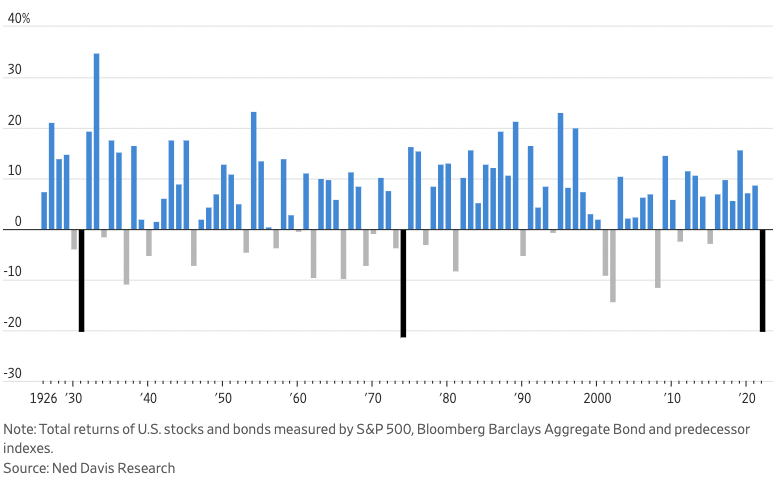
This can lead to painful drawdowns as in 1931, 1974, and 2022:
Drawdowns of 60 percent stocks, 40 percent bonds in the US since 1926
The poor balance of the 60/40 portfolio
Because 60 percent of the allocation is in stocks and 40 percent of the allocation is in bonds, it seems somewhat balanced because of the dollar amount in each.
But in terms of risk, it’s not a balanced portfolio at all.
Stocks are more volatile than bonds, so a 60/40 portfolio is actually about an 89/11 portfolio breaking down the risk. That means the stocks part of the portfolio will be felt disproportionately.
Portfolio Risk Decomposition
| Instrument | Stocks | 60/40 |
|---|---|---|
| US Stock Market | 100.00% | 88.6% |
| 10-year Treasury | 11.4% |
Diversifying the inflation aspect
A basic way to diversify the inflation part of the portfolio would be to put the “40” part into inflation-protected bonds instead of nominal bonds.
Nominal bonds are the standard variety, with fixed coupons and principal. Inflation-linked bonds have the same but also receive the CPI inflation rate in the jurisdiction in which they’re based.
So, for example, if a 10-year bond yields 0.5 percent, that’s the yield you’re locked into if you hold that bond to maturity.
If a 10-year inflation-linked bond yields minus-1 percent, but inflation comes in at two percent for the year, you get the minus-1 percent plus the inflation figure of two percent, for a total return of 1 percent.
In terms of economic policy, central banks now place more emphasis on putting a floor under inflation rather than a lid. Given how difficult it has been to stimulate inflation, more focus is now on preventing deflation.
With respect to what this could mean in terms of portfolio dynamics, this could make some allocation to inflation-linked bonds more important than normal.
This is because there is no floor under real bond yields. Real yields can go much lower than zero, boosting their prices.
Nominal bond yields are equal to the real yield plus inflation.
This was the case under the last yield curve control regime in the US during WWII. Bonds all along the yield curve gave 0.375 percent to 2.5 percent, but inflation hit into the double digits during the latter parts of WWII and the period after.
For example, if one yield is one percent but inflation hits 10 percent, then the real yield is minus-9 percent. That can provide a lot of upside for inflation-linked bonds, but you’re locked into that yield on nominal bonds.
In fact, with the price risk of nominal bonds, if the central bank doesn’t buy the debt to hold those yields down, then you’d actually lose money taking the instrument on a mark-to-market level.
If the 10-year Treasury yield is 50bps and the inflation breakeven rate rises, the real yield declines.
Currently, the yield on a 10-year Treasury inflation protected security (TIPS) is minus-100bps.
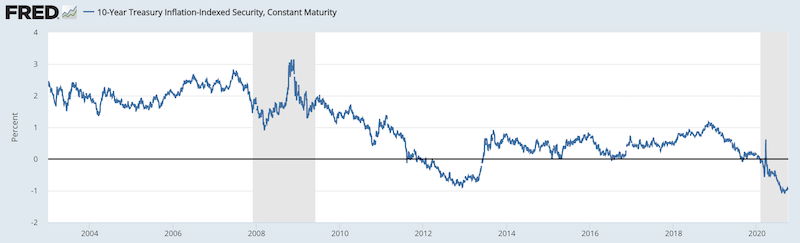
(Source: Board of Governors of the Federal Reserve System (US))
As mentioned, at the end of the year, the government provides a separate coupon equal to CPI inflation. If it’s equal to 1.5 percent, then the total yield is about 0.5 percent, the same as a nominal yield bond.
If it runs higher, then the investor receives more than a nominal yield bond.
So while a nominal yield bond investor is constrained by how low nominal yields can go, a real yield bond investor doesn’t face such constraints.
The image below shows the yields between a standard nominal bond (top line) and inflation-linked bond (bottom line).
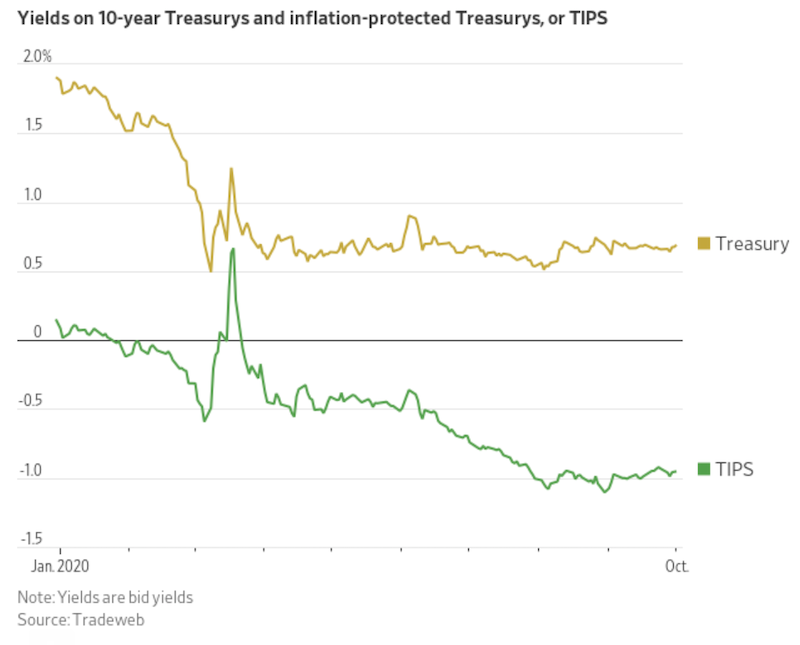
The nominal bond (“Treasury”) yields more than the inflation-linked bond (“TIPS”). The exception would be when inflation is negative or priced to be negative going forward.
The holder of the inflation-linked bond receiving a payment at the end of the year based on CPI would put the TIPS yields on par with the Treasury yield.
An inflation-linked bond is a better performing asset relative to its nominal yield counterpart when inflation runs above expectations, and vice versa.
How to get reflation
If the excess liquidity produced by the central bank gets into spending that can boost inflation, particularly if supply and production doesn’t keep pace with demand.
If the excess liquidity isn’t spent, then it can go into the purchase of financial assets, boosting their prices.
Gold has benefited and is likely to further benefit from ongoing monetary stimulus.
When real yields are unacceptably low and the central bank has to create a lot of money to keep pace with debt servicing demands, gold becomes a form of a currency hedge. It also has a track record going back thousands of years.
The role of other alternative assets
Portfolios should ideally go beyond just stocks and nominal bonds, though they’re the traditional ways money is invested.
Gold and commodities can play a role, as well as the aforementioned inflation-linked bonds.
Some also consider things like newer asset classes like cryptocurrencies and other forms of digital currencies.
However, the vast majority of these digital assets are not the best stores of wealth because they’re too volatile.
The buyers and sellers in these markets are heavily skewed toward smaller speculators who are trying to make a profit off the price movement. They largely do not see it as something that will hold its value over time, though some are trying that approach as well.
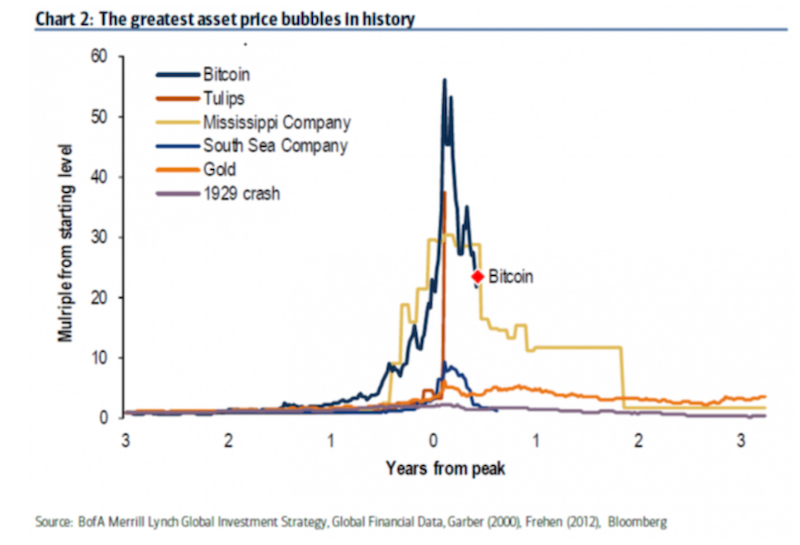
Bitcoin specifically became one of the more popular asset bubbles in recent memory after public attention from its price rise in 2017 fueled heavy speculation among the public.
But each cryptocurrency has the following matters to contend with:
– The popularity of bitcoin and some of the popular alternatives (e.g., Ripple, Ethereum, Litecoin) has led to thousands of competing cryptocurrencies. The technology is easy to copy. “Forks” are simply a matter of taking a code and changing it, much like how a piece of software would be altered.
– Given cryptocurrencies are a market primarily of speculation, most involved are simply playing “greater fool” game.
– Cryptocurrencies don’t fit the traditional characteristics of a currency: a means of exchange (because cryptocurrencies can’t buy much) and a store of wealth (too volatile)
– Uncertain value as a currency hedge due to its lack of track record
– Uncertain value as an investment, as it can’t defer consumption into the future.
As a currency hedge – when debt monetizations make real rates unacceptably low – cryptocurrencies don’t have the track record of various alternatives like gold and silver.
This doesn’t lend confidence to central banks and the big institutional investors that it’s viable in that respect. And these are the institutions that are largely responsible for the demand of most financial assets.
What are they going to hold and what are they going to transact in? Namely, will there be a stable source of demand?
They’re going to go to other alternatives. Cryptocurrencies have a very long way to go as a source of currency reserves for the large players in the markets.
In the financial and technology world, and in the intersection of both (fintech), some are launching digital currencies or are in the early stages.
The primary aim of new platform-based currencies or payment methods is to extract efficiency improvements in some form.
This can include:
i) technological implementations to improve existing payment infrastructures or,
ii) as transactional mediums to allow consumers, businesses, and other customers to purchase goods, services, and/or financial assets within a proprietary platform
Ultimately it comes down to value as the asset class matures and graduates beyond mere speculative instruments.
The degree to which digital currencies can create value will be dependent on their ability to streamline operational processes, create value-additive processes for customers and business partners, reduce costs, and do it in a way better than alternatives (i.e., incumbents and new entrants).
Any digital currency system also needs a sound governance system so that it’s fair and dependable for all parties involved.
It needs a robust legal and appropriate regulatory framework to develop a system that’s sound and can scale up to broader adoption in both financial and non-financial contexts.
Governments will naturally have concerns about “off the grid” currencies, as they represent payments systems that aren’t under their purview. This can lead to legal gray areas or have such systems used as a conduit for illicit activity.
Even gold has been periodically banned by governments throughout history, including in the US from 1933 to 1975, outside of certain circumstances (e.g., coin collection, jewelry, industrial uses).
The regulatory process will go on over time.
Cryptocurrencies have the potential to work well and eventually have use in mainstream investing portfolio.
But they currently have a long way to go, even as they represent an interesting store of wealth-like assets.
Bitcoin and other cryptocurrencies have certain things going for them. This includes their limited supply (in most cases) along with their liquidity and mobility (unlike real estate, for instance).
The equities side of the 60/40 portfolio
The store of wealth concept also applies to equities.
It’s especially important when operating at the zero interest rate lower bound. No longer can central banks cut interest rates to stop the fall in equities when cash flows fall.
Therefore, it’s more important than before to focus on companies that have relatively stable earnings rather than companies whose earnings are highly cyclical.
Cyclical industries include:
– autos
– heavy machinery
– raw materials
– consumer discretionary items (e.g., luxury purchases, travel, vacations, leisure)
Staples industries include:
– food and grocery
– basic medicine
– consumer staples as a whole
Companies that can serve as quality stores of wealth include those at the frontier of productivity. This includes the “big innovators”.
These are often tech companies in some form who have strong balance sheets (i.e., plenty of cash, little to no debt), high profit margins, and the ability to withstand a hit to their revenues.
Companies that may do well coming out of shocks are the ones whose incomes aren’t disrupted much in the present because their earnings are discounted to come far off in the future.
This may include companies like Nvidia (NVDA), AMD, and even some current strong cash generators like Apple (AAPL), Microsoft (MSFT), and Facebook (FB).
Long duration vs. Short duration
These types of stocks are “long duration” in nature. The market is readily willing to fund them if necessary.
They are perceived as “cutting edge” innovators with products and services involving artificial intelligence, machine learning, cloud computing, advances in software and hardware, and so on.
For “shorter duration” assets, they have thinner margins and typically have cyclical exposure.
The ones with cyclicality embedded in their business model (i.e., do well when people have more disposable income and worse when people don’t) will see their balance sheets battered during periods of high unemployment. This includes airlines and automotive manufacturers. (Tesla (TSLA) was treated as an exception to other auto OEMs as the narrative told on them is different.)
Diversification on a global level is now more important than normal
Most portfolios do poorly in big market shocks because they are poorly diversified. Even if they own a lot of stocks, equities do well in a particular environment and poorly when in an environment that’s not well suited to them (i.e., when growth runs below expectation, particularly in a big way).
Wealth isn’t so much destroyed over time as it just shifts.
Wealth is always moving between asset classes, between countries, between currencies, and between different fiat and non-fiat storeholds of wealth.
That’s why achieving balance (among asset classes, countries, currencies, commodities) is critical to the average investor trying to grow their wealth reliably over time without suffering the stress of high volatility and big downswings and underwater periods.
Global diversification has become more important than ever with the yields across developed markets.
That not only means low returns on cash and bonds, but it also means equities start bending down closer to those yields as well when there are no other alternatives to park money.
And with the geopolitical situation playing out, global diversification can also start being more effective than normal.
Countries are wanting to be more self-sufficient rather than reliant on others in terms of trade, supply chains, and so on.
Asia, led by China (excluding Japan), is turning more inward with trade and geopolitical frictions with the US and Europe, the two main reserve currency regions. As a result, China and some of its neighbors are becoming more like an independent third economic bloc.
China’s monetary policy is now becoming more independent.
As they develop to more of a consumption oriented economy and less of an export related model, tying the yuan to the dollar (because the US is its main trading partner) is become less important.
It will still be managed relative to the dollar and the yuan’s ebbs and flows will be smoothed out by Beijing to underpin more confidence in the currency (and contribute to other countries using it more in their reserves), but it will be managed less tightly to the dollar peg.
China’s interest rates are also higher, with bond yields of around three percent. So, it still has traditional monetary policy room that isn’t seen in developed markets.
That means Chinese nominal bonds can make sense in some quantity, especially if global deflation remains the trend.
The general picture is that Asia will become less correlated with the US and the West. This will, in turn, enhance its diversification potential for market participants looking to build better portfolios with better returns for each unit of risk.
For the mathematics on diversification and its benefits, we have a separate article on that here.
The future of the 60/40 portfolio
Due to extrapolation and the bias to keep doing what has worked – even if circumstances suggest the future will be different from the past – the 60/40 will still remain a common portfolio construction.
With expensive stock markets and low yields throughout the developed world, the prospective returns of traditional assets are low to the point where the forward returns of a 60/40 allocation look to be around two percent annualized going forward.
Considering most pension funds adopt a 60/40-like approach to the market – putting the majority of a portfolio in equities up to a level of volatility that can be tolerated and throwing in some safer assets for the remainder – this is not encouraging.
Most pension funds have about a 7 percent hurdle rate to make due on their contingent liabilities.
If the 30-40 percent of the allocation in bonds isn’t getting them much, then that’s a big problem. Or they have to take more credit risk, which makes them susceptible to deeper drawdowns and causes an increasing correlation to the equity side of the portfolio.
That means they need to get something like 10-12 percent annual returns in equities to hit their hurdle rates, which is not at all likely to transpire in the long-run. Unless central banks are successful in generating inflation (and not tear down asset prices by hiking rates to control it).
This would potentially get the high returns needed in nominal terms, but would be bad for asset managers with a lot of variable-rate liabilities. Not to mention poor for increasing real spending power and creating better overall living standards.
Traders and investors can try to escape the low returns of the financial world by becoming more like private business owners.
Namely, they can look to own private assets instead and look more toward private equity, venture capital, and other forms of private asset investing (private credit, specialty lending, real estate, hard assets, and so on).
The investment business can no longer be as clearly differentiated from other forms of private business.
Private assets also come with the benefits of not being marked to market. The lack of any perpetual market pricing can be helpful for some traders and investors.
Even if a business is improving internally, its equity can still fall in value materially in a stock market sell-off. That can cause a problem for holders of it who may need to risk manage the “irrational” decline.
60/40’s long-run real returns are expected to be around the aforementioned 2 percent (purple line, left axis below). It is compared alongside a “value spread” which essentially compares the valuation ratio(s) of a portfolio of cheap securities versus that of an expensive portfolio (blue line).
Expected Real Return of a Global 60/40 Stock/Bond Portfolio and Global Value Spread
January 31, 1990 – November 30, 2020
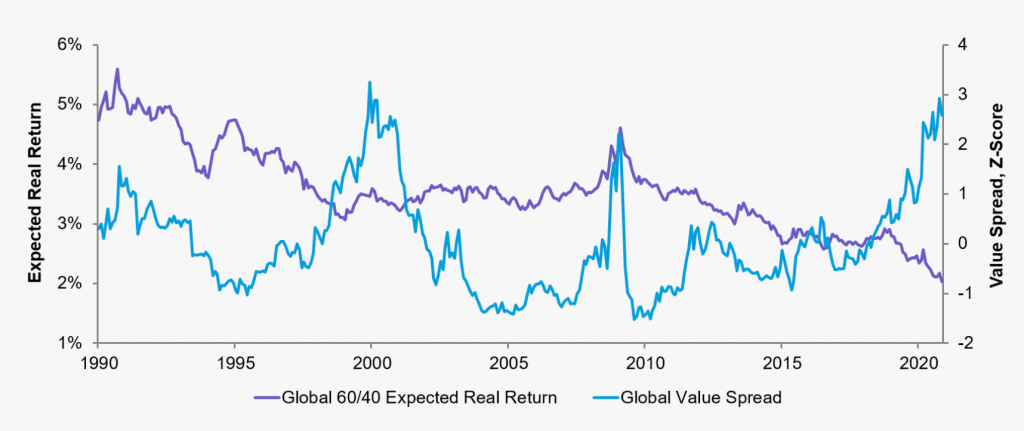
(Source: AQR, Bloomberg, DataStream, MSCI, Consensus Economics, CRSP, XPressFeed, IBES)
The prospective expected return of a 60/40 portfolio over the long-term is at a record low. When discount rates are at around zero – a function of ZIRP and QE policies pursued after the 2008 and 2020 crises – that pulls forward returns, which reduces what investors can expect going forward.
Final Thoughts
For most of the past four decades, the basic combination of a 60/40 allocation of stocks and bonds was a very good mix. It’s been rare that stocks and bonds both fall in price.
The 60/40 rule for a “balanced” portfolio has long been the starting point for many investors, especially in the US.
Since the 2008 financial crisis, money has flowed into multi-asset funds in the US, more than doubling their total assets to around $4 trillion.
Assets under management in US multi-asset funds
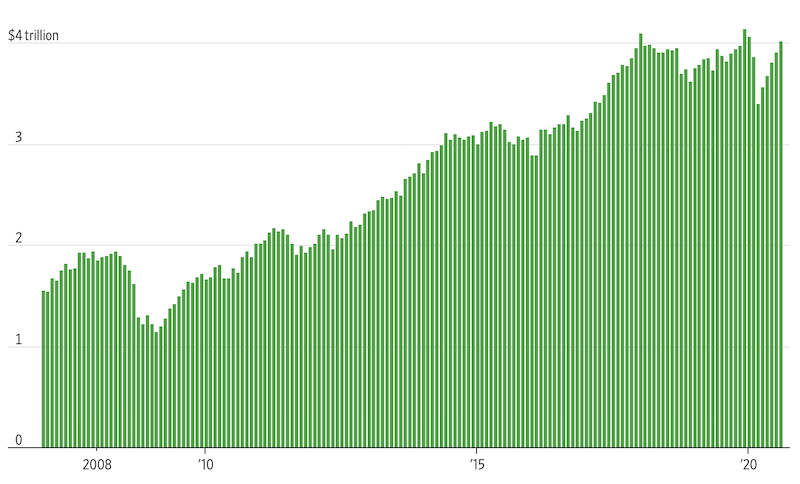
(Source: Goldman Sachs)
The 60/40 portfolio tends to work best when there is quality economic growth and low inflation. Disinflation – in other words, lower inflation relative to previous norms – was the trend, which was a boon to both stocks and bonds.
But in the future, there is less likely to be such a favorable mix of the two main factors that drive portfolio growth.
The risks of higher inflation and of deflation are both greater than in the past. This is a major reason why the classic balanced portfolio mix of 50 to 60 percent equities and 40 to 50 percent fixed income securities is unlikely to function well for a long time.
So, people will need different solutions when it comes to asset allocation.
Now the Fed has declared that interest rates are not going to go up or down much for years, keeping rates in a relatively narrow trading range.
Chairman Jay Powell said in May 2020 that the Fed didn’t want to take rates negative, and asserted in August that the central bank wouldn’t raise interest rates until inflation had run above target for a time.
That means no longer will there be a steady interest rate tailwind for financial assets, and bond yields are already at around zero.
But such an allocation leaves a portfolio exposed to higher inflation risks. Relying on the 60/40 portfolio is heavily an extrapolation of the good times that are not likely to continue.
But times are changing and have already changed. Interest rates can’t go down much further, so the traditional wind to the back of both stocks and nominal bonds is gone.
The yields on bonds are also down around zero. That means not only is their diversification potential severely lacking (because their yields can’t go down much more to offset losses in equities), but they generate practically no income.
In such an environment, assets that can do well in a rising inflation environment should be of greater priority.
Diversifying one’s bond mix more toward inflation-linked securities (e.g., TIPS, ILGs (inflation-linked gilts)) could make more sense, as well as targeting higher nominal yields in other countries.
While 5-year US Treasuries offer less than half a percent yield per year, 5-year Chinese government debt still pays out about three percent.
Gold, precious metals, and other commodities could also play more of a role in diversifying equities exposure.
Cash is also useful to have in some quantity to take advantage of cheap stocks and bonds when they fall. It can also be a decent-returning investment when the rate on it compensates for the inflation rate to give it a neutral or positive real return.