The Power of Zero Interest Rates


This article was published on October 19, 2020
The fed funds rate is the base rate that influences many other interest rates, including the cost of debt and equity for businesses as well as the rate of return on cash and rate at which investors can borrow.
The effect of lower interest rates on earnings multiples is non-linear.
We’ve mentioned in other posts that the risk premium between a 10-year bond and equities is about 300bps or a bit above.
The 10-year is also very close to zero (about 50bps).
So if we take a 300bps premium (that investors want to compensate them for taking more risk in equities) plus 50bps, that’s a 3.5 percent expected return on equities.
We can make adjustments to the cash rate or 10-year rate (whatever the preference) and watch how lowering them increasing the earnings multiples of stocks in a non-linear way.
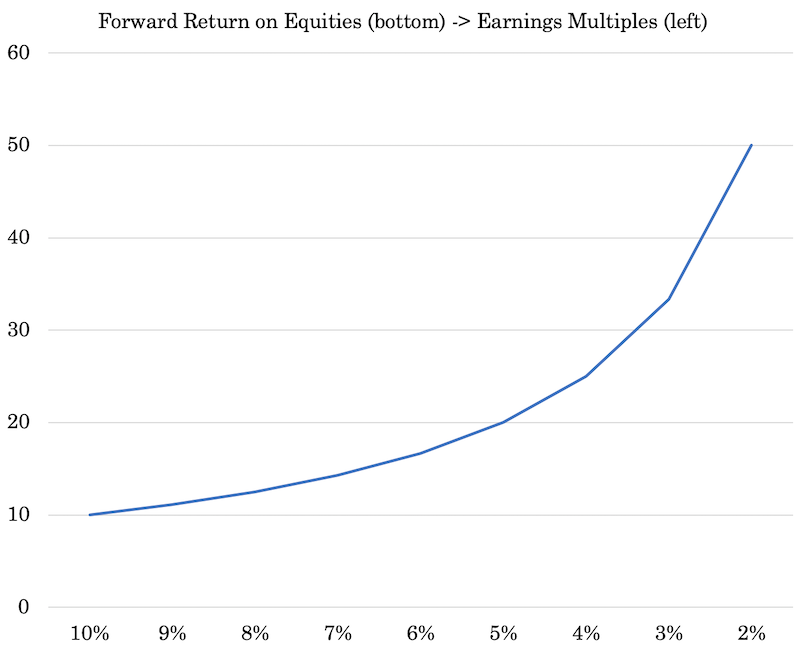
The lower the discount rate and the tighter the risk premium, the higher equities go in price.
If the discount rate goes from 2 percent to zero, and the risk premium goes from 3 percent down to 2 percent, then that former yield of five percent (2 percent discount rate plus 3 percent premium) goes down to two percent (no discount rate plus a 2 percent premium).
In that case, your earnings multiples go from 20x (the inverse of 5 percent) to 50x (the inverse of 2 percent).
While going from two percent to zero doesn’t seem like much, much like only a 100-bp compression in the risk premium, it can send earnings multiples up by 2.5x.
If that occurs even while earnings remain unchanged, that means equities are up 2.5x, or 150 percent. Even if earnings were to halve – e.g., a really bad recession – stocks would be up 1.25x, or 25 percent.
This is how you can have a great stock market but a bad economy. In fact, the best environment for stocks is generally one where the central bank is looking to get it going again in a sluggish economy. It feeds liquidity into the economy, which gets into asset prices.
When inflation picks up (or they want to get in front of inflation), that’s when they start hiking interest rates and removing liquidity from the financial system, typically in a “booming” economy.
Stocks begin falling even as the economy is near cyclical highs. In general, markets lead the economy and this is the general dynamic.
All of this interest rate lowering makes a big difference down toward the lower bound. Going from 5 percent to 2 percent can make a 2.5x difference in the earnings multiple.
But going those 300bps would make just a 1.4x difference going from 10 percent (10x P/E ratio) to 7 percent (14x P/E ratio), for example.
A brief aside on risk premiums
The risk premium component takes a backseat to the interest rate aspect, but it’s still important nonetheless.
In volatile markets, the risk premium increases because the market participants are sensitive to all the extra risk and volatility. So, they demand a higher risk premium for buying risk assets.
In more tranquil markets, yield becomes the more important factor as volatility is less of a concern. So, risk premiums fall. But this also causes market participants to feel more comfortable leveraging their portfolios, especially as forward returns fall. As a result, these types of quiet periods tend to sow the seeds of their own demise.
In the initial stages of a downturn, even when the central bank cuts rates, risk premiums expand out.
It’s not until enough support measures have been taken, and volatility subsides, that investors feel comfortable taking on risk en masse and risk premiums begin to decline again.
A fuller explanation of the interest rate dynamic
Below we’ll go through a deeper explanation of the interest rate dynamic. It’s an important matter to understand, as all of finance and financial markets essentially run on the concept of interest rates.
At its foundation, you are chasing a yield, which is comprised of the risk-free rate plus a risk premium.
I) The stimulative effect low / zero interest rates provide
Generally when people think of an interest rate cut they think of the stimulus impact.
It helps practically everything that involves borrowing and financing by making it more attractive.
Monthly housing payments become cheaper. Those with existing mortgage payments can refinance at better interest rates. Cars and boats become cheaper, as do other consumer goods.
Practically anything involving borrowing and financing is made more attractive.
Corporate interest expenses decline. Capital investments, whether they be new factories, property, equipment, or anything else, become more likely to take place.
The pull forward effect
People also have a fear of missing out on low rates. So, transactions that were being deferred for economic reasons get pulled into the present as people want to act now.
For the same reason, when stocks go up from lower interest rates, a material part of it is simply future returns being pulled forward, decreasing what they’re likely to generate going forward.
II) The increase in discounted present values
The value of an asset, at the most basic level, is the amount of money that will be earned from it over its life discounted back to the present.
The discounting process occurs because a dollar received today is worth than a dollar in the future. Namely, money that is invested today should bring back more in the future.
For example, if you need a return of 10 percent per year, you would pay $0.38 today to receive $1 in ten years.
The process of figuring the value of an asset, based on the projection of its future values, is known as discounted cash flow analysis, or DCF.
The discount rate is used to set the estimates of future cash flows equal to the initial investment. This assumes that the cash flows materialize as you anticipate.
If you were to reverse engineer the sentence above, if you paid $0.38 and got $1 back in ten years, you would see that you’ve generated annualized returns of 10 percent. This is a compounded figure as distributions are reinvested over time.
The discount rate applied is dependent on the risks that are present while waiting for them to come about.
This includes the loss of purchasing power due to inflation as well as the risk of loss on principal.
The riskier something is, the higher the discount rate.
Nonetheless, the interest rate applied to any investment is also a function of the rates available on other investments. There are opportunity costs involved.
When rates on other investments are low, a lower overall discount rate will be used. When lower discount rates are used, the higher the present values.
Accordingly, low / zero interest rates increase the value of all investments on a discounted cash flow basis. This is true for bonds and equities, and also flows through into real estate and private equity.
III) A lower risk-free interest rates down the returns demanded on all investments across the spectrum
What people refer to as their risk-free rate differs. Some use the two-year rate, some the 10-year (though that comes with price risk due to its duration), while some use a cash rate.
A cash rate is essentially the rate paid by the government on a security that goes in duration from 30 to 90 days.
When operating at the monthly or quarterly level, inflation is not as much of a concern as it is when going out on a multi-year timeframe.
There’s also less duration risk. The price of a 30- or 90-day fixed income security isn’t going to move around much because its payout date is right around the corner.
There is essentially no credit risk, as the government is the entity making the payment. It can create all the money it requires to makes its payment. The risk of inflation is also low because of the upcoming repayment at maturity.
Given that the risk-free rate of return can be earned with safety, and safe returns are preferred over risky returns, traders and investors don’t want to take risks without being adequately compensated for it.
As the uncertainty with respect to future returns increases, a risk premium is added to the potential returns.
Therefore, if we plot the relationship between risks and returns, we see a curve going from the lower left to upper right to represent this relationship that more risk entails more demanded return.
Risk vs. Return: Asset Classes
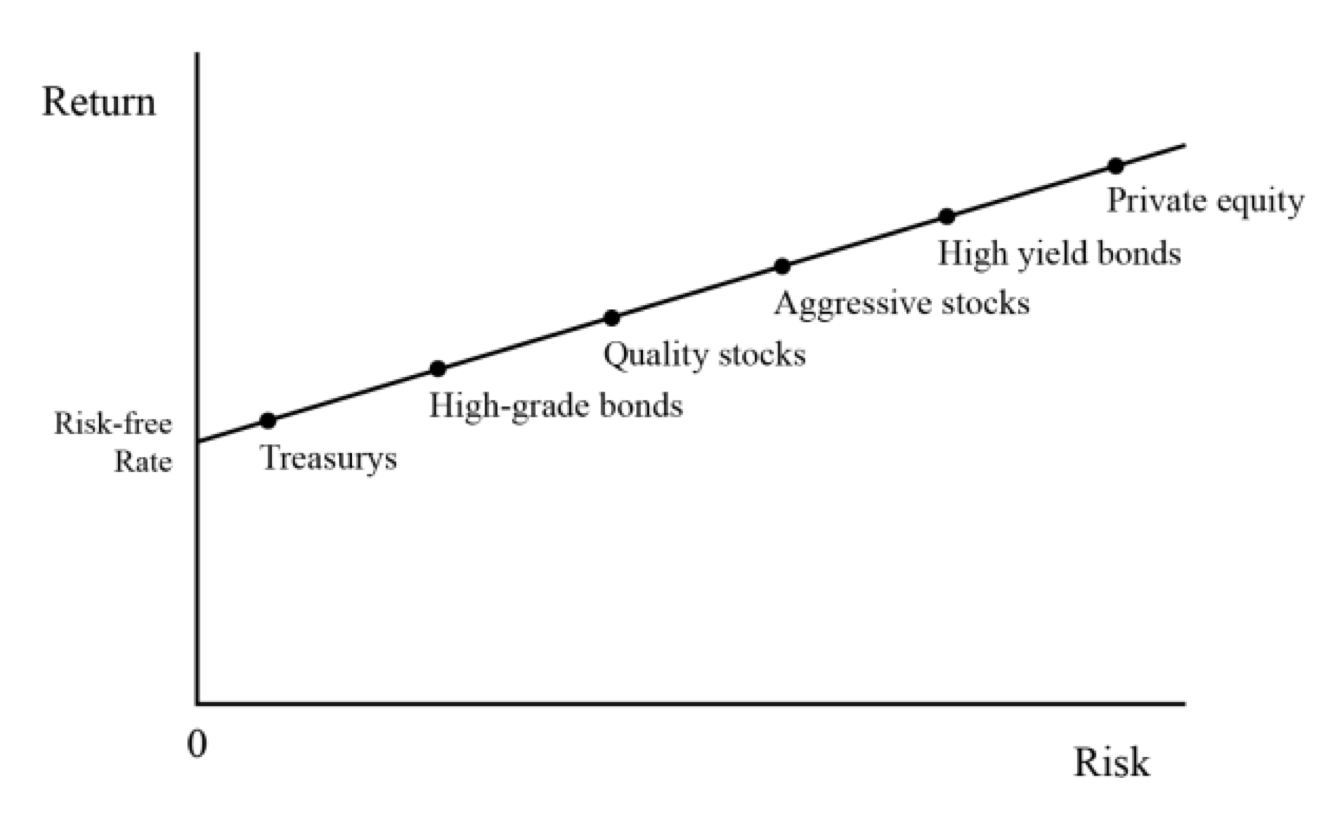
In terms of our risk ladder, we go from:
– cash/risk-free rate and Treasury bonds at the lower left (i.e., the safest sources of returns)…
– to high-grade bonds…
– to quality stocks (i.e., stable cash flows)…
– to aggressive stocks (i.e., low or negative earnings)…
– to the riskiest high-yield bonds…
– and finally onto investments like private equity that involve leverage and come with long lock-up periods and a lack of everyday tappable liquidity should the investor need it, which drives risk premiums higher (i.e., liquidity premium).
The rise in expected return relative to risk should show a fairly reasonable relationship. One of the natural equilibriums between the markets and economies is that riskier forms of capital should exhibit higher returns relatively to less risky assets.
When people refer to things like yield curve inversions, they are essentially saying that the relationship is out of whack. This is usually in reference to cash or short duration bonds having higher yields than longer duration bonds.
Markets that function well don’t tolerate kinks in this relationship for long. Financial assets outperform cash over the long run or else the capitalist system doesn’t work – i.e., using and borrowing cash to create things of greater value.
At the same time, these inversions are not necessarily bad and could even be welcomed for shorter periods of time.
If taking on risk always worked, then people would borrow and put it into risky assets without much concern and respect for risk, which isn’t desirable. The leverage in the system could get out of hand leading to boom and bust periods of higher magnitude.
Market downturns and bouts of volatility are healthy when they occur periodically to keep return and risk ratios appropriate for well-functioning markets and economy.
Over the long term, Sharpe ratios (i.e., excess returns over excess risks) generally approximate 0.2-0.3.
This could mean an asset class with 15 percent annualized volatility could see returns of 3.0-4.5 percent over the risk-free rate per year.
When the Fed lowered the fed funds rate by 150bps in March 2020, the interest rates, yields, and prospective returns of other asset classes fell in relation.
This is illustrated in the next graphic.
Falling short-term interest rates reduce the yields of other asset classes
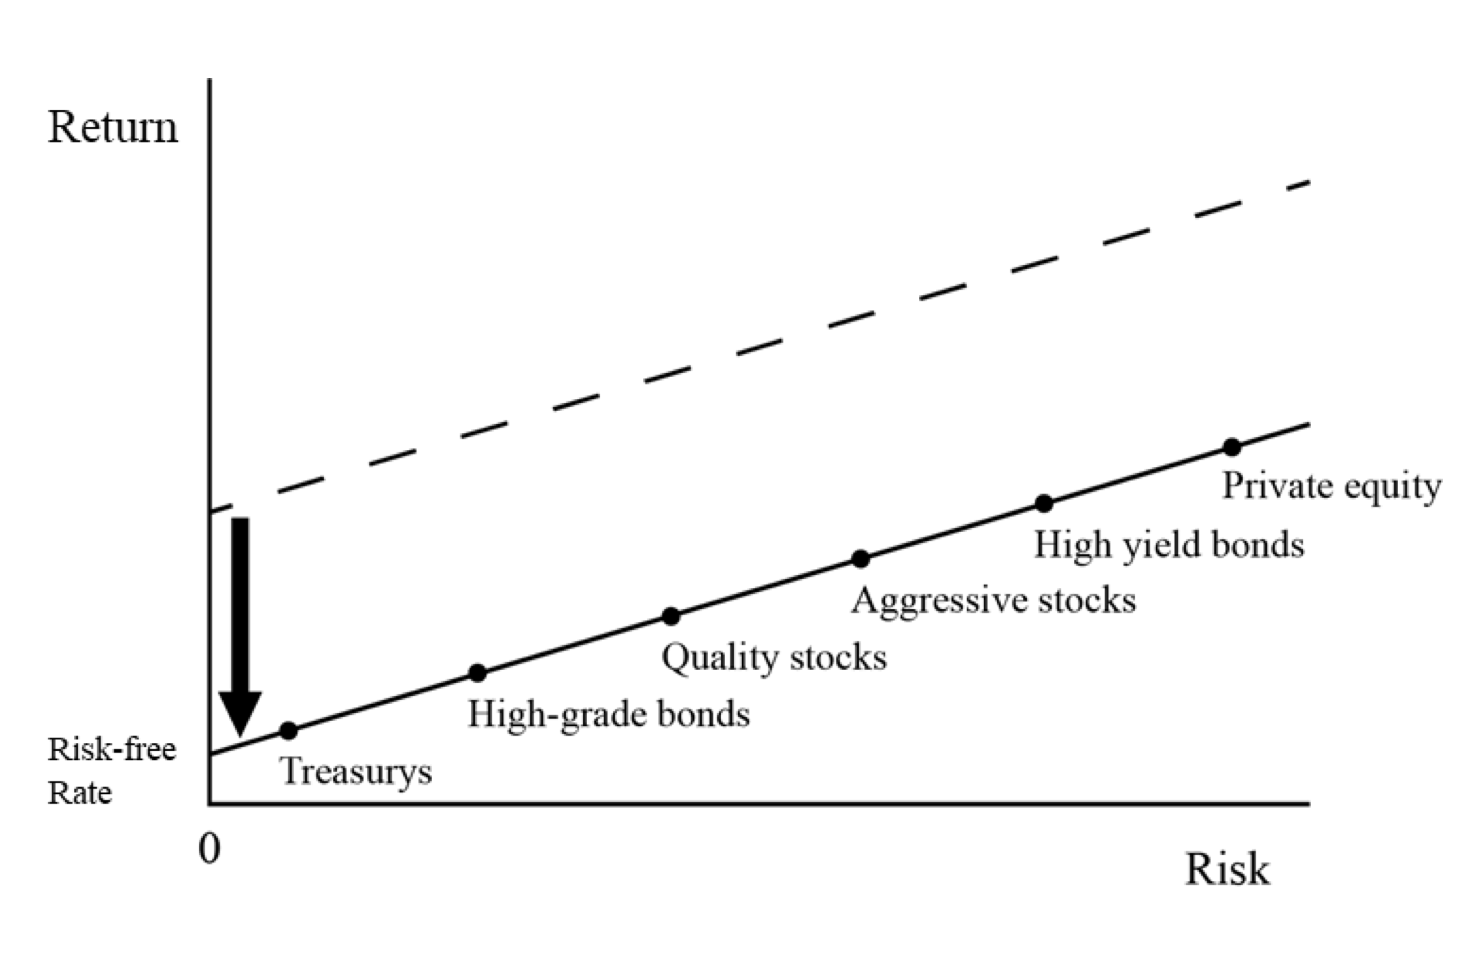
The relative risk and return relationship still makes sense. But absolute returns have fallen.
For example, forward prospective return of stocks relative to a 10-year bond doesn’t seem unusual at just over an extra three percent annual return. But the forward return of stocks (US) – about four percent in nominal terms – are low.
The lower this line goes, the lower the returns of all financial assets.
Back in Q2 1981, the 10-year yield was about 15 percent.
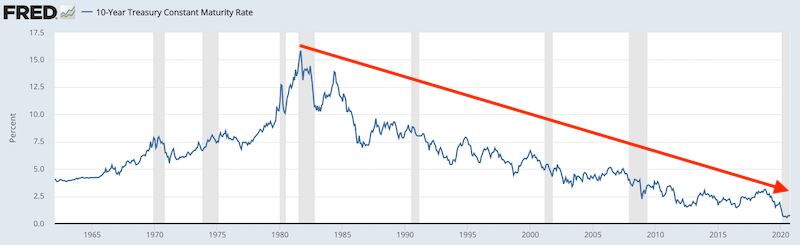
(Source: Board of Governors of the Federal Reserve System (US))
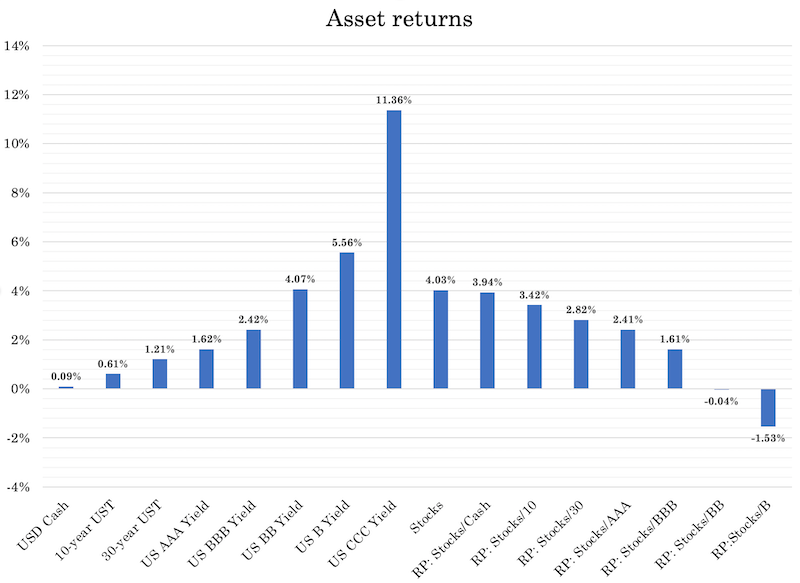
With a risk-free rate of ~15 percent, that means in order to attract capital to quality corporate bonds, the yield had to be somewhere around 16 percent. The get capital into high yield bonds, returns had to be around 18 percent.
And because high yield bonds were not yet well accepted as an asset class by that point, even 18 percent yields on those assets didn’t do the trick.
Moreover, investment managers didn’t need to take that kind of risk back then to reach their nominal return goals.
But when the rate on cash is zero (or below zero in some countries) and the 10-year rate is well below one percent, then even 5 percent returns on high yield bonds are scooped up.
And more investment managers are willing to buy them on leverage – borrowing at close to free rates – in order to hit their nominal return goals.
This type of behavior would have seemed baffling back in the late 1970s and early 1980s and even well after.
However, because the risk-free rate of return is so low, the prospective return needed to attract capital in other riskier asset classes is not particularly high. This, in turn, bids up their prices.
So we know that the lower the rate at the front of the yield curve (cash), the lower other bond yields will go as well.
That means bonds with higher interest rates will appreciate in price as market participants make choices on a relative basis.
The implications for value investing
This also has important implications for the value investing crowd. Stocks and other risk assets don’t have to be cheap – i.e., have compelling forward yields – in order to attractive capital inflows.
They will appreciate in price as well.
This also means if the higher quality assets get bid up in price (reducing their forward yields), then lower quality assets will also see higher prices and falling returns because they look inexpensive relative to the higher quality assets.
Most decisions made by investors are not made based on absolute returns but based on relative decisions.
For example, let’s say you’re in an investment world where you have the following menu of options:
- Cash: 0 percent returns; no annualized volatility
- Safe government bonds: 1 percent returns; 4 percent volatility
- Quality corporate bonds: 2.5 percent returns; 10 percent volatility
- Stocks: 4 percent returns; 16 percent volatility
- High yield bonds: 5 percent returns; 20 percent volatility
- Private equity: 7 percent returns; 28 percent volatility
Looking at what you have available, you can see that it’s hard to get much more than mid-single digit returns for the type of portfolio that you’re looking for.
You can work on balancing your portfolio among different asset classes (including things that don’t carry traditional yield, like gold, precious metals, and commodities) to get higher returns per unit of risk.
And you can use leverage to increase your returns, but amplify your risk in the process.
So while it would be nice to get 15-20 percent annualized returns at reasonable risk like you could have in the early 1980s, that environment is gone.
You can’t hang out in a pile of cash earning you no return for every day that goes by.
Eventually you need to put that cash into use to earn a higher return one way or another. A low return environment may not be appetizing, but it’s how things are.
This means you can’t make decisions based on absolute returns that may not be there. You have to make decisions in relative or comparative terms.
Accordingly, market participants are looking to find the best opportunities to achieve the highest risk-adjusted return possible. So, much of this process is going to be run on an “in comparison” basis.
Your thinking process might go something like:
“I’m considering buying Asset A, but how does it compare on a risk/reward basis to Asset B?”
If Asset A doesn’t provide much in return, then Asset B doesn’t have to provide as much in order to be the more attractive investment.
Moreover, if Asset A offers less return, the way it get there is by seeing its price rise and future returns decrease (or it earns less).
So while value investing isn’t bad in theory, many decisions are made based on comparative analysis and not whether they are cheap or provide a certain level of absolute return on their own.
This is why all investments and asset classes are always competing with each other. The same is true for countries, currencies, and financial and non-financial stores of wealth.
When investors concentrate their capital in one particular asset class in one particular country in one particular currency, they might think it’s diversified if it has a bunch of different securities in it (e.g., various stocks).
But they’re actually making a concentrated bet. Even if a portfolio is 60 percent stocks and 40 percent bonds, like a standard approach, it’s poorly diversified since equities are more volatile than bonds. A 60/40 portfolio is more like a 90/10 portfolio in terms of the comparative risk allocation to each.
While a big decline in the equity markets might seem like a lot of wealth is being destroyed, a lot of it is simply being shifted into other forms of wealth in different asset classes, countries, currencies, and other stores of wealth.
Everything is constantly seeking a new equilibrium.
This is why diversification and achieving a risk-neutral position in a portfolio is important for helping to improve one’s return to risk ratio.
IV) When required returns falls, valuations rise
During the 2009-2020 expansion and bull market in the US, Treasury bond yields topped out at just over 3 percent.
Adding a three percent risk premium for equities, that means investors expected a return of about 6 percent.
This 6 percent represents its earnings yield, or the percentage of the price that is paid out in relation to their price.
Earnings to price is the inverse of the price-earnings ratio (P/E ratio).
An earnings yield of six percent equals a P/E ratio of 100/6, or 16.7x.
This is a typical P/E for US stocks historically.
Now if the rate on Treasury bonds goes down to 0 to 1 percent while maintaining the same risk premium, that turns into a 3 to 4 percent earnings yield for stocks.
Flipping that over to get the P/E ratio, that’s now 25x to 33x, appreciably more expensive.
Moreover, since the earnings of companies generally grow over time while the coupon payments on bonds don’t, one could say that the returns on stocks could be even lower, further increasing P/E ratios.
While most people would look at a 3-4 percent earnings yield as unattractive, they might figure that companies who are going to be growing a lot more in the future are better investments as they have a better shot at validating their prices.
The chart below shows the relative performance of the tech-heavy NASDAQ versus the S&P 500 (more mature companies).
NASDAQ (QQQ) / S&P 500 (SPY) – March 2020 – October 2020
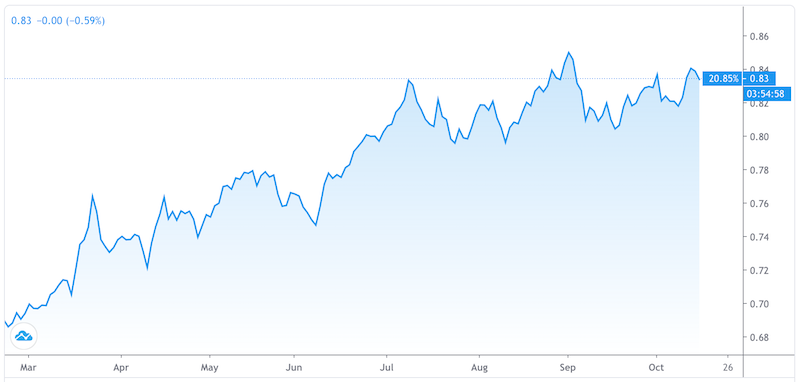
The fast growers have longer durations, meaning their anticipated cash flows are further out in the future.
The slow growers with the higher earnings yields today have more of their cash flows in the present and are shorter duration in nature.
V) Long-term interest rates can be further lowered by the central bank buying fixed income securities
Low / zero interest rates is typically meant to be low / zero interest rates at just the front end of the curve. But since 2009 (in the US) it has also meant interest rate adjustments to durations further out on the curve.
The Federal Reserve can buy bonds and other fixed income securities of longer duration. It can also buy corporate credit, ETFs, and other forms of collateral as needed to save entities it considers important.
When the Fed buys securities, the prices of those securities increase and their yields and expected yields go down.
Accordingly, when those yields go down, other assets look more attractive by comparison.
When a trader or investor sees the price of his bond go up to a satisfactory level such that he’d consider selling it, he receives cash in return. If the central bank is on the other side of the trade (i.e., the buyer), then the investor is essentially taking money that the central bank created.
Then they typically want to buy something else that’s similar in characteristic to the thing they just owned.
So they’ll likely buy a bond of a slightly longer duration or something with a bit more credit risk that provides higher compensation relative to the extra risk.
This process goes on and on gradually reducing yields all along the curve as illustrated earlier.
Other assets can more easily attract capital without offering as much return as they formerly did. So, their prices tend to rise.
The money goes into the financial system – i.e., the counterparty who sold the bond to them – which is typically used for:
– buying a similar asset/reinvested
– spent in the economy, or
– saved (i.e., cash reserves)
At the most basic level, you have three sources of funds in an economy:
– money (what payments are settled with)
– credit (promises to pay)
– income
And you have three basic uses of funds:
– spending
– savings (also commonly called reserves or cash reserves)
– purchases of financial assets
They balance in the following equation:
M + C + I = S + R + F
(Money) (Credit) (Income) (Spending) (Reserves) (Financial assets)
So, if M increases and the compression in longer term yields also boosts C (credit creation), then that’s going to have an upward push on the other side.
QE works through the financial system, so that’s going to end up mostly in financial assets and reserves.
From the middle of March to the middle of June 2020, the Fed bought a range of Treasury bonds and other government-backed securities. This came to around $3.0 trillion.
Federal Reserve balance sheet: Security assets
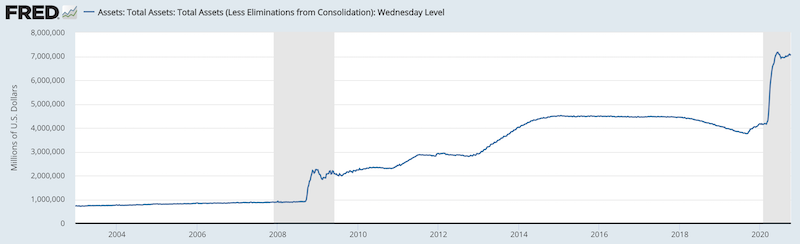
(Source: Board of Governors of the Federal Reserve System (US))
Over that three-month span, that was more than the Fed bought during the financial crisis from March 2009 (official launch of the first round of quantitative easing) to the official end of QE (after the third official program) in late 2014.
VI) Low interest rates and low returns support reaching for yield that’s not commensurate with the risks
Low / zero interest rates encourage higher than normal risk tolerance. Investors are essentially faced with the reality that returns going forward will be lower.
This might force some investors to reach for yield, knowing they still have a certain amount they want or need to make each year.
For example, pension funds often need to hit at least 7 percent annualized returns in order to make due on their obligations long-term.
Yet if equities – the riskiest public asset class – are only going them 4 percent, then they have a problem.
They can go into alternative investments, like private equity, real estate, hedge funds, and/or venture capital, or use leverage on a limited basis. But this entails more risk.
People who got more return in the past may extrapolate what they’ve gotten in the past and assume they’ll get the same.
For instance, it’s common for people to assert that stocks have historically returned X percent per year under the assumption that they’re likely to continue to get those types of returns without looking at the fundamentals of why those returns transpired in the first place.
Those large (relative to now) annualized returns came as a function of:
- higher productivity rates
- higher inflation
- higher labor force population growth (including more women entering the labor force), and
- a large interest rate tailwind over the past several decades, with 10-year bond rates coming down from 15 percent down to around zero percent
The 10+ percent annualized returns of US equities since the early 1970s also came in conjunction with cash rates near 5 percent and 10-year bond yields of over 7 percent.
Portfolio Assets (returns from 1972 to the present)
| Name | |||||||||||||||||||||||||||CAGR | ||||||||||Stdev | Best Year | Worst Year | Max. Drawdown | Sharpe Ratio |
|---|
| US Stock Market | 10.39% | 15.60% | 37.82% | -37.04% | -50.89% | 0.42 | ||
| 10-year Treasury | 7.21% | 8.03% | 39.57% | -10.17% | -15.76% | 0.34 | ||
| Cash | 4.69% | 1.01% | 15.29% | 0.03% | 0.00% |
Extrapolations of the good times continuing are not likely given all those factors are out of gas relative to what they once were.
Inflation may materialize, but that simply brings up nominal returns, not the real returns that convey greater spending power going forward.
Inflation also brings the risk that interest rates may need to eventually go higher and re-rate asset prices from their current very high levels.
To try and get these same types of returns, people will attempt to get into progressively riskier asset classes and/or use leverage on top of already leveraged investments (companies have debt and private equity uses leverage to enhance returns).
Many institutional investors are essentially stuck with a certain return target that they need to hit. This is the case for endowments and foundations.
For pension funds with defined benefits plans, they are essentially the same way. What kind of returns they need is effectively determined through actuarial assumptions about the future.
To offset the lower returns going forward, this will entail some combination of lower support for the causes they represent (e.g., charities, university endowments, foundations). And pension plans that will need to come up with more funding to keep benefits flowing as expected.
When each general asset class is yielding less than the total return target for an institutional fund (zero on cash to about 4-6 percent on equities and equity-like investments), an investor needing 7 percent isn’t going to find anything particularly attractive.
The general strategy these funds will move toward is to take on the higher returns that these riskier asset classes have gotten in the past (and can over mid-term durations) up to a level of volatility they can tolerate. Then they’ll throw in some other assets for the remainder (mostly bonds).
As a result, risk aversion becomes challenging. Risk taking becomes a sort of default option due to the notion that “there is no alternative”.
One could just accept lower promised returns. But most choose to go the risk-taking route with no other real option perceived to be available.
This means the riskier asset classes become crowded.
The best growth companies (e.g., Apple, Google, Amazon, Microsoft, Facebook) see their stocks appreciate. Though excellent companies fundamentally, their prices get bid up to a point where their returns bake in a lot of extra growth and cash flow going forward that are beyond even their currently high standards.
This level of concentration is not a great strategy for seeking out the best risk-adjusted returns.
Fear of missing out (FOMO) takes over from the healthy fear of losing money, even though losses are very hard to recover from when they’re sufficiently deep.
Historical “TINA”
“There is no alternative” (TINA) in financial markets (i.e., only risk assets have yield) seems unique because it’s a recent development, but it’s happened over and over again throughout history and in different societies.
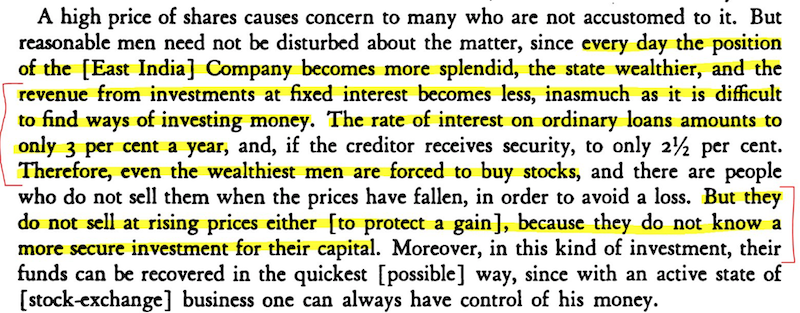
The book “Confusion de Confusiones” covers this effect in 1688 when the Dutch East India Company was the most powerful international conglomerate.
“Interest on ordinary loans amounts to… only [2.5 percent] per year. Therefore, even the wealthiest men are forced to buy stocks… and do not sell at rising prices either, because they do not know a more secure investment for their capital.”
VII) Lower or zero interest rates return markets to more normal functioning
During the early stage of a credit crunch or liquidity crisis that sees the steepest drops in asset prices, the money coming in to debtors through their incomes and borrowing is not adequate to meet the obligations to their creditors.
Assets have to be sold to meet them, and expenditures are cut in order to conserve cash. People lose their jobs and incomes dry up, which causes spending to drop, in a self-perpetuating way.
Asset prices fall as corporate earnings are set to drop. This reduces the value of collateral and new borrowing. Less borrowing leads to less spending. This spending is somebody else’s income, so incomes drop as well.
Accordingly, the issue from asset prices falling is not just about wealth (i.e., financial assets being promises to pay money in the future), but there is also the feed-through into incomes.
The creditworthiness of borrowers is measured as a function of the net worths and credit ratios (value of assets, income, and collateral in relation to their debts) and the sizes of their income in relation to the size of their debt service obligations.
When their net worths and incomes fall faster than their debts, borrowers become less creditworthy.
As a result, lenders are less inclined to lend, which leads to less borrowing, less income, less spending, lower asset prices, lower collateral values, less creditworthiness, and so on, which goes on in a self-reinforcing way.
Accordingly, the so-called credit window closes on many borrowers because the entities that can normally afford to lend are suffering losses on their assets and are highly uncertain about the future economic environment.
New financing dries up and capital is not available – sometimes even to companies that are run conservatively financially and for projects with high promising returns.
Consequently, risk asset prices decline, which causes risk-adjusted returns to rise.
When nominal interest rates can’t be lowered because they’re already at zero or slightly negative, this is where the government steps in as the lender of last resort and effectively has to reassure investors that they will come to the rescue and save the system.
They will effectively guarantee that ample amounts of money will be made available to various companies and players in the economy and that they can rely on a quick recovery.
Usually, this support is not promised fast enough, which causes painful losses before this support is given.
In most financial crises, the actions of certain entities contribute to the crisis and the public and policymakers want them to have to bear the consequences of their choices.
However, once it becomes clear that the cost of not providing support is greater than the cost of providing it, policymakers inevitably come in to do everything they can to rectify the situation.
Investors can begin to see light at the end of the tunnel that capital markets will recover, as will lending activity and the overall economy.
Low interest rates enable sources of lending to provide ample amounts of financing.
After the2008 financial crisis, lots of credit became available.
Bond issuance picked up markedly, as did special lending and liquidity programs.
Despite Q2 2020 being the largest quarterly drop in GDP in recorded history and forced some pockets of the capital markets to close for some time, nearly half a trillion dollars of high yield bonds were issued in the US alone in 2020, eclipsing the previous record in 2012.
The low interest rates made even some of the lowest investment returns look like good deals in comparison.
Nonetheless, there comes a point where assets start providing returns that are at levels where they don’t make a lot of sense to hold in appreciable proportions.
For example, if equities were likely to generate 3-4 percent annualized long-term, would it make sense to have a portfolio with the bulk of the money invested in them?
That’s a lot of risk for not much return. Investing at very expensive levels might mean many years, if not decades, underwater should there be a move back in the other direction.
The markets are held together by very low / zero interest rates across the board. But even with central banks signaling that they’ll remain low for many years into the future, is that reliable? The distribution of outcomes with respect to inflation in very large, with a lot of monetary stimulus and proportions of the supply side of the economy likely to be reduced over years (e.g., services that rely on public gatherings).
Inflation can pick up. How high would policymakers let inflation increase before they have to raise rates to cool it down?
During World War II, the Fed promised very low rates (0.375-2.5 percent) to help finance war spending as part of their yield curve control program. But inflation eventually hit double digits.
It won’t take a lot to cool down inflation given all the debt. But raising interest rates even by a mild 100bps increases debt servicing substantially when debt to income ratios are as high as they are now.
It took nearly 16 years for the NASDAQ to recover after the popping of its bubble in March 2000.
NASDAQ: 1999 to 2020
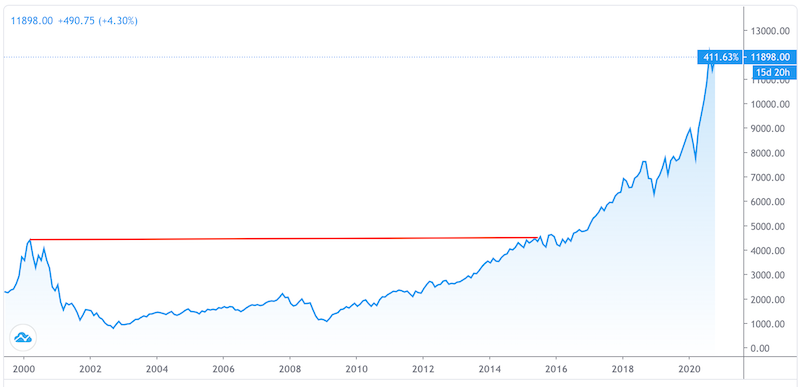
(Source: Trading View)
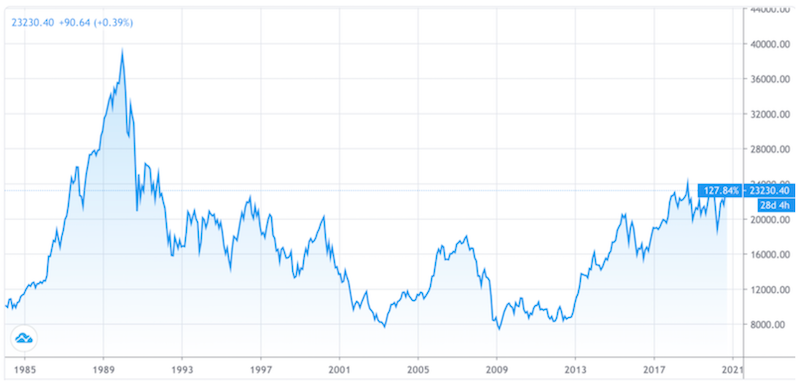
Japan’s stock market never recovered when it was peaked in 1989.
Nikkei 225 Chart, 1984 to the present
While asset prices seem relatively fair in relation to each other in terms of historical risk premiums between and among them, the absolute returns on everything are just about the lowest they’ve ever been in history.
Conclusion
Low or zero interest rates help financial markets and economies in several ways:
i) The most commonly thought of influence is the immediate stimulative effect these low borrowing rates provide. Cutting interest rates makes borrowing and financing more palatable, helping to incentivize more transactions to take place.
ii) There’s the influence on discounted present values. The value of a business is the amount of money that it earns over its lifetime discounted back to the present at a required rate of return. If that rate is lower, the present values (i.e., prices) of financial assets increases.
iii) A lower risk-free rate bring down the returns demanded on all investments across the spectrum. If the rate of return on cash or bonds decreases, then the extra relative return provided by riskier assets looks more attractive by comparison. This causes market participants to move into those assets, bidding up their prices and lowering their forward returns.
iv) When required returns drop, valuations rise. Lowering the rate on cash by one percent is likely to increase the prices of other assets by a commensurate amount if they are to retain their risk premiums between each other. Valuations rise across the board when interest rates decline, holding all else equal.
v) The central bank not only influences short-term interest rates but longer-term interest rates as well. The central bank can purchase longer term fixed income securities to get those yields to drop and provide more stimulus to markets and the broader economy.
vi) Low interest rates and the corresponding low returns incentivize all sorts of market players to take on greater risks. Some investors extrapolate the past and assume what they used to earn on their assets will continue in the future even when their forward returns are now lower simply for the fact that their prices went up. When investors need a certain level of return, it encourages a certain level of risk tolerance. The general fear of taking on larger risks declines.
vii) Low or zero interest rates can help get market back to a level of functioning where there’s plenty of liquidity in the system and volatility declines. This type of environment makes investors more willing to take on risk as the yield looks more attractive when there is less price movement and seemingly less need to worry about mark-to-market losses.