Continued US outperformance should not be extrapolated


This article was published on February 6, 2020.
Traders rarely talk about diversification. Part of it is normal in the sense that some specialize in a particular asset class and are prone to the whims of whatever behavior that asset class exhibits and how they’re positioned within it. But for the most part, traders have a natural behavioral bias to favor whatever assets have done well in the very recent past.
Whether that’s tech stocks (1998-99), housing (2003-2007), gold (1970s), bitcoin and cryptocurrency (2017), Tesla (2019-20), many things receive widespread buying interest simply because of the fact that they’ve recently gone up. That also means they’re probably worse investments, not better ones. When assets go up, this lowers their forward returns.
Having confidence in buying stocks follows the same bias now that we’re in a decade-plus bull market run in equities. Because portfolios heavily concentrated in stocks have done so well, the importance of balancing your bets in a quality way has taken a backseat.
When stocks have routinely outperformed, the idea of having a portfolio not centered around positive economic growth (stocks and other risk assets) seems pointless to most traders.
The thinking goes, why have a balanced portfolio when you can pile into risk and have it work?
It hasn’t been smooth the entire way.
There was a flash crash in 2010, “double dip” recession fears in 2011, the Greek debt crisis and potential spillover effects in 2012, the China devaluation and stock market correction in 2015, the massive drop in oil and earnings recession in 2015-16, the over-tightening of monetary policy causing a 20 percent drop in late 2018, and “trade war” related price drops and volatility.
But all of these episodes have faded and markets kept ramping higher. Given global central banks have successfully kept nominal interest rates below nominal growth rates – through direct short-term interest rate adjustment and asset buying to decrease yields further out on the yield curve – the environment for risk assets has been favorable.
But that always won’t be the case. Even if the Federal Reserve and other central banks are sensitive to asset prices and will take measures to keep them healthy, there will at one point be another material market drop.
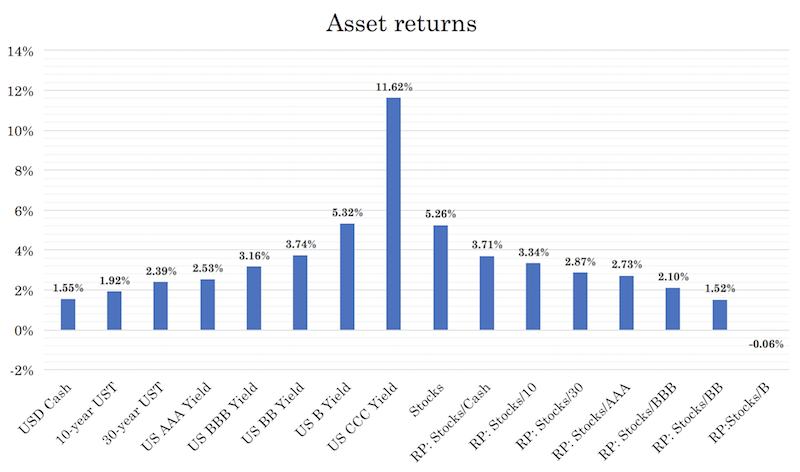
Returns have already compressed down to an expected long-run return of about 5.2 percent annualized long-term.
The relative valuations are what they are, with premiums (i.e., excess returns) fairly low relative to cash and other safe assets historically.
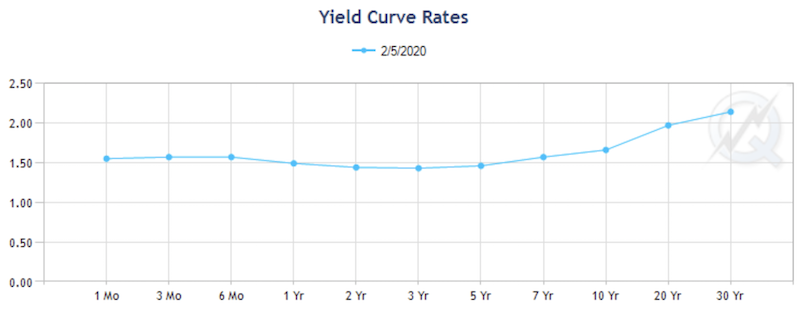
The shape of the yield curve provides a clue as to how much capacity is left for equities to make a run before rates become a problem. Not just the spot rates of the Treasury curve, but in short-term rates curves, such as fed funds and the eurodollar, which shed light on the forward expectations of monetary policy.
Rates are no longer a tailwind to equities. The fed funds curve (below) and eurodollar curve is inverted all the way out (at least through the next six years in the latter).
That means equities will be reliant on earnings growth. When there is no room left in the curve, that’s an indication that equity markets are relatively fully priced.
In terms of the present value effect, the US has 155bps of room in the front end of its yield curve and some 200bps at the very back end. A parallel compression of 150bps would provide a ~29 percent boost to equities holding all else equal.
However, to get that type of rate cut you’re probably going to need a material drop in aggregate demand, which will hit equities from an earnings standpoint.
Over a longer time horizon, the US market isn’t as out of juice on the rates front like those in developed Europe and Japan. But the capacity for central banks to use traditional measures like lowering interest rates and asset buying are much more limited than they were in the past.
The dangers of extrapolating the past
Where many traders get into trouble is that they tend to overemphasize assets that have done well in the very recent past. When stocks go up, they assume that it’s a better investment, rather than a more expensive one.
In reality, when asset prices go up, some of that price is simply pulling forward future returns.
Based on current pricings, it is more likely than not that the US equity markets will lag those of other countries this decade. While the US was the leading stock market of the 2010s because of the aggressive actions of its central bank to boost liquidity in the private sector, that’s quite unlikely to be true for the 2020s.
At the same time, we wouldn’t bet on the main reserve currency regions (Europe or Japan) taking over that role either with interest rate policy and asset buying already largely exhausted in those economies.
Going global and seeking non-financial stores of wealth
Instead, we think that to get the most out of your portfolio going forward, you will have to be increasingly global with your allocation.
When the yield on financial assets becomes unacceptably low, non-financial stores of wealth pick up in popularity. Historically gold has been a popular reserve, though is by no means perfect.
The main three reserve currencies – US, EU, Japan – are all at around 0 percent. Their bond markets are all at around 0 percent as well, and equities don’t reflect much of an extra premium in relation to their risk.
Then you have interminable balance of payments deficits and the inability to meet long-term debt and non-debt obligations like pensions and healthcare. While the EU and Japan have trade surpluses, they’re in the same boat fiscally. The US has both a trade deficit and fiscal deficit.
So, that means having to sell a lot of bonds to finance those funding gaps. Yet those bonds won’t yield much. Any excess supply the Federal Reserve (and other central banks) will need to buy. This means having to print dollars, essentially exchanging one IOU for another.
So, this tends to increase the demand for something like gold. It operates like the inverse of money. More currency and reserves in circulation is likely to push up its price. Plus, it’s a hedge on geopolitical risk. Gold and other types of non-financial stores of wealth (i.e., commodities) serve a purpose and have value in a portfolio. But they shouldn’t be overemphasized, so they aren’t the best investments over time.
Country-based equity returns: decade by decade
The table below gives different countries’ respective stock market returns for each decade since the 1900s.
The general takeaway from this series is that a stock market that performs very well in one decade often underperforms in the next. No single country has consistently outperformed. Though the US is the largest economy in the world, financial markets always price in forward-looking expectations. Prices are not whether developments are “good” or “bad”, but whether they’re good or bad relative to what’s already priced in.
And that’s a big part of what makes markets difficult. It’s pretty straightforward to predict which countries or which companies are going to do well and which are going to do poorly. But it’s hard to convert this knowledge into winning bets because of how what’s known is already discounted within the price, especially in relation to the amount of information that isn’t known and can’t be known.
Over the past four decades, the US has consistently flipped back and forth in outperformance and underperformance. During the 1980s, the US was a poor performer, among the worst. In the 1990s, the rise of the internet made it one of the better performers. Valuations got very far ahead of themselves and created a bubble, and US stock prices went down in three consecutive years from 2000 to 2002.
Then the next craze was housing because people extrapolated the past century’s data that housing was a consistently decent to great investment. Lending and leveraging practices got out of hand and that led to a massive bust in 2008. The boom that came out of that from lowering interest rates and central bank asset buying created the huge outperformance of US stocks in the 2010s.
We’ll start from the 2010s and work our way backward. These returns are excess returns (hedged back into USD) relative to a equal weighted global index:

2010s
In the 2010s, the US was the top performer largely due to the Fed’s post-recession response to cut rates to zero and stimulate the economy through the financial markets through large-scale asset buying.
Developed markets as a whole did well, including Japan and developed Europe.
However, Canada and Australia, which were broadly not impacted by the housing- and banking-related crisis, underperformed the global index. This is largely because they didn’t enjoy the same type of response from their central banks, which are the most influential actors in providing liquidity to the private sector. That’s why it’s important to understand the main equilibrium points that markets and economies are continually fighting for and what policymakers are likely to do in light of them.
It also illustrates why the stock market is not the economy. You can have a sluggish economy and a strong stock market (like the US, developed Europe, and Japan in the 2010s) and a stably growing or even booming economy and a weak stock market (like Australia over the same period).
Keeping rates low and buying financial assets will help create wealth within the financial markets, but it can also lead to wealth being concentrated in those who own the assets and not funnel down into much spending in the real economy. It also doesn’t get at the things that matter most in the long-run, like productivity.
2000s
In the 2000s, markets were impacted by the top of the tech bubble in March 2000 and later on in the decade by the financial crisis.
China’s market performed best as its economy grew in influence at the global level, but no market did particularly well in relative or absolute terms.
1990s
The US began the decade in a recession (caused by excess speculation in commercial real estate and high yield debt). After that, and despite a tough trading environment in 1994, particularly in fixed income, the US equities market roared through the end of the decade.
There were big hiccups in the latter part of the decade – the balance of payments crises in emerging Asian countries in 1997, the Long-Term Capital Management default in 1998, the Russian default crisis – but equities shrugged it off. The US market outperformed the equal weight benchmark by 217 percent, second only to “safe haven” Switzerland.
1980s
The US market performed well in absolute terms during the 1980s but lagged the equal weight benchmark.
The start of the decade began with a recession due to the quest to break the country’s very high inflation rate. After that, starting in Q2 1981, the US financial markets began benefiting from the tailwind from successively lower interest rates. Four decades later, the market is still enjoying these effects. Each cyclical peak and trough in interest rates each business cycle has been lower than the one preceding it.
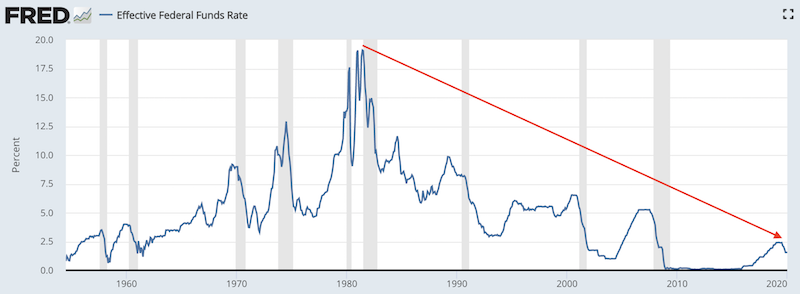
(Source: Board of Governors of the Federal Reserve System (US))
The decade was interrupted by a ~25 percent drop in the stock market in one day in 1987, but the market recovered relatively quickly.
This decade saw a wide distribution in returns, with the development of Sweden and Korea (from an agrarian to services based economy) pushing their global outperformance to 503 and 354 percent, respectively. Canada was the worst performer due to tight monetary throughout the decade with interest rates hovering between 10 and 22 percent.
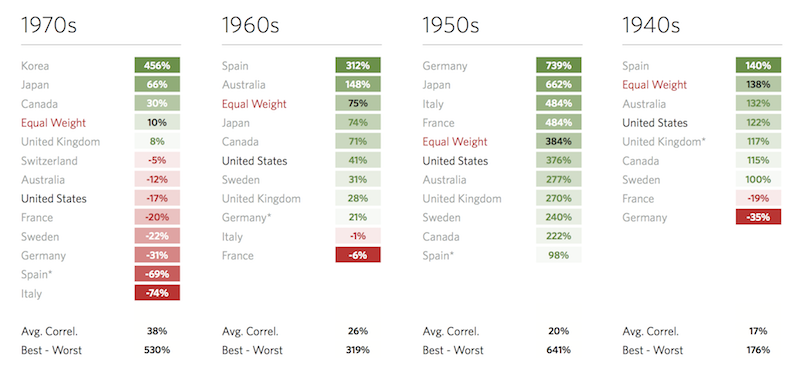
1970s
Korea was a top performer for reasons similar to the 1980s.
But the 1970s were not a great decade for global equities due to high inflation. Oil supply shocks caused economic downturns in developed markets and inflation ran high. This came with higher interest rates. Higher interest rates hit asset prices, holding all else equal, due to the way in which their future cash flows are discounted.
The US also unilaterally broke out of the Bretton Woods system, ending the convertibility of gold to dollars at a fixed price. This helped the US debt situation (so it could effectively “print money”), but higher inflation came as a consequence of this in this particular period.
Commodities and gold were the top performers. Like all asset classes, commodities tend to perform well in certain environments and very poorly in others. The 1970s were a good decade for them, while stocks and bonds fizzled.
The 1970s illustrated the importance of having a balanced portfolio. The inverse stocks/bonds portfolios would have performed only so-so, especially if adjusted for inflation. Before the 1970s, commodities were a niche part of the financial scene. Stocks and bonds had done well since the war, and due to this extrapolation, people ignored commodities, not seeing the importance in things that “don’t yield anything” (they can and do).
The poor performance of stocks and bonds in the 1970s in real terms drove the development and innovations of the modern-day commodities market (e.g., futures contracts, swaps).
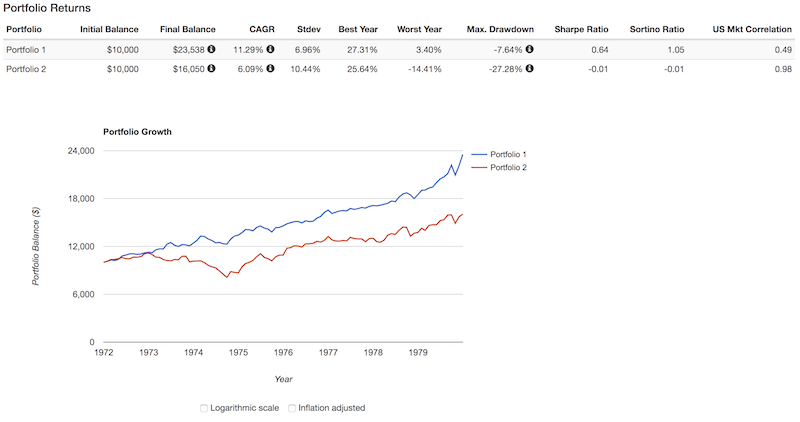
A simple diversified portfolio – 20 percent stocks, 65 percent intermediate Treasuries, 15 percent gold – earned 11.3 percent per year, had zero down years, and a maximum drawdown of just 7.6 percent. It had a Sharpe ratio (excess returns over excess risks) of 0.64 and a Sortino ratio (which emphasizes limiting drawdowns) of 1.05.
A 60 percent stocks / 40 percent bonds portfolio had three down years, a drawdown of 27.3 percent, very slightly negative Sharpe and Sortino ratios and almost a perfect correlation to the stock market (+0.98 on a scale from minus-1.00 to plus-1.00). That means it didn’t even outperform cash.
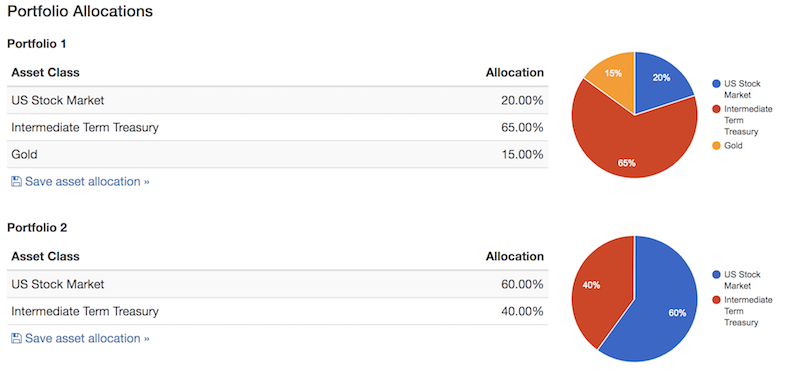
Having better balance in the portfolio would have served well. This means not having stocks dominate it, as most traders are prone to do being biased to their own country’s stock market. Stocks are more volatile than bonds, so a 60/40 portfolio is anything but a balanced portfolio despite seeming so in dollar terms. In reality, a 60/40 portfolio was really a 92/8 portfolio breaking down the risk decomposition for that decade. Adding in some gold or commodities would have been a viable diversifier that did well in that particular environment.
While commodities are not in favor these days because stocks and bonds have recently done so well, all of this goes in cycles.
Now we’re looking at an environment going forward where stocks and bonds will do low returns going forward and some forms of commodities and gold will have tailwinds as the central bank attempts to “print money” with diminishing effects. If balanced appropriately, commodities and gold certainly have value in a portfolio.
1960s
The 1960s started as a low interest rate environment, following the 1950s, and began ticking higher as the decade ended.
Spain and Australia performed best as their economies developed and the US underperformed the global benchmark. No markets performed terribly as the decade brought a lot of progress to many economies.
1950s
The 1950s benefited from a post-war boom and period of relative peace and prosperity. The US was firmly established as the global superpower emerging from World War II.
There was also a lot of continued building to do as part of the war recovery effort, which added to global GDP.
Germany, Japan, Italy, and France had a ton of rebuilding to do to help their economies recover.
An equal weight index returned a massive 384 percent. The US performed at right around this level. As a whole, it was hard to lose money investing in stocks in the 1950s as virtually all markets went up a lot.
1940s
The war period saw weaker returns amid the global uncertainty of how the world order would shake out. Germany and France, understandably, did terribly as the countries and their infrastructure were so devastated by the war.
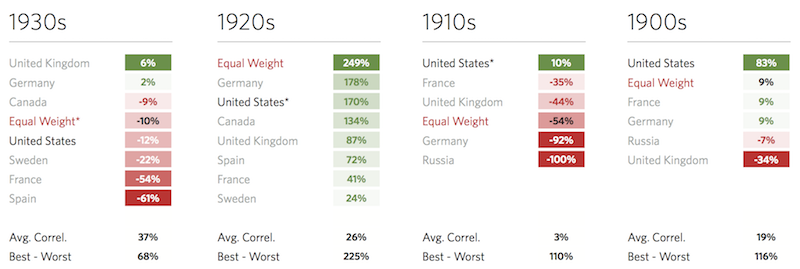
1930s
The 1930s were characterized by deep recessions throughout the most advanced economies of the time. The depression hit the United States in late 1929 and spread globally. Despite the eight bull markets (gains of 20 or more percent from peak to trough), which got people excited again, stocks eventually bottomed in July 1932 after losing 89 percent of their value. In some bad cases, equity markets can lose 95 percent or more of their value when the debt swamps the money and credit available to pay or refinance it, and residual equity value in private businesses is wiped out or close to it.
The response to the crisis by the Federal Reserve and elected officials at the time was weak and ineffective, as the contraction was so different from the ones they had experienced during their lifetimes. The 1920 recession was a standard case of Fed policy being too restrictive, not a debt crisis (too much debt relative to the ability to service it, like what they encountered in 1929).
The reasons for the 1914 and 1907 downturns were also different from the one in 1929. In certain cases, natural disasters disrupted economic activity between various parts of the economy (e.g., 1901 drought), and bank failures were common in the pre-Federal Reserve era (pre-1913).
This led to bank runs and lent more support to the idea of a central bank. In others, downturns were prompted by material declines in gold reserves, which led to fears that the government wouldn’t be able to repay its debt with sound currency, leading to a flight from banks to “risk-free” assets and/or the hoarding of gold.
The “panic of 1907” eventually led to the creation of the Federal Reserve in 1913. The US was the last major developed economy to establish a central bank due to its historical founding off skepticism of centralized power.
In 1929, the Fed was too slow to react, as it didn’t understand what it was dealing with at the time. This led to a protracted decline. While interest rates were lowered to improve debt servicing, it wasn’t enough, similar to 2008.
When the Federal Reserve began buying Treasuries in July 1932, interest rates were finally pushed well enough below nominal growth rates to help work off the debt burden, similar to the effect quantitative easing had when it was begun in March 2009 (also when stocks bottomed).
Moreover, when the Fed thought it could raise rates in 1937, the stock market lost approximately half of its value. The economy still wasn’t healthy enough – i.e., too much debt relative to income – to tolerate higher interest rates.
Because of the debt boom of the 1920s and its subsequent effects and poor management during the 1930s, the decades were polar opposites of each other.
1920s
The 1920s came with never-before-experienced prosperity for a number of different countries. People could now enjoy consumer luxuries such as the automobile, radio, commercial air travel, instant camera, television, the washing machine, and many others. The assembly line revolutionized the way products are mass produced to satisfy burgeoning demand.
Virtually all markets went up. Of course, much of this consumption was fueled by debt, and this eventually cost the markets some of its stellar gains in the final two months of the decade. Like the 1950s, this was a difficult decade to lose money in until the party finally ended.
Back in these days, stocks and bonds were all you could really trade. Commodity trading exchanges were established in the US in the 1860s, but expansion and widespread adoption didn’t begin until the 1930s. As mentioned, derivatives such as futures contracts and swaps didn’t gain traction until the 1970s.
1910s
The 1910s were marred by economic contractions and the uncertainty that came with the First World War.
The 1910-11 “panic” (as they were known in those days) stemmed from the enforcement of the Sherman Antitrust Act. During the late-19th century, the government began trying to decrease the influence of large companies, believing they had become too big and too powerful, leading to excessive pricing power that hurt consumers and other businesses. The biggest target was John D. Rockefeller’s Standard Oil Trust company. Railroads, which fed into the oil and steel monopolies of the time, were also heavily targeted and were highly influential in controlling the increasing traffic flow between the coasts due to travel and migration. This recession lasted 24 months.
War broke out in 1914, right as a recession was already in effect. This downturn would last 23 months.
The Dow Jones Industrial Average, then the most common index to gauge how the stock market was doing (and still is among mature, large cap companies), went up about 60 percent post-war in the final two years of the decade.
But it was an overall poor period for the global stock market. The US was the best among a bad set. German assets crashed following its involvement in the war, as it took on massive debt to fund the war and subsequently lost it. This left it on the hook for a massive war reparations bill.
Above all else, starting a war by going into debt and losing it is the worst thing an elected official could possibly do. This eventually resulted in hyperinflation and collapse of the Weimar Republic economy in 1923-24.
Russia’s proletariat revolution wiped out most of the wealth that had been invested in the country.
1900s
Only the “big five” at this time had reasonably developed capital markets – the US, UK, France, Germany, and Russia.
The US was the best performer during the decade, though it had its own struggles. The assassination of President William McKinley in 1901 spooked the market due to political uncertainty and a bad drought the same year impacted economic activity.
The Panic of 1907 was triggered by a failed scheme to corner the market for the stock of the United Copper Company. The ripple effect of bank insolvencies and potential insolvencies led to a broader lack of confidence in the banking system. (The Federal Reserve did not yet exist as a lender of last resort.) This led to a run on banks and trust companies. Altogether, stocks went down almost 50 percent from the previous year.
President Theodore Roosevelt also aggressively worked to bust up monopolies across several industries, with a special focus on railroads. A more stringent regulatory regime painted the picture of a more difficult future business environment.
What to make of these patterns
The regular ebb and flow, outperform to underperform pattern you see makes sense. Financial markets are discounting mechanisms. Markets tend to overshoot in one direction and overshoot in the opposite direction.
Traders tend to extrapolate what they’ve gotten accustomed to. Currently, because stock markets have gone up substantially over the past decade-plus, that’s largely what most traders expect to continue even as stocks continue to become more expensive and therefore yield forward lower returns.
This sets up people for disappointment, believing current conditions and those of the recent past will be reflective of the future. Likewise, when things are bad, traders are likely to assume that things will continue to be bad, which causes risk premiums to remain high for an extended period. People who have been burnt by investing or their prior business endeavors are more likely to remain skittish going forward.
Conditions that produce this type of continued good outcome are no longer present. Fiscal stimulus has faded and monetary policy only has another 150-200bps left under the curve. At an effective duration of 19 in US stocks, that gives only another 30-40 percent.
After that it’ll be dependent on earnings growth, which is a function of nominal economic growth. Remember that financial assets are simply claims on goods and services. If the amount of goods and services is expanding by about 4 percent per year in nominal terms, you should expect returns somewhere in that vicinity over a long period of time (depending on what you’re investing in).
Asset prices that go up well in excess of the growth in goods and services on which they’re a claim are not sustainable. Many traders look at the 10-11 percent annualized gains in stocks over the past half-century or so and assume that’s what they’re likely to get in the future. This is another form of inappropriate extrapolation. Equities returned at that level because of higher growth (a function of higher productivity and higher growth in the labor force) and higher inflation that resulted in higher nominal growth in the past.
Current pricing suggests earnings growth in the US will continue higher than in the rest of the world even when that’s not likely due to fading fiscal stimulus and limited monetary stimulus moving forward.
What will the 2020s bring?
With all that’s been squeezed out of developed market financial assets, it is more likely for developed markets to underperform relative to emerging markets. Emerging markets have higher cash rates, bond yields, and stock “yields” (as implied by forward earnings). They have more room to stimulate their markets if necessary.
By contrast, Europe and Japan have minimal ability with rates at negative, zero, or almost zero everywhere along their curves. The US isn’t far behind and could more or less be placed into the same bucket with a sovereign yield curve in the 150-200bps range. The next form of monetary policy to stimulate the economy is likely to target spenders and savers, rather than investors.
Returns in developed markets are therefore likely to be very low for a very long time.
That means more investors will need to shift globally and they’re going to need to take at least a little bit currency risk in a smart way if they wish to have higher returns over a sustained period.
When you have cash making anywhere from minus-100bps to plus-150bps in developed markets and can get 4-9 percent yields in emerging markets, that spread will inevitably attract capital inflows going from the “capital rich”, low-yielding developed markets to the “capital scarce” high-yielding emerging markets. At the same time, portfolio managers will not over-extend into emerging markets given a certain amount of balance always needs to be maintained from a risk perspective.
In trading and investing, you’re fundamentally chasing a spread, also known as a risk premium.
If you can borrow at 0 percent and put that into yields of 6.25 percent, that’s not any different from borrowing at 4.75 percent (the yield of USD cash from 1972-2020) and putting that into yields of 11 percent (the approximate return on stocks between 1972-2020). The yield differential between your assets and liabilities would be the same. Even though asset prices are high in absolute terms, they aren’t yet extremely high relative to cash, particularly if you “go global”.
Currency hedging is certainly an option, but reduces overall yield. Central banks and reserve managers cannot materially invest in emerging market assets because of their risk. Accordingly, a lot of this risk will need to be taken on by traders and institutional investors.