The US Election’s Impact on Asset Prices


Regardless of one’s thoughts on politics, the outcome of the November 2020 US election – particularly that of the presidency – will have a material impact on asset prices.
When we talked about the big three market equilibriums that economies and assets are always continually battling for – (1) economic capacity utilization being neither too high nor too low, (2) growth in income needing to be above the growth in debt servicing, and (3) stocks yielding above bonds and bonds yielding above cash and by the appropriate risk premiums – we can also include politics and geopolitics into this. The decisions that policymakers make influence how these equilibria play out.
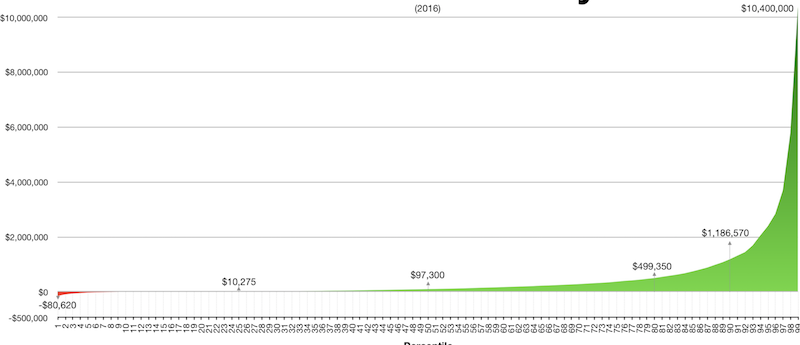
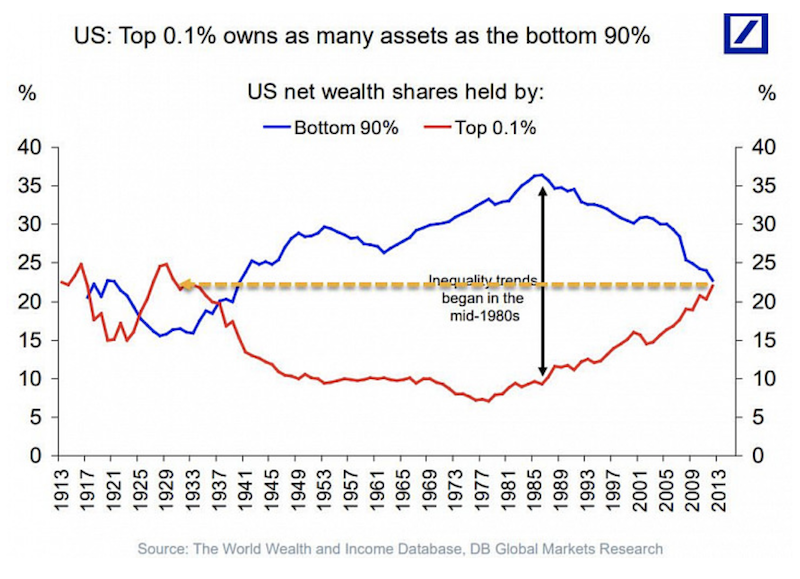
US politics are more polarized than they have been historically. This is a social phenomenon that has roots in the economic environment. We have largest wealth gap in the US since the 1930s. In terms of the distribution of asset ownership, the top 0.1 percent own as many assets as the bottom 90 percent combined.
There are various ways to map out the data to show the relationship. This shows the concentration of family wealth in the very top percentile.
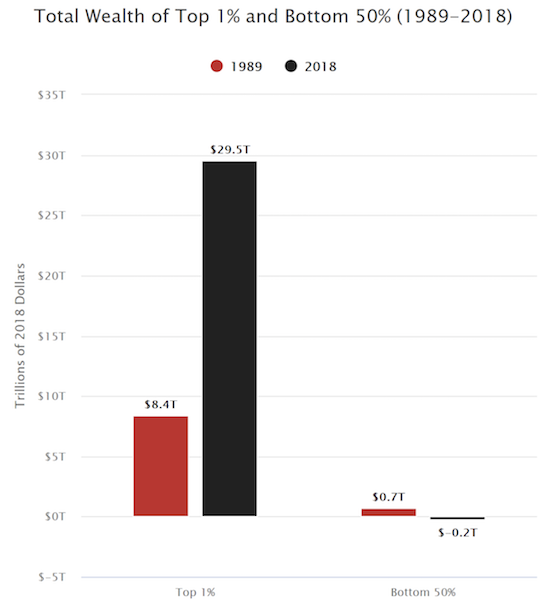
Below wealth is divided up into the top 1 percent and bottom 50 percent.
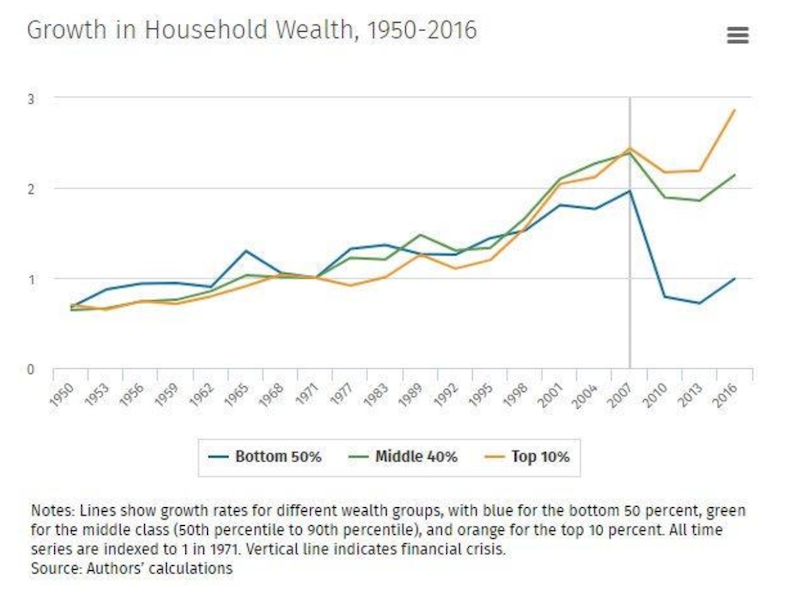
The graph below shows the change in household wealth from 1950 to 2016. We can see from 1950 to 2000 or so that wealth of the bottom 50 percent grew in line, in percentage terms, as those in the middle-40 and top-10. But as soon as the financial crisis hit in 2008, this took a big divergence where asset owners and non-asset owners saw their prospects go in opposite directions.
The top 10 percent of the population own 70 percent of all wealth, or more than twice the wealth of the bottom 90 percent combined.
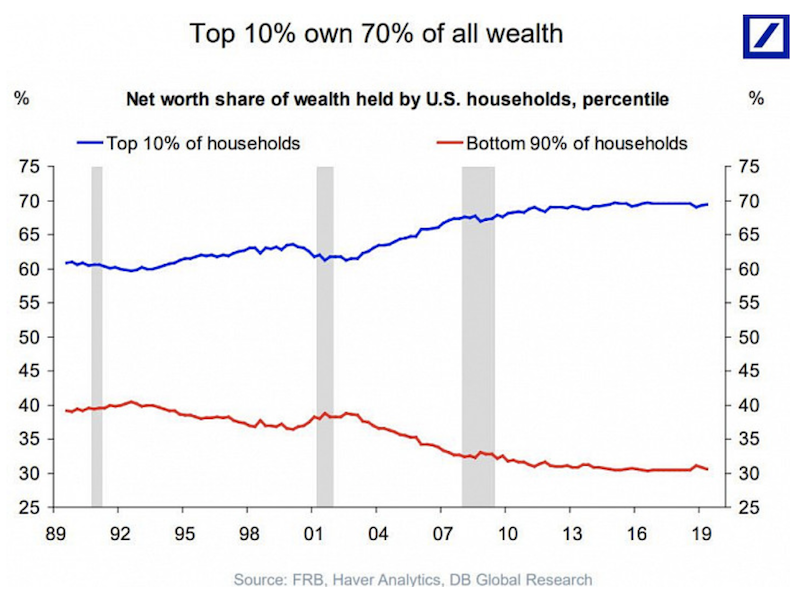
In the late 1970s, the top 0.1 percent owned about 7 percent of the overall wealth and the bottom 90 percent owned a bit more than 30 percent. Today, the top 0.1 percent own as much wealth as the bottom 90 percent.
Moreover, the share of families in debt – defined as those whose total debt exceeds their total assets – remained roughly the same between 1989 and 2007. It then increased by 50 percent between 2007 and 2013 as a result of the housing bust. Eight percent of families were in debt in 2007; on average, their debt was in excess of their assets by $20,000. By 2013, 12 percent of families were in debt, with the average debt in excess of assets of $32,000.
The reason for the rise in indebtedness between 2007 and 2013 for families in debt predominantly came from declining home equity and increasing student loan balances.
In 2007, immediately preceding the housing bust, 3 percent of families in debt had negative home equity. On average, they owed $16,000 more on their homes than they were worth. By 2013, 19 percent of families in debt had negative home equity. This average “underwater” amount on the property skewed up to $45,000.
On the student debt front, families in debt rose from 56 percent in 2007 to 64 percent in 2013. The average amount of their loan balanced increased from $29,000 to $41,000.
Causes and Implications of the Wealth Gap
Since the 2008 financial crisis, developed market central banks have purchased approximately $15 trillion of financial assets, which has boosted the wealth of those who own them (primarily wealthy people) and left behind those who don’t. These measures were necessary to stimulate the economy, but had significant distributional impacts.
Moreover, the effect of technology has altered labor markets as well. For example, in the case of labor, this has allowed people with cars to effectively rent out seats in their own vehicle to make money. This has reduced demand for traditional taxi services, representing a shift in wealth away from labor and toward capital (the investors in these services).
Rural areas have been especially hard hit with the lack of economic opportunity in rural areas in comparison to major urban centers. Trump tapped into this to successfully recruit rural working-class voters into his base during the 2016 presidential election.
The 2020 election is also an important aspect influencing financial markets at the moment.
Markets are information discounting mechanisms. They are always forward looking. The stock market is a function of economic growth, which feeds into earnings. Those future expected earnings are discounted back to the present based on corporate funding costs, which go on to determine the net present value (i.e., the prices) of a particular security or index.
Because US politics are more polarized than average, the popularity of less moderate candidates is relatively high.
As we head into 2020, the Democratic Party looks to have a relatively equitable race between Joe Biden, Pete Buttigieg, Elizabeth Warren, Bernie Sanders, and Michael Bloomberg.
Biden, Buttigieg, and Bloomberg are perceived as more moderate candidates while Warren and Sanders are considered more left-leaning and have adopted a more confrontational stance toward corporatism (i.e., higher taxes, more regulation).
When you raise taxes, companies are worth less because they retain less cash. A proper regulatory regime is good and necessary, but past a certain point regulation restricts the freedom to do business and also bakes negatively into stock prices. (Higher taxes and regulation typically benefits the prices of sovereign debt from reserve currency countries, such as US Treasuries, because of safe haven inflows.)
Traders and investors will need to calculate the prospective economic effects of each candidate winning, push those assumptions through a model of how an asset or asset class is valued (cash flows discounted back to the present), and multiply by the probability of the candidate winning to build a weighted-average of the current index’s value.
For example, the new president – Trump during his second term or one of the Democratic challengers – is likely to impact what piece of major fiscal policy legislation gets passed in 2021 or 2022. If Trump is re-elected, taxes are not likely to fall and the overall trajectory of fiscal policy is not likely to change much.
Fiscal deficits are now around 5 percent of US GDP and this type of overspending is not sustainable in the long-run. Cutting spending is not feasible in many cases since so many people depend on that income whether it be in the form of wealth transfer benefits like Social Security or for their healthcare needs (i.e., Medicare, Medicaid). The US needs more tax revenue. At the same time, increasing tax rates isn’t a simple answer because whatever rates are changed shifts incentives, produces arbitrage effects, has short-run and long-run effects, and so on, that makes the influence on revenue uptake far less than linear.
Last week, during the Greenwich Economic Forum, Paul Tudor Jones (a well-known trader who founded Tudor Investment Corporation) went through his firm’s thought process on thinking about the 2020 US presidential election:
“We did this poll internally about where the S&P would trade if Elizabeth Warren would become President, and then Biden, Buttigieg, Kobalchar, etc. And then we took the election probabilities. And so, our poll said that if Elizabeth Warren would become President, the S&P would trade around 2,250. It’s at 3,050 now. But I am just saying that her policies would probably give you something like that.
Then if you just take election probabilities, that would imply… if you anchor that, I think Buttigieg and Biden were probably 2,700 – because again, they are going to come and raise taxes and that’s going to cause some economic contraction, so that would imply that Donald Trump, if he gets re-elected, the S&P is worth 3,600.”
2,250 on the S&P 500 (SPX) would be nearly a 30 percent drop from today’s levels. An Elizabeth Warren election would not be bullish for stock prices given her policy stances on taxes and regulation, but a drop of that magnitude purely based on her election is difficult to justify. A president has a material influence on the fiscal and regulatory regime in a country, but someone wiping out 30 percent of the US stock market’s wealth is an exaggeration. Those types of drops tend to come from excessively tight credit conditions and debt problems on a macroeconomic level.
US presidents cannot pass major fiscal policy legislation unilaterally. With 100 Senators in one branch of Congress and 435 Representatives in the other, Congress is generally a fairly moderate group altogether. It’s rare that there is a massive favorable partisan skew in both chambers available to a president such that he (or she) would have a blank check to pass legislation as they see fit.
Goldman Sachs estimated that every 1 percent increase in the effective tax rate translates into roughly a 1 percent decrease in S&P 500 earnings per share.
The firm estimated that increasing the effective tax rate from 18 percent back up to 26 percent would reduce 2021 S&P 500 earnings by $21 (i.e., from 185 to 164) based on the assumption that the new prospective tax bill would apply retroactively to the start of 2021. $18 of those $21, or about 85 percent, came as a direct consequence of the higher tax rate. The other $3, or 15 percent, came from a reversal in the remaining pass-through benefits of the 2017 TCJA tax bill on changes on GDP.
Elizabeth Warren has asserted, that if elected, she would seek to roll back the 2017 tax cuts. She also has outlined a separate corporate tax plan, saying that every dollar of profit above $100 million will incur an additional 7 percent tax beyond whatever tax liability it may already have.
While Elizabeth Warren was a better than 50 percent favorite in early October 2019 to win the Democratic nomination, she has since slipped back to the middle of the pack.
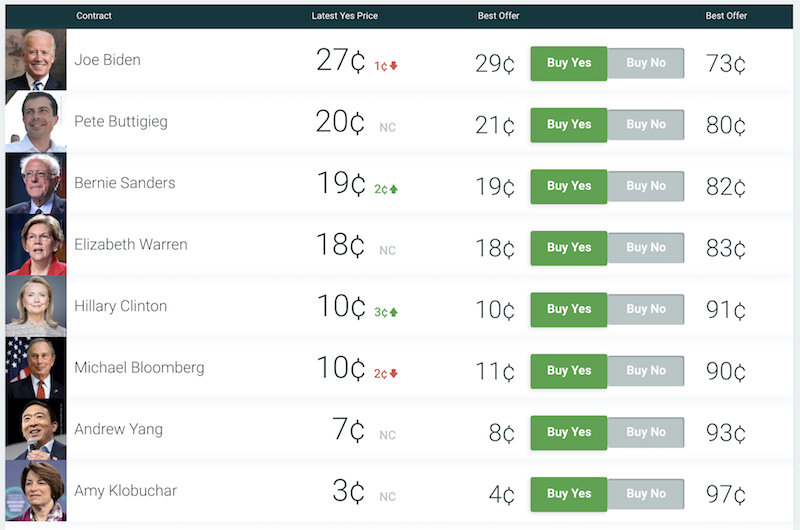
Based on current PredictIt odds, Elizabeth Warren has an 15-16 percent chance of winning the nomination. (The actual odds don’t represent the numbers shown below, as these lines have “juice” in them, or the spread added in that represents the bookmaker’s revenue.)
An 11 percent drop in earnings is likely to be somewhat offset by a fall in interest rates. There is the influence of lower expected forward nominal growth rates, which feed into nominal interest rates. A drop in interest rates lowers corporate borrowing costs. Higher federal tax revenue is also a potential incremental benefit to the US’s creditworthiness.
So, the total drop in the stock market from a prospective Warren victory is likely to be less than 10 percent in reality. She may want oversee big changes to the tax code, but that’s probably not likely due to the need to find common ground with lawmakers in Congress.
If we do this for all the candidates and multiply by their probability of getting elected we have something like the following “if elected” SPX projections based on the current value of 3,113:
Elizabeth Warren – 2,832
Joe Biden – 2,957
Pete Buttigieg – 2,941
Bernie Sanders – 2,786
Hillary Clinton – 2,998
Michael Bloomberg – 3,035
Andrew Yang – 3,004
Amy Klobuchar – 2,929
If we multiply by the probability of each candidate winning:
Warren – 2,832 x 0.158 = 447.5
Biden – 2,957 x 0.237 = 700.8
Buttigieg – 2,941 x 0.175 = 514.7
Sanders – 2,786 x 0.167 = 465.3
Clinton – 2,998 x 0.088 = 263.8
Bloomberg – 3,035 x 0.088 = 267.1
Yang – 3,004 x 0.061 = 183.2
Klobuchar – 2,929 x 0.026 = 76.2
Then we add all these numbers up. This comes to a weighted average of 2,919. In other words, if a Democratic candidate wins, the expected drop in US equities, as represented by the S&P 500 is a bit more than 6 percent. This will accrete in and out of the market as the probabilities surrounding various candidates change.
Which party will win the 2020 US presidential election?
Based on PredictIt, it gives the following bets:

We know that the Libertarian and Green Party’s chance of a victory are virtually zero in the dominant two-party US political system. 54 and 47 add up to 101, so we’ll take the midpoint by deducting half a point from each to get it to add up to 100 and thus convert to percentages.
Democrat = 53.5 percent
Republican = 46.5 percent
If we take the Democrat SPX “if elected” weighted average of 2,919 and multiply by .535, that gives us 1,562. This will be the portion we add to the parallel Republican-weighted outcome.
To find what this backs out for an SPX value if Trump is elected, or any Republican more generally (PredictIt has Trump’s odds of winning the 2020 Republican nomination at 85 percent at the time of writing), we have a basic algebra problem:
“If elected” Trump SPX Value = 1,562 + 0.465x = Current value of market
“If elected” Trump SPX Value = 1,562 + 0.465x = 3,113
0.465x = 3,113 – 1,562
0.465x = 1551
x = 1551 / 0.465
x = 3,335
So, as of right now, we might expect the S&P 500 to be worth 3,335, or an additional 7.1 percent higher than it is right now if Trump were to win re-election.
For those who trade E-mini S&P 500 futures, these extra 222 points would mean each contract is currently worth an additional $11,100.
The election will make a difference as to what stocks and other financial assets will be worth. However, all the talk about the market “crashing” or going up a ton or whatever it might be is not particularly rooted in reality based on sensible calculations.
How will other financial asset markets react to a Democrat victory or Trump re-election?
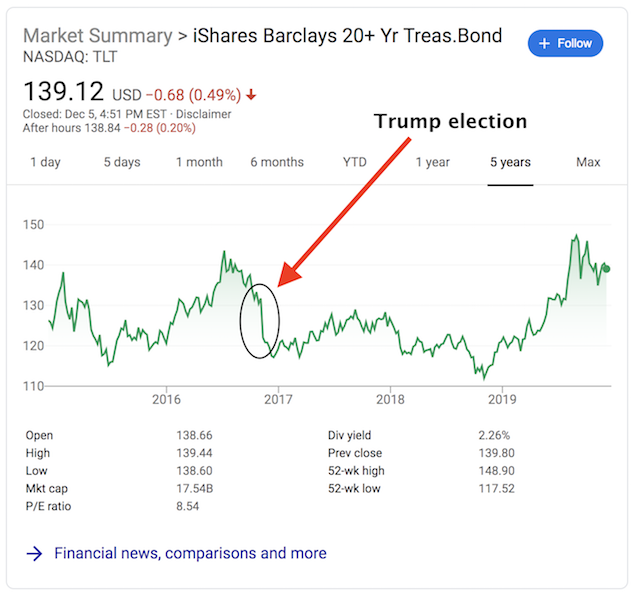
A Democrat victory would be good for the safest forms of bonds, like US Treasuries. A Trump win would be bad for bonds. We saw bond prices go down and stock prices go up when Trump was elected because the probabilities on election day had a Hillary Clinton victory about 80 percent priced in.
Below is the TLT ETF, where we saw a large fall in price of longer-duration US Treasuries after Trump was elected.
Because there was such a material re-rating in expectations, asset markets saw big moves. Up until the election, the relatively mild changes in election probabilities will accrete in slowly.
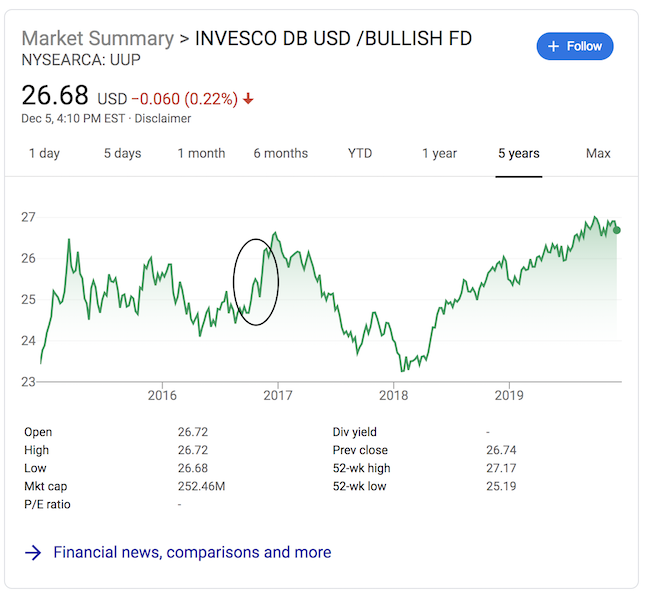
Trump is also broadly good for the dollar. Generally stronger growth is good for the dollar, especially when this is true relative to other countries. Below is UUP, a US dollar ETF.
Trump’s impact on oil prices is more muted. Stronger growth generally means higher oil, holding all else equal. But a higher dollar weighs on oil and Trump has also called on OPEC to lower oil prices, so there is no large effect.
Conclusion
While it’s common political rhetoric to say that a certain candidate is “really bad” or “really good” for markets, this is not true to the extent that the market will go up or down in a big way. This type of opining is generally a reflection of that individual’s ideological biases rather than what realistic numeric calculations might suggest.
Paul Tudor Jones asserted that his firm expects the US stock market to do very poorly if Elizabeth Warren were to win (down almost 30 percent), but this is not well-supported.
Implicitly, based on Jones’s assumption, this would suggest a Trump victory would set the S&P 500 at 3,600, or 60 percent higher than what a Warren victory would do. Realistically, this spread is probably 15-20 percent.
Elections matter for asset prices. And this election matters more than most given the polarity in policy stances, which would create a wider-than-normal disparity in the expected movements of asset prices. Politics absolutely needs to be tracked to understand what future cash flows and interest rates are likely to be, but calculations need to be done prudently.
This is also a reminder that in financial markets you are dealing with probabilities and distributions. You rarely deal with certainty. Trading is fundamentally about risk/reward and expected value, getting the relative probabilities right to come out ahead over time, and finding ways to keep the big upside while eliminating any unacceptable downside.