Commodity Carry: How to Profit Off The Strategy


Commodities are typically traded as futures. Commodity carry is a strategy involving profiting off the shape of the forward curve in addition to the additional component of the risk-free rate.
Defining carry
Carry can be broadly defined as the yield that can be expected on a trade over the next 12 months assuming no change in spot prices or valuation.
Carry, in the commodities space, is the sum of the “roll yield” and the risk-free rate.
The roll yield component is straightforward. Let’s say you go long WTI oil 12 months forward. The price on this contract is $55.80 as I write this. The spot price is $60.07.
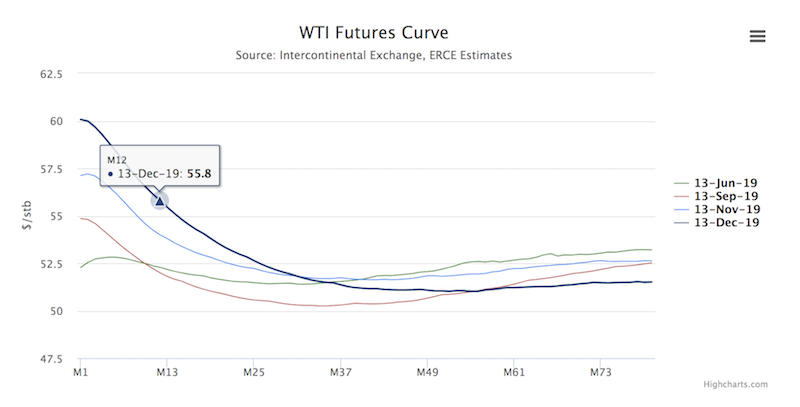
The carry is this differential, expressed as a percentage – ($60.07/$55.80 – 1 = 7.65%). That means as time goes on, the spot price is likely to converge to the forward price, generating carry for the trader. In reality, the supply and demand for oil will change in the upcoming year. So while the carry component of this trade is 7-8 percent, movement in the price of the commodity will also dictate returns above or below that level.
What is the logic for also considering the risk-free rate?
When you buy commodity futures, you only put up a small amount of collateral relative to the amount of exposure you’re getting. So, it’s logical to consider that cash you didn’t have to invest as part of your returns.
Futures investments of all kinds – rates, equities, fixed income, commodities, currencies – are only partly collateralized investments. For instance, you can buy $60,000 worth of oil for usually $4,000 to $7,000 in collateral (could be more or less depending on what else is in the portfolio). Accordingly, the trader should logically get credit for freeing up more spare cash.
Roll yield
When traders think of carry involving commodities, they typically think of just roll yield. As we covered above, this is the process by which returns are obtained on longer-term futures as the shorter-term contracts “roll” into it as they near expiration.
Commodities and futures contracts don’t involve a coupon payment or dividend as they do in the fixed income and equities markets. So naturally, when traders think about carry in commodities markets, they will tend to think of the roll yield component as the sole defining component. We mentioned how we also consider the short-term interest rate (i.e., a cash rate) as a component of carry.
Some traders take a backwardated (i.e., backward sloping) futures curve as a signal to invest in a commodity, hoping to profit off the spread between the cheaper forward contract and the prevailing spot rate as the two (perhaps) converge over time.
When trading commodities in the futures market, the current (i.e., front-month) futures contract is usually rolled to the next contract before expiration. If this is not done, then the holder of the contract will need to take physical delivery of the commodity. (Of course, this is often not doable or wanted.)
When the futures curve is upward sloping (contango), this is considered “negative roll yield”, as the current contract needs to be liquidated in order to buy a higher priced contract. When the futures curve is backward sloping (backwardation), this is considered “positive roll yield” as the contract holder can purchase a cheaper forward contract.
Precious metals tend to be structurally contango markets. This largely reflects storage costs. Buying forward contracts in contango markets means effectively paying carry.
Roll yield can be found simply by taking the futures price (F) dividing it by the spot price (S), taking it to the power of 1 over time (t), and taking the difference from one.
Roll yield = 1 – (F / S)^(1/t)
The futures price of any commodity at any given time – F(t) – is determined by the following:
F(t) = S(1 – y + c + r)^t
Where:
- S = spot price
- y = convenience yield
- c = storage cost
- r = risk-free interest rate, or cash rate
- t = time
Convenience yield is defined as the value associated with holding a commodity or physical good rather than simply owning a security or contract underlying the good.
To determine convenience yield, a trader will need to know a commodity’s spot price, future price, time to maturity, and borrow rate. Convenience yields are relatively high when storage costs are relative low. Commodity prices are also partially related to the amount of storage space available. When storage space is relatively plentiful, commodity prices will tend to move down. When storage space is relatively scarce, commodity prices will tend to move up.
Based on the above equation, we can see that when the risk-free rate is lower, the lower the difference between the futures contract and the spot price, holding all else equal. Likewise, when the risk-free rate is higher, the higher the differential between the futures contract and the spot price.
The higher the risk-free rate, a commodity’s roll yield will be lower or more negative, ceteris paribus. This is true for any uncollateralized investment.
A higher risk-free rate will also increase the yield on assets. This means the interest earned on collateral backing the commodity futures increases. When the risk-free rates goes higher and creates lower roll yields, the return on the collateral increases.
Given the linkage between the two, the risk-free rate and roll yield should ultimately work to comprise the overall concept behind commodity carry.
From this perspective, commodities can be a valuable addition to a portfolio – for long-term, buy and hold investors, in particular – to serve as an inflation hedge and source of alternative store-holds of wealth. There is an element of diversification inherent in commodities, away from equities, fixed income, and currencies.
Carry strategies throughout asset class types
Carry is a strategy that’s used in all asset classes. Some examples:
1. Stocks – Investing in dividend stocks is a common one, though equities are always expected to outperform cash, so it can apply to any type of investments in stocks. Accordingly, an equities carry strategy simply means borrowing money at a rate lower than the returns you expect to achieve in stocks.
2. Currencies – Short one currency to go long another. The Japanese yen (JPY) is a common funding currency for carry trades because of its negative rates. Traders might short JPY to go long a higher yielding currency like the South African rand (ZAR), looking to profit off the spread.
Some traders will rank currencies based on their yields. They might then take long positions on the highest yielding currencies and short the lowest yielding ones. This strategy tends to work out well when the world is growing and stable, like with stocks, and do poorly when the cycle turns.
There are also FX futures markets where the same concept of profiting off the forward shape of the yield curve applies.
3. Bonds – This often involves borrowing through the repo market. Repo involves borrowing cash and using it to fund higher yielding securities. Bonds normally yield above the rate of cash, so investors can leverage their sovereign or corporate bond exposure through the repo market.
Bond carry can also be achieved from simply being able to access the market with low margin requirements. For example, some bonds can be purchases on 2x-10x margin. If the rate the trader borrows at is lower than the yield on the bond, this would be considered a carry trade.
4. Rates – Interest rates are typically traded as futures. If someone goes short interest rates further out on the curve and said curve is backwardated (backward sloping), this represents some form of carry. If rates rise, remain steady, or don’t drop as much as what’s discounted into the curve, the trader will make money as the spot rate converges to the forward rate.
For example, if one is trading SOFR futures (green line in image below) and goes short SOFR rates two years in the future, if rates were to rise, stay the same, or drop by not as much as is priced into the curve, then you would make money.
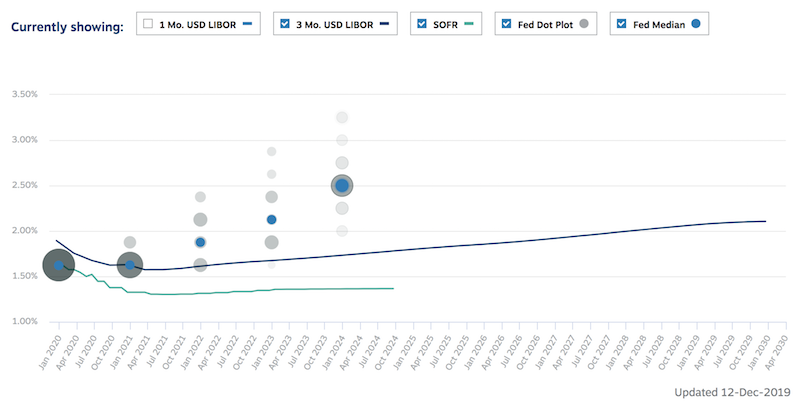
Rates contracts are typically quoted as 100 minus the current rate. For example, if the expected fed funds rate is 1.50 percent in March 2020, the price of the March 2020 contract would come to 98.50. Shorting rates means expecting rates to rise; likewise, going long rates means expecting rates to fall.
5. Commodities – As covered, the same concept from the Rates section applies to commodities.
In the case of the WTI oil market, spot prices as of mid-December 2019 are around the 60 mark. If you buy oil 36 months out, you will get it for around mid-51, or some $8.50 cheaper. (The value of each WTI oil contract is the quoted price multiplied by 1,000.)
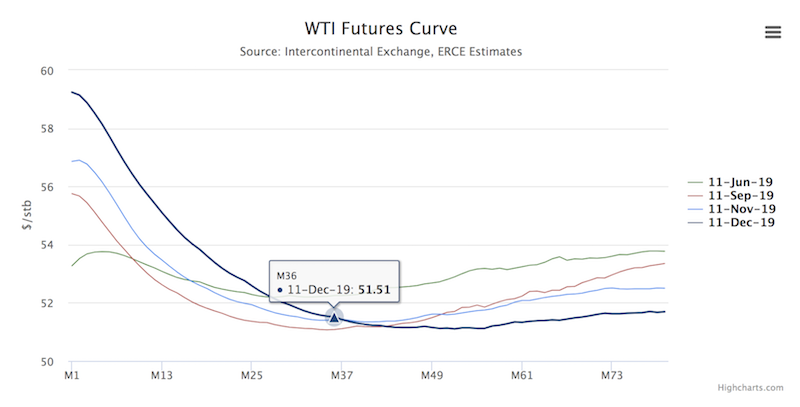
If you go long oil 36 months forward, there’s that $8.50 spread, or $8,500 per contract. That means if oil is above $51.50 by December 2019, this trade would work out. If oil falls below $51.50 you would lose money.
A word of caution
Carry trades are not guaranteed income. In a way, they are like synthetic short gamma trades, meaning they tend to hold up and make money when the environment is favorable to returns and not hold up when markets are more turbulent.
For example, if you are borrowing at 2 percent to invest in a security that you expect to generate you 7 percent, and that’s leveraged 4x (i.e., 20 percent annualized return), all it takes is a 5 percent decline in the underlying security and you lose your entire expected annual return. Moreover, dividends can always be cut by the company issuing them and borrowers can default for those in the fixed income and lending markets.
Moreover, in the “long oil out 36 months” trade, that is a “risk on” type of trade. Oil prices tend to be mostly sensitive demand. Typically oil does well when the economy is good and declines when the economy is bad.
Using Carry Concepts in Your Portfolio
Carry is one of the most common general strategies in investing.
However, we know that forward returns will be nothing like past returns. Because all assets compete for investors’ capital, forward returns are low in virtually all asset classes. Stocks have returned some 11 percent annualized over the past half-century in the US. They are likely to do half that moving forward.
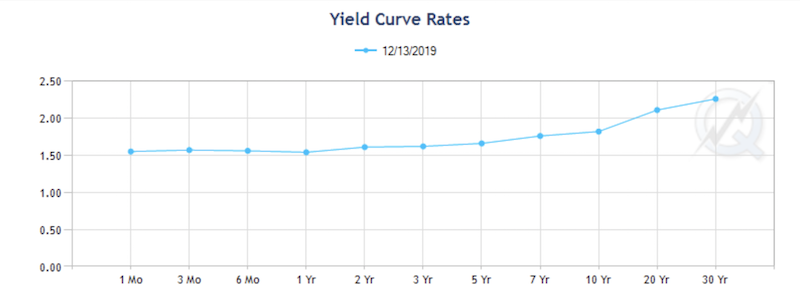
US Treasuries did 7 percent annualized over the past 50 years; yet now they yield just 1.5 to 2.3 percent moving forward, as borne out by the forward curve. Safe corporate credit generally yields 2 to 3 percent in the US and even lower in Europe and Japan, the main other two reserve currency countries.
In Europe, you’re looking at zero or negative bond yields, and even far out on the curve where there is a lot of price risk.
A traditional 50/50 portfolio of US assets will yield only about 4 percent per year going forward (and since equities are 2x to 3x more volatile than bonds, it will still have about 85 percent of its risk concentrated in equities).
Carry portfolios involve going long a high-yielding asset and short a low-yielding asset. For example, traders will often borrow in a cheap currency like yen and invest it in stocks and emerging market fixed income or currencies.
This spread multiplied by the leverage represents the potential return. Carry is the annual yield when holding spot prices and valuations constant.
Carry is common in all asset classes, including equities, fixed income, currencies, commodities, and even rates, and many investors will use futures in order to determine carry. Futures markets show the discounted future. For assets and asset classes with futures markets, it is easy to see what the price of anything is likely to be at any given time.
For example, the intraday price on the S&P 500 on December 16, 2019 is 3,200. For the December 2020 futures contract, it is 3209, showing that investors are more neutral/moderate on stock prices going forward.
Later on in the cycle, however, traders and investors tend to be leveraged long. They tend to extrapolate what’s worked best in the recent past and leverage the assets that have recently done well (i.e., usually equities) and short the assets that help them achieve this leverage (funding currencies like JPY, EUR, CHF, or even USD).
At a point, however, this gets overextended. What is typically an escalator ride up ends up devolving into a sharp and surgical turn down.
Conclusion
Commodity carry is a function of the sum of the roll yield and the risk-free rate (i.e., the return on cash).
Roll yield depends on the shape of the curve and is taken as the annual yield assuming no change in spot price or valuations (similar to how you’d calculate a dividend yield on a stock).
For many investments, the full price must be paid for a commodity or physical good. In the futures markets, a trader normally puts up only a small amount of collateral relative to the exposure they’re getting. To compare commodities to other investments, we need to compare them on a fully collateralized basis. This means because traders are paying a relatively small upfront amount, they are freeing up cash that can be put to work elsewhere and thus should be rewarded for it.
Accordingly, we consider commodity carry to be the sum of the forward “roll” and the rate of return on the cash freed up by choosing to trade the futures contract as opposed to buying the commodity on a fully collateralized basis.