Value Investing: Is It Still a Viable Strategy?


Much has been made of the idea that value investing is badly lagging other trading strategies. When liquidity is abundant, as it mostly has been since 2009 due to the fallout from the financial crisis, long-duration growth stocks tend to outperform value.
Nonethless, AQR’s value gauge is reporting the highest value spread since the dot-com bubble in 2000 – i.e., value undervalued relative to growth.
Global Value Spreads – Hypothetical AQR Industry-and-Dollar-Neutral All-Country Value Portfolio
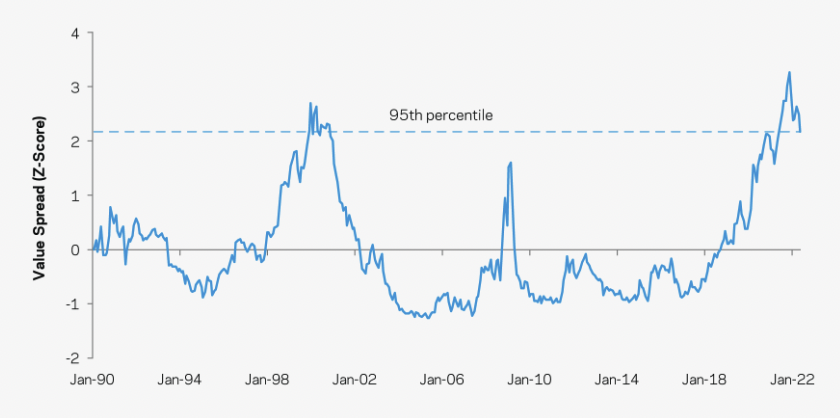
)Source: AQR. January 1, 1990 – May 6, 2022)
The value spread has fallen slightly off the peak, though it remains near its tech bubble peak, at around the 95th percentile.
But, of course, a massive valuation dislocation says very little about the timing of when it falls back to earth. But the spread is very high, which could bode well for investors who have a preference for value over growth.
Even the most patient managers are questioning the validity of their approach to the markets.
But first, let’s go over some basics.
What is value investing?
Value investing is a strategy by which traders buy stocks that are believed to be trading for less than their intrinsic value.
In some interpretations, this might mean buying shares trading for less than their book value (i.e., the sum of their assets is less than the equity value of the business).
Some might take this even further and lean toward net-net investing.
Net-nets refer to companies that are trading for less than the value of their net current assets. This means looking at current assets, taking cash and cash equivalents, reducing accounts receivable for doubtful accounts, and valuing inventory at liquidation value rather than prospective sale value, and subtracting all liabilities.
Naturally, you’d expect companies trading at this level to be few and far between to get a discount of this level, and you’d be right. But nonetheless, they often exist and are typically quite small and can go unnoticed by larger institutional traders who ignore them.
This is because of their size and lack of liquidity. Large institutions need to trade markets that are relatively liquid in order to accommodate the size of their trades.
Some value investors will also include short selling “expensive” stocks into their strategy if they want to reduce their beta to the broader stock market. But this is less common as shorting equities is inherently more challenging given you’re paying away risk premium.
Whatever the definition or specific strategy, value investors will try to purchase stocks that are less than their believed intrinsic value.
Theoretically it’s a solid strategy because the value of a business is the amount of cash it produces discounted back to the present. If you overpay for something, it’s hard to make a good return.
Likewise, if you find something for a bargain, you are more likely to make a quality return. The most well-known value investor, Warren Buffett, has used it to great effect throughout his career.
The flaws in value investing
I think most traders and investors will find the logic behind the value investing mindset and strategy straightforward. However, there are flaws to this approach.
Asset prices move simply because of buying and selling activity.
While certain market players will enter markets when prices go down and risk premiums expand (i.e., the price of one asset relative to a competing asset increases), prices can stay “cheap” or “expensive” for elongated periods of time. This can mean years, if not decades.
While this might not seem rational, there are underlying reasons why.
This comes back to liquidity, or the amount of money and credit available to purchase assets relative to their supply. The price of any good, service, or financial asset is simply a function of the total amount spent by buyers divided by the quantity sold.
Accordingly, to forecast the price of anything, you need to have an understanding of the total amount spent and the quantity sold. And in every market, different buyers and sellers have different motivations.
When a central bank buys an asset, they are doing so for a different reason than in comparison to a value manager. The central bank is buying or selling because they believe it will help to achieve their policy objectives while the value manager is doing so because they’re sensitive to prices and believe the asset is cheap.
This is why following central banks is so important because they have so much influence on adjusting the total supply of money and credit in an economy, which has knock-on effects for asset prices.
Therefore, while value managers will typically view things in terms of risk premiums, yields, and price levels when thinking in terms of what to buy, markets are driven by liquidity and not by value. Anything that’s cheap can become a lot cheaper if there is not adequate liquidity in the system.
For this reason, to identify where any given market will go, it’s important to identify who the buyers are, who are the sellers, how big are these entities, and what are their motivations.
An example of where value investing is not likely to hold
In the US Treasury bond market, your main sources of demand are the Federal Reserve (the US central bank), other G-7 central banks, foreign non-G-7 central banks, commercial banks, institutional traders / investors, pension funds, insurance companies, retail traders / investors, and passive bond funds.
The Fed buys and sells bonds as part of its open market operations in line with the policy objectives it communicates to the public. In the case of foreign central banks, they will allocate certain amounts of their FX reserves to foreign bonds based on the current or perceived reserve status of that particular currency.
Because the US is the world’s primary reserve currency and there is an ample amount of the world’s primary reserve asset (Treasury bonds), these securities tend to have large allocations in the portfolios of foreign official accounts.
One of the primary rules for tracking global financial flows is that the demand for US Treasury bonds is a function of global reserve growth. Reserve growth is currently flat, so the foreign demand for US paper is neither particularly strong in one direction or the other.
Based on the accounts of foreign central banks, they’re already close to being maxed out on their allocations to Treasuries, so there isn’t a material source of demand stemming from those players in the market.
In terms of another source of demand in the same market, commercial banks’ demand for liquid assets is heavily a function of their need to comply with regulatory requirements.
So, what are the regulatory requirements, how might those change going forward, and how might that effect what commercial banks are likely to do?
Various assets can fulfill the liquidity coverage requirements (LCR) through a variety of forms of what are called high quality liquid assets (HQLA). Because some assets can equally fulfill regulatory requirements (namely, there is no regulatory bias for one or the other), the relative pricings among them matter.
Banks’ demand is also a function of their reserve growth. Recently, banks reserve growth has been the lowest this decade and have enough liquid assets to satisfy regulatory mandates before needing to stockpile more.
In terms of pension funds, they like to keep their asset allocation mix relatively stable over time. When shifts in asset allocations do occur, they tend to go slowly, as is the conservative bureaucratic nature of these vehicles.
In the past pension funds were much more risk averse and invested primarily in bonds. Due to declining returns, they’ve now predominantly shifted into equities, with a smattering of bonds and alternatives sprinkled in (e.g., hedge funds, private equity, real estate).
The implication is that pension funds operate similarly to value managers. That is, to keep their asset allocation steady they will be inclined to buy when something goes down and sell when it goes up. This helps keep things in line with their internal mandate.
Retail traders / investors exhibit the behavioral tendency to buy when things are good and going up in price (which usually means that they’re more expensive), and sell when something goes down to avoid pain.
However, this is backwards and opposite of the buy-low, sell-high type of idea that leads to quality returns in financial markets, and is a bad strategy when pursued broadly.
Central banks are not directly amenable to value investing
Over the past decade-plus, central banks have had an outsized influence in financial markets. They’ve bought over $15 trillion worth of assets, which has increased the price of most financial assets.
Central banks, as alluded to earlier, are not “value investors” but rather price-insensitive buyers that are acting in accordance with their statutory mandate(s) regarding stable inflation and whatever else they must abide by, either by law or by financial and broader macroeconomic necessity.
When a non-value player has so much influence, it should logically follow that value may not be an optimal performer.
In fact, when stocks and financial assets are expensive, many investors will lean toward “secular growth” names that are perceived to be able to grow irrespective of the economic backdrop they find themselves in. This leads to stocks like the “FANG” contingent (Facebook, Amazon, Netflix, Google) getting even more expensive.
Value investing when liquidity is tight
Value investing, like many other long-biased investment strategies, will perform poorly when liquidity in the markets is not ample.
During a stretch in 2009, homes in some parts of Cleveland, Ohio were selling for less than $5,000 apiece that would normally fetch more than $200,000 in a healthy housing market. In other words, they were at a discount of some 97-plus percent.
If people don’t have the disposable incomes or access to lines of credit, a market between buyers and sellers and lenders and borrowers can virtually lock up or disappear volume-wise. Cheap can get cheaper if people don’t have the capital to buy something. Its notional valuation metrics won’t matter much in that context if the money and credit necessary to generate underlying demand aren’t there.
US stocks were very cheap in late-2008 and into early-2009. But they didn’t recover until the Fed eased to an adequate enough extent through interest rates and by lowering longer-run rates by buying longer-dated Treasury bonds. Pushing nominal interest rates below nominal growth rates and expected nominal growth rates is ultimately what was necessary to get lending activity going again.
US stocks also fell from 2000 to 2002 and didn’t bottom until there were eleven reductions in the fed funds rate by the Federal Reserve. At this point, rates were pushed low enough to get out of a contractive monetary policy.
Central banks will always target an inflation rate of at least zero to avoid deflation.
Why?
The rate of money and credit creation needs to grow at least as fast as the economy’s capacity to provide goods and services. Otherwise, output won’t be sold, incomes will decline, and the demand for labor will be reduced.
Being able to quantify things in terms of risk premiums and notional equilibrium values is an important form of analysis.
But “value” won’t matter to any appreciable extent if there isn’t enough liquidity.
For example, in Japan, debt relative to output is extremely high, north of 250 percent.
With debt that high and broad-based fundamentals deteriorating with low productivity growth, low growth in the labor force, and extremely high and worsening dependency ratio, you would think that its sovereign debt yields should rise to reflect this risk.
But that’s not the case. The entire yield curve, which goes out to 40 years, is under 50 basis points. This is because the Bank of Japan provides the liquidity. They keep rates anchored to zero out at least ten years and perpetually buy assets as part of their quantitative easing program.
Accordingly, tracking the flow of liquidity is key because that’s what moves market rather than the notional idea of how cheap or expensive they might be.
Valuation is better thought of as a risk indicator. Namely, how far can something move – rather than as a directional indicator.
G-3 central banks (the Fed, ECB, and BOJ) have the biggest effect on liquidity. The Fed is the most influential overseeing the world’s largest economy and with the dollar as the primary global reserve currency. The raising and lowering of interest rates and buying of assets alters the incentives of individual market participants throughout the economy.
As discussed in “How To Identify Whether Market Trends Are Sustainable” understanding risk premiums between assets is important and part of the picture.
For instance, what’s the yield on cash.
What is that in comparison to the yield on bonds (e.g., 10-year sovereign yield, AAA corporate credit, and so on), and how does the yield on bonds compare to that of equities.
All assets compete with each other, so dislocations where cash yields higher than bonds or stocks are unlikely to last for long periods of time.
Investors will modify their behavior in light of what the central bank is doing.
For example, if the Fed is tightening and one knows stocks are only going to provide maybe 5 to 6 percent returns long-term (2 percent growth, 2 percent inflation, some portion from dividends), long-duration safe bonds are giving 2.5 percent, lower-end investment-grade is giving 3 percent, cash is giving 2 percent, then you might use that as a signal to reduce exposure to equities and accumulate more safe assets if that premium – i.e., the extra return associated with the risk of investing in stocks – is too low.
As the Fed eases, holding all else equal, then one might begin to move out of cash and more up the risk ladder because the yield on cash and comparative bonds will diminish. (In reality, the Fed often eases in response to slowing growth conditions or a deterioration in aggregate demand that makes holding risk assets less attractive.)
Conclusion
Value investing is a mindset that one should pay a price for an asset that will eventually yield a quality return down the line.
However, market participants buy and sell for various reasons, and the price of something ultimately depends on the amount of money and credit spent divided by the quantity sold.
So, primarily, asset prices will be a function of liquidity, or the amount of money and credit available in the financial system to buy them.
This can make markets out of whack relative to notional equilibrium values for elongated periods. This can mean elongated, frustrating periods where “value” performs poorly relative to other strategies.