How To Identify Whether Market Trends Are Sustainable


Risk should always be proportional to reward. Therefore, one of the most basic ways to determine whether market trends are sustainable is to look at the comparative yields between cash, bonds, and stocks. Stocks should provide a positive expected yield above bonds, and bonds should provide a positive expected return over cash, and by the appropriate risk premiums.
Let’s use a basic example:
In the US, the return on cash is currently 2.05% using the 3-month yield, which is a cash proxy.
The return on bonds depends on what type of bonds you’re looking at. The 10-year US Treasury, a common bond yield benchmark, is 2.04%, or about the same return on cash. So, for taking on all that extra duration risk, you aren’t compensated very much.
Then we can look at corporate credit. Credit rating agencies bucket various companies into tiers based on their credit quality – AAA is the highest rating available, while C or lower is considered extremely risky or already in default.
Naturally, to compensate investors for risk, lower quality credit should yield more than higher quality credit. Over the course of time, different rating tiers have certain expected default rates, which feed into determining yields. Ultimately for assets to be worth what they are, the cash flows need to be available to satisfy their status as an IOU.
Looking at the relative yield differentials between cash, bonds, and equities is important because it paints a picture of the discounted future.
How do we know the “yield” of stocks?
We look at the current price of a representative basket of equities (such as the S&P 500), the expected earnings of that index by a certain point in time, and divide the two.
You will be familiar with the concept of the price-earnings ratio, or P/E. The inverse of the P/E is the yield. If the forward-one-year P/E of a stock index is 17, the reciprocal of that number (1/17) represents the forward expected yield of stocks. In that case, it would be 5.88%. You can also think of the P/E multiple as the duration of stocks – or how long it takes to make back your principal.
In the diagram below we can see the current yields between cash, various forms of Treasuries, different types of corporate credit, and stocks. The blue bar on the left shows current risk premiums between US stocks (“SPX”) and other asset forms (e.g., cash, US Treasuries, corporate credit).
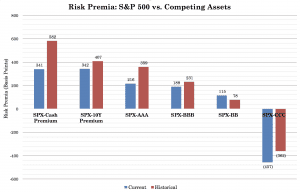
The only place where stocks look cheap relative to historical data is BB credit, which is the first high-yield or “junk” credit tier.
Later on in the cycle, spreads tend to get excessively low because people are overly optimistic about the future or they assume that past trends will continue indefinitely. Assets become fully priced or overpriced and you would need to think about how to act as a result of that.
How do you determine how to think about the future and what that means for market trends?
Here are a few steps:
1. What is the rate of unemployment?
Low unemployment rates normally go hand in hand with low credit spreads. When an economy reaches a state of “full employment” an economy is believed to be operating at its fullest capacity possible. It shows that the ability to squeeze more out of the current cycle is limited.
Central bankers pay close attention to the unemployment rate when deciding where to go with policy. If an economy runs beyond its equilibrium operating capacity, then inefficiencies and undesirable inflationary pressures could develop.
2. How is the central bank operating?
Are the central banks easing policy? Are they lowering rates, are they buying assets (or planning to)?
If asset prices are high, it doesn’t necessarily mean it’s a good time to sell. If central banks provide adequate liquidity support to markets, that’ll make its way into assets.
Many presume that even in highly indebted countries, their asset markets are at high risk of rolling over. However, if their debt is denominated in their own currency, the central bank can lower the rates and buy the debt. They can control it in all the normal ways. Instead of the costs showing up in the form of higher yields on its sovereign debt, it runs through the currency channel instead via the “printing” of money (through a depreciation, holding all else equal).
Nonetheless, Japan, with sovereign debt to GDP somewhere north of the 250 percent range, may still have an attractive currency in “distressed” periods. It is a creditor country (i.e., its net international investment position is positive). It is also a funding currency in many financial transactions globally. Investors often borrow in yen to finance the purchases of assets. When investors decide to sell these assets, they reduce their yen denominated liabilities in conjunction, causing a “short squeeze” that boosts its price.
3. How is debt growth tracking relative to incomes and output?
More specifically, how is debt servicing rising relative to earnings? Debt can rise relative to incomes until the debt servicing overwhelms the cash flows and risk asset markets top.
Even in countries with unsustainable sets of debt growth conditions, like China, in the short-run it helps support growth and lifts asset prices.
While many have identified debt growth issues, they have thought of or interpreted this as a “short China” type of thesis believing it to be bearish for China’s asset markets. However, it’s not debt growth in excess of income that’s an immediate problem. Rather, it’s about identifying when debt service is no longer viable at a pervasive level in the economy. That’s the point when the economy will top.
Markets, being forward looking, will generally anticipate tops and bottoms in the economy in advance. How much more in advance? Usually months.
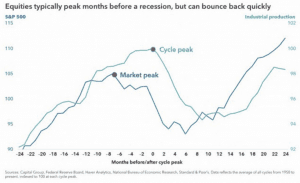
For example, when US stocks peaked in October 2007, the economy entered into recession in December 2007.
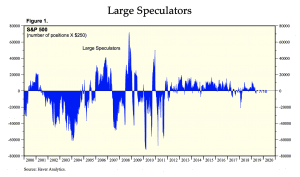
4. What is the level of sentiment?
In other words, how are other investors positioned?
Ways to gauge sentiment:
a) CFTC data on long/short positioning of various players in the market. You can find this on certain sites like Yardeni Research.
b) Numerous investment banks and research houses publish hard and soft data metrics.
Hard metrics include concrete numbers, such as investors’ cash allocations, the beta of their clients’ top stock holdings, and proprietary measures of bullish / bearish sentiment. Soft measures include survey related data about what they report to be doing with their portfolios.
Market data about positioning helps to ascertain “crowdedness”. If buyers are stretched too far long or short, there is risk in increasingly going with the consensus. If there is a fundamental event, that could spark a reversal back in the other direction and cause a wave of selling in a self-perpetuating manner. In the summer of 2018, we saw this in WTI crude oil in when it was above $70 per barrel. When everyone is on the same side of the boat sometimes it flips.
Positioning metrics act best as a type of contrarian indicator. If a market is stretched long and you are interested in going the same way, you might be less inclined to put on a long position, or less apt to put it on in the size you would have otherwise in a more neutrally positioned market.
5. Assets, through their pricing, bake in a certain expectation for forward growth
Higher expected growth shows up in the form of lower credit spreads. Namely, the spread between theoretically “risk free” sovereign debt and corporate credit.
When optimism is high, traders don’t expect a large premium for corporate debt over sovereign debt. The same is also true for stocks, which often appears through a higher P/E multiple (among other measures). This spread can only rationally be squeezed together so far.
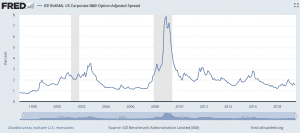
Below is an example of the BBB spread (BBB credit over US Treasuries). In times of froth (1997-1999; 2005-2007; and recently to an extent), it’s rare to see this spread run below 120 basis points, though it can get even tighter. It is currently 153bps.
The value of a financial asset is the amount of cash that can be extracted from it over its life discounted back to the present. Accordingly, traders will often use discounted cash flow to determine the value of an asset or back out current expectations in the market and compare it relative to what’s realistic.