How To Trade Indices


Trading indices (or indexes) is a widely favored method to participate in financial markets without the need to trade directly in individual stocks, bonds, commodities, or other assets. Basically, you are trading an index-tracking fund or a basket of shares, instead of buying and selling individual company stocks.
This guide explains how you can use various indices to profit from either an increase or decrease in different market segments.
Quick Introduction
- Indices offer exposure to a broad range of assets, such as stocks, bonds, or commodities, allowing you to trade the overall performance of a specific market segment.
- Many indices are composed of highly liquid assets and are calculated based on transparent methodologies, making them attractive if you are looking for efficient and reliable markets.
- Indices can be used for risk management by providing a benchmark for assessing the performance of a trading strategy or portfolio against the broader market.
- Indices can be actively traded throughout the trading day, allowing you to day trade with opportunities to profit from short-term price movements and intraday trends.
- Trading indices allows for diversification without the need to select and manage individual assets. This diversification can help spread risk and reduce exposure to single-stock or single-asset risk.
Best Brokers For Trading Indices
Following our tests, we recommend these 4 brokers for index trading:


What Are Indices?
Indices refer to financial benchmarks that represent a specific segment of the market, such as a group of stocks, bonds, commodities, or other assets.
These benchmarks provide a snapshot of the overall performance of the underlying assets they track. Indices are essential tools for helping to gauge broader market sentiment, assess trends, and make informed trading decisions.
Indices can encompass a variety of categories, but stock market indices are the most relevant to traders. The most well-known stock indices include the S&P 500, Dow Jones Industrial Average, and Nasdaq Composite. These indices track the performance of large-cap stocks, showcasing how the broader market is faring on a given day.
Trading indices provides several advantages. They allow you to focus on a broad market perspective rather than individual stocks, which can be time-consuming and riskier.
If you want to day trade you can use technical analysis and patterns on index charts to identify potential entry and exit points, taking advantage of intraday price movements in the broader market.
Additionally, indices can provide a sense of market momentum and volatility, helping you to make quick, well-informed decisions within the trading day.
Types Of Indices
There are several major types of indices used to measure and track various aspects of the financial markets and the economy. The main types of indices are:
- Stocks: These track the performance of a specific group of stocks. Examples include the S&P 500, Dow Jones Industrial Average, Nasdaq Composite, and FTSE 100.
- Bonds: These measure the performance of bonds in the fixed-income market. The Bloomberg Barclays U.S. Aggregate Bond Index is a well-known example.
- Commodities: These monitor the prices of various commodities, such as gold, oil, or agricultural products. The S&P GSCI (Goldman Sachs Commodity Index) is one example.
- Currencies: Also known as forex indices, these measure the relative strength or performance of one currency against a basket of other currencies. As an illustration, the US Dollar Index (DXY) assesses the worth of the U.S. dollar relative to a selection of other currencies.
- Economic: These assess economic conditions and trends. The Consumer Price Index (CPI), Gross Domestic Product (GDP), and the Purchasing Managers’ Index (PMI) are popular examples.
- Volatility: These gauge market volatility and investor sentiment. The CBOE Volatility Index (VIX) is a prominent example.
- Real Estate: These measure the performance of the real estate market, including property values and rents. The Case-Shiller Home Price Index is an example.
- Sectoral: These focus on specific sectors or industries within the stock market. Examples include the S&P 500 Technology Sector Index and the S&P 500 Health Care Sector Index.
- Global: These provide a comprehensive view of markets worldwide, such as the MSCI World Index.
- Speciality: These are created for specific purposes, like ethical investing or thematic investing. An example is the S&P 500 ESG Index for environmentally and socially responsible investing.
How Are Indices Calculated?
Indices are typically calculated using a weighted average of the constituent assets’ prices or values. The specific methodology for calculating an index can vary depending on the index provider and the type of assets it tracks, whether it’s stocks, bonds, commodities, or other financial instruments.
The methodology for calculating an index can be more complex for indices that track specific sectors, regions, or asset classes. Different indices have different rules and methodologies, so you should have a good understanding of how a particular index is calculated when using it for trading or investment purposes.
Here is an overview of how stock indices are calculated:
Selection Of Constituent Stocks
It starts by selecting the stocks that will make up the index. These are usually chosen based on factors like market capitalization, liquidity, and sector representation.
For example, the S&P 500 includes 500 of the largest publicly traded companies in the U.S.
Index Base Date And Value
Every index has a base date from which its value is calculated. This date is assigned an arbitrary value, often set to a round number like 100 or 1,000.
The index’s value on the base date is also set to this arbitrary number.
Price Or Market-Cap Weighting
Most stock indices are either price-weighted or market-capitalization-weighted.
Price-weighted indices give equal importance to the stock prices of all constituents, while market-cap-weighted indices consider the market capitalization of each stock. Market cap is calculated by multiplying the stock’s price by its total number of outstanding shares.
Calculation
The index value is calculated by summing up the prices or market capitalizations of all constituent stocks and then dividing by a divisor.
The divisor is used to adjust for stock splits, dividends, and other corporate actions that can affect the index’s value.
Regular Rebalancing
Indices are periodically rebalanced to ensure they accurately represent the market segment they track. This involves adding or removing stocks from the index based on changes in the market and the criteria set by the index provider.
Dividend Reinvestment
Some indices reinvest dividends received from constituent stocks back into the index, while others do not.
The treatment of dividends can affect the index’s total return.
Index Provider
The index provider, such as S&P Global, Dow Jones, or Nasdaq, is responsible for maintaining the index and ensuring it accurately reflects the segment it represents.
The Most Traded Stock Indices
Indices are popular among traders worldwide and serve as important indicators of the economic and financial health of their respective regions. Traders often use these indices for various trading strategies, from day trading to long-term trading.
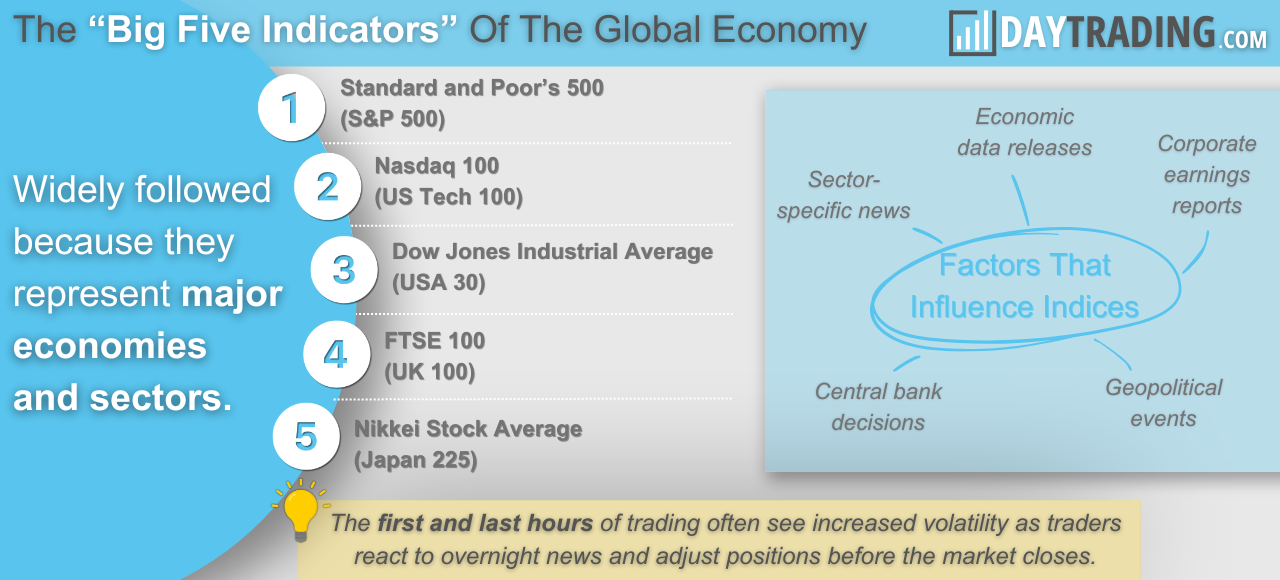
S&P 500
The S&P 500, short for the Standard & Poor’s 500, is one of the most widely followed equity indices in the world and is a key benchmark for the U.S. stock market. It comprises 500 of the largest publicly traded companies in the United States, representing a diverse range of sectors.
The S&P 500 provides a snapshot of the overall performance of these major companies and serves as a gauge of the health of the U.S. economy.
On an average trading day, the S&P 500 typically experiences trading volume in the range of 2 to 3 billion shares, although this can vary significantly based on market conditions, news events, and economic releases.
Dow Jones Industrial Average (DJIA)
The Dow Jones Industrial Average, often simply referred to as the Dow, is one of the most recognized stock indices globally. It consists of 30 large, publicly traded companies in the U.S., representing various industries. The Dow serves as a barometer for the health and performance of the U.S. economy.
Daily trading volume for the Dow is typically in the range of 200 to 300 million shares.
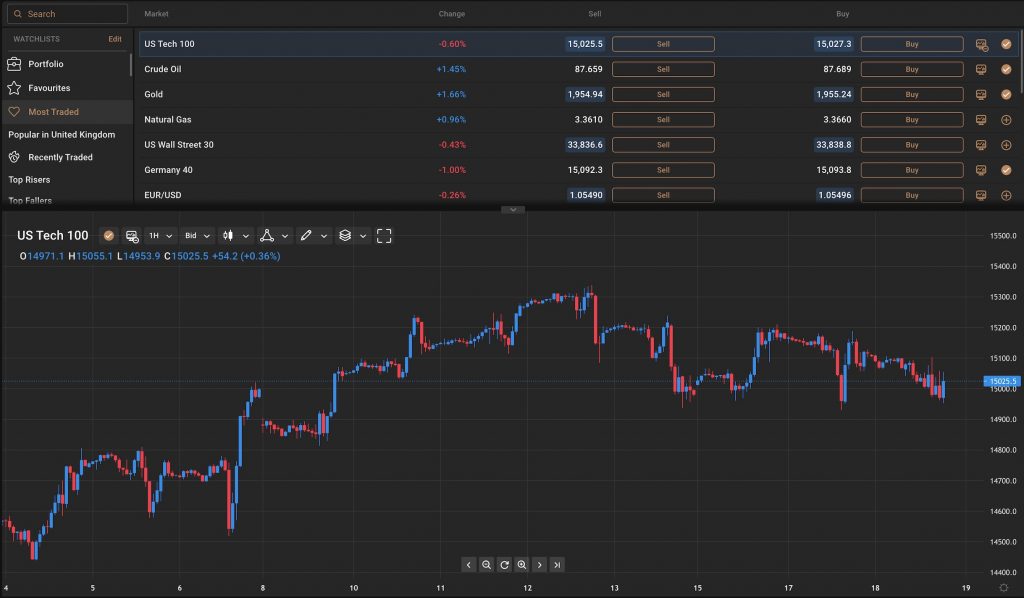
Nasdaq Composite
The Nasdaq Composite is a prominent stock index that specializes in tracking the performance of technology and Internet-related companies, along with other businesses listed on the Nasdaq stock exchange. It encompasses a diverse range of industries, including tech giants, biotech firms, and retail businesses.
Daily trading volume for the Nasdaq Composite is typically substantial, often reaching volumes of 2 to 3 billion shares. This strong trading volume reflects the Nasdaq’s significance in the world of technology and innovation, as it includes some of the most influential companies in the sector.
FTSE 100
The FTSE 100, also known as the Financial Times Stock Exchange 100 Index, is the primary benchmark for the United Kingdom’s stock market. It encompasses the top 100 companies listed on the London Stock Exchange in terms of market capitalization, making it a critical indicator of the health and performance of the UK economy.
Daily trading volume for the FTSE 100 varies, but it generally sees substantial trading activity, with volumes ranging from 700 million to 1 billion shares.
DAX 40
The DAX 40, short for Deutscher Aktienindex, is the primary stock index in Germany and a key benchmark for the country’s equity market. It comprises the top 30 companies trading on the Frankfurt Stock Exchange, representing a diverse range of sectors and industries.
The DAX 30 is a crucial indicator of Germany’s economic health and performance. Daily trading volume for the DAX 30 can vary, but it usually experiences robust trading activity, with volumes often ranging from 60 to 100 million shares.
CAC 40
The CAC 40 is France’s leading stock market index, comprising the top 40 companies listed on the Euronext Paris stock exchange. It represents a broad spectrum of sectors and industries and serves as a key indicator for the French equity market’s performance and the broader economy.
Daily trading volume for the CAC 40 can vary, but it usually sees substantial trading activity, with volumes often ranging from 250 to 350 million shares.
Nikkei 225
The Nikkei 225 is Japan’s most well-known stock index, encompassing 225 major companies listed on the Tokyo Stock Exchange. It serves as a primary gauge of Japan’s economic health and is considered a vital benchmark for the country’s equity market.
Daily trading volume for the Nikkei 225 is typically substantial, with volumes frequently ranging from 1.5 to 2.5 million shares.
Nifty 50
The Nifty 50, officially known as the National Stock Exchange Fifty, is India’s premier stock index. It includes the 50 largest and most liquid stocks listed on the National Stock Exchange of India (NSE). The Nifty 50 serves as a vital benchmark for India’s equity market and reflects the performance of companies across various sectors.
Daily trading volume for the Nifty 50 is typically substantial, with volumes often ranging from 200 to 300 million shares.
What Moves An Index Price?
Indices prices are influenced by a combination of factors that reflect the overall health of the underlying market or economy they represent. Factors shaping a price will largely depend on what assets the index consists of.
Here are some key factors that can move prices.
Company Earnings
For stock indices, the earnings reports of the component companies play a significant role. Positive earnings reports can drive index prices higher, while negative results can lead to declines.
Economic Data
Economic indicators such as GDP growth, employment figures, inflation rates, and manufacturing data can impact indices. Strong economic data may boost market sentiment, while weak data can have the opposite effect.
Interest Rates
Central bank decisions on interest rates can influence indices, especially bond market indices. Higher interest rates may lead to lower bond prices and impact related indices.
Geopolitical Events
Events like elections, wars, trade disputes, and political instability can cause market volatility and impact indices.
Market Sentiment
Investor sentiment and market psychology play a significant role. Positive sentiment can lead to buying, while fear or uncertainty can drive selling.
Currency Movements
Currency fluctuations can affect international indices by altering the value of foreign investments in local currency terms.
Commodity Prices
For indices tracking commodity markets, changes in commodity prices can have a direct impact. For instance, rising oil prices can influence indices like the Dow Jones Transportation Average.
Regulatory Changes
New regulations or changes in existing ones can affect specific sectors and industries, leading to changes in sectoral indices.
Global Events
Events occurring in other parts of the world can impact global indices. For instance, geopolitical tensions or financial crises in one region can affect markets worldwide.
Corporate Actions
Stock splits, mergers, acquisitions, and delistings can change the composition of stock indices.
Technological Advancements
Advancements in trading technology, algorithmic trading, and high-frequency trading can lead to rapid price movements and increased volatility.
Supply And Demand
The simple forces of supply and demand in the market can also impact prices, with buying pressure leading to higher prices and selling pressure causing declines.
Pros And Cons Of Trading Indices
Pros
- Diversification: Indices offer exposure to a diverse range of assets, reducing the risk associated with individual stocks or assets.
- Liquidity: Indices are generally highly liquid, making it easier to enter and exit positions with minimal price slippage.
- Transparency: The methodologies used to calculate indices are typically transparent and well-documented, providing confidence in their accuracy.
- Market Efficiency: Indices are efficient, reflecting the combined knowledge and expectations of market participants, which can be advantageous for trading.
- Intraday Opportunities: Indices are actively traded throughout the trading day, offering ample opportunities to profit from intraday price movements.
Cons
- Limited Individual Analysis: Trading indices doesn’t involve analyzing individual companies or assets, which can limit the depth of fundamental analysis.
- Correlation: Many stocks within an index are correlated, meaning they tend to move in the same direction, reducing diversification benefits.
- Market Hours: Trading indices may require you to be active during specific market hours, which can be inconvenient if you are in different time zones.
- Risk Management: You should employ risk management techniques, as significant market moves can result in substantial losses.
- Market Events: Unexpected market-moving events, such as economic data releases or geopolitical developments, can impact indices, potentially leading to unexpected losses.
Bottom Line
Indices trading offers diversification, allowing you to gain exposure to broad market movements rather than individual assets. Indices also play a pivotal role in assessing overall market sentiment and economic conditions and are an ideal choice if you are seeking to track and trade various sectors and industries across global financial markets.
To get started, use our ranking of the best brokers with indices.
FAQ
What Is Indices Trading?
Trading indices involves speculating on the price movements of market indices, which represent a group of underlying assets such as stocks, bonds, or commodities.
You can profit from both rising and falling markets by buying or selling index-based financial instruments like futures contracts or exchange-traded funds (ETFs).
How Do I Trade Indices?
To trade indices, you can open an account with a reputable broker that offers access to indices trading, such as stock index CFDs or ETFs.
Once your account is funded, you can analyze the market, choose your desired index, and place trades by buying or selling index-based instruments to speculate on price movements.
When Should I Trade Indices?
The best time to trade indices often corresponds to the regular trading hours of the specific exchange where the index is listed. For example, the most liquid and active trading hours for the S&P 500 index (U.S.) are typically between 9:30 AM and 4:00 PM Eastern Time (ET) when the New York Stock Exchange (NYSE) is open.
Traders often focus on the first and last hours of trading when market activity is higher which can lead to greater price movements. Additionally, major economic releases or corporate earnings reports can impact index trading, so it’s important to be aware of the economic calendar and earnings calendars when planning your trades.
Are Indices Or Stocks Better For Beginners?
For beginners, indices trading is often considered a more suitable starting point than stock trading. Indices offer diversification, reducing the risk associated with individual stock picking, and they provide exposure to broader market movements.
Additionally, it’s a simpler way to gain exposure to the financial markets. Stock trading requires a deeper understanding of individual companies and can be riskier for beginners. As you gain experience and knowledge, you may choose to venture into stock trading, but starting with indices trading allows beginners to learn the ropes with a more manageable level of complexity and risk.
Recommended Reading
Article Sources
- The International Guide to Securities Market Indices, Henry Shilling, 2017
- How the Major Stock Indexes Work, Phillip Ryan, 2012
- S&P 500 - Google Finance
- FTSE 100 - Google Finance
- NASDAQ 100 - Google Finance
The writing and editorial team at DayTrading.com use credible sources to support their work. These include government agencies, white papers, research institutes, and engagement with industry professionals. Content is written free from bias and is fact-checked where appropriate. Learn more about why you can trust DayTrading.com