Inflation – Everything You Need to Know About Its Impacts on Markets


The basic picture of the financial markets and macro-economies is very important to talk about when it comes to understanding what’s likely to transpire. Inflation, and changes in the discounted expectations of where inflation will go, is one of the main two overarching forces dictating how asset prices move (along with growth and its changes relative to expectation).
Money and credit are what change prices in markets. And the biggest two levers over money and credit creation in the economy come from monetary and fiscal policy.
We’re in a new period of monetary policy.
The primary form of monetary policy – interest rates – is out of room because rates are at zero throughout the developed world.
The secondary form of monetary policy – using “printed” money to buy assets to lower long-term interest rates – is also close to being out of room. This is because the spreads between short-term and long-term rates is mostly closed in developed market yield curves (USD, EUR, and JPY based debt).
The third form involves a coordination of monetary and fiscal policy, what some in the financial media call MMT. Fiscal policy, directed by politicians, makes more of the decisions and the central bank provides the money and credit to support those.
In other parts of the world, like Southeast Asia, it’s a different story and you still have normal monetary policy to work with.
But the third form of monetary policy is in widespread effect throughout the developed world (US, developed Europe, Japan).
The playbook for that largely involves figuring out where the benefits of that monetization are going and avoiding the stuff that doesn’t perform well.
Namely, where is wealth being destroyed (i.e., negative real yields) and where is the money and credit missing (e.g., coal plants, if the government has initiatives that favor alternative energy)?
For example, certain types of stocks benefit well. When you can’t cut interest rates, you don’t have the traditional means of lowering the discount rate to help offset the lost earnings to get the bottom in asset markets.
So, what companies reliably grow their earnings? This could be things like consumer staples or certain types of utilities.
Firms involved in creating the technology creating the big productivity changes and companies with important strategic purposes (e.g., military, aerospace) can also benefit.
It largely comes down to what’s a store of value.
Key Takeaways – Inflation
- Many portfolios remain positioned for a low-inflation world, despite inflation staying above the old 2-3% comfort zone.
- There are three inflation types traders need to hedge differently:
- demand-pull inflation, often addressed with inflation-linked bonds;
- cost-push inflation, where commodities such as energy and industrial metals can help; and
- monetary inflation, which raises questions about strategic foreign exchange exposure and protection against currency debasement.
- An inflation-resistant portfolio can include short-term TIPS for inflation adjustment, commodities for cost-push shocks, gold for currency debasement, energy/resource stocks for commodity upside, international assets for FX diversification, and cash or T-bills for flexibility when rates stay elevated.
Types of Inflation
There are different types of inflation and different time frames to measure them over.
There are also market-discounted inflation rates called breakeven inflation. This is inferred from the price/yield differentials between nominal rate bonds and inflation-linked bonds of the same tenor.
For example, the price/yield differential between a nominal 5-year bond and inflation-linked 5-year bond might say that inflation will average 2.50% over the next five years.
Demand-Pull Inflation
Demand-pull inflation occurs when aggregate demand in an economy outpaces aggregate supply, leading to higher prices.
Often referred to as “too much money chasing too few goods.”
Cost-Push Inflation
Cost-push inflation arises when the costs of production increase (due to higher wages, raw material costs, etc.).
This leads companies to raise prices to maintain profit margins.
Monetary Inflation
Monetary inflation happens when the value of money falls because:
- the money supply expands too much
- government debt rises
- central banks keep policy too loose, or
- confidence in a currency weakens
Prices rise not just because goods are scarce, but because each unit of currency buys less.
Traders often hedge it with gold, foreign assets, commodities, and currency diversification.
Built-In Inflation
Built-in inflation is the result of a wage-price spiral where workers demand higher wages as they expect higher living costs.
Leads to higher production costs and subsequently higher prices for goods and services.
Hyperinflation
Hyperinflation is an extremely rapid and out-of-control inflation where prices increase exponentially over a very short period.
Often leads to the collapse of a country’s monetary system.
Stagflation
Stagflation is a situation where the inflation rate is high, the economic growth rate slows, and unemployment remains steadily high.
This presents a dilemma for economic policy because the interest rate(s) to get inflation down is too high for the markets and economy to tolerate.
Asset Inflation
Asset inflation refers to the increase in the prices of assets like stocks, real estate, and commodities, which doesn’t necessarily coincide with general consumer inflation.
Core Inflation
Core inflation excludes volatile items like food and energy prices from its calculation.
This is done to focus on the underlying and more stable inflation trends in an economy.
Wage Inflation
Wage inflation occurs when there is a widespread increase in wages, which can contribute to general inflation if it leads to higher production costs that are passed on to consumers.
Wage inflation is considered the center point of inflation, which makes sense.
People get money from their job. This is then spent/saved/invested, and the spending becomes somebody else’s income, which is spent and saved/invested, and so on.
So, external trends like oil and commodity prices, supply/demand dynamics in a certain market (e.g., housing), etc., are more secondary forces.
Another implication is that to get inflation down, there sometimes needs to be pain in the stock, which incentivizes companies to lay off workers, which then helps get inflation down.
Imported Inflation
Imported inflation happens when a country experiences higher prices due to the increased cost of imported goods, often due to a depreciation of the country’s currency or increases in global prices.
Export Price Inflation
Export price inflation tracks the price changes of a country’s exported goods and services, influencing the trade balance and potentially the domestic inflation through feedback effects.
Deflation
Deflation is the opposite of inflation, characterized by a general decrease in the prices of goods and services, often indicating a reduction in consumer demand or oversupply.
Disinflation
Disinflation is a decrease in the rate of inflation – a slowing in the rate of increase in the general price level of goods and services in an economy over a period.
Types of Official Inflation
The various inflation measures below provide different perspectives on price changes.
Each addresses specific nuances and distortions that can affect the understanding of inflation in an economy.
Trimmed mean inflation, for instance, is useful for central banks and policymakers as it offers a clearer view of underlying inflation trends by eliminating extreme outliers that can skew the overall inflation picture.
This is also the general idea behind “core” inflation metrics – to get at the underlying trend rather than accurately assess the overall level.
CPI Inflation (Consumer Price Index Inflation)
CPI inflation measures the average change over time in the prices paid by urban consumers for a market basket of consumer goods and services.
PCEPI Inflation (Personal Consumption Expenditures Price Index Inflation)
PCEPI inflation reflects changes in the prices of goods and services consumed by households and non-profit institutions serving households.
Core Inflation
Core inflation strips out volatile food and energy prices to provide a clearer picture of the underlying, long-term trend in inflation.
Core inflation is commonly misunderstood, with many believing that throwing out food and energy misrepresents the actual level of inflation.
This is true, but it’s not its purpose.
Producer Price Index (PPI) Inflation
PPI inflation measures the average change over time in the selling prices received by domestic producers for their output, often seen as a predictor of consumer price inflation.
Trimmed Mean Inflation
Trimmed mean inflation is a measure that excludes extreme price movements, both high and low, from the inflation calculation.
Removing a certain percentage of the most volatile items (often the top and bottom 10-25%) provides a more stable and accurate view of inflation trends.
Median CPI Inflation
Median CPI Inflation calculates the inflation rate using the price change at the 50th percentile, effectively taking the middle value of the price changes.
This approach reduces the impact of extreme price changes in either direction.
Sticky Price CPI
Sticky Price CPI tracks the prices of goods and services that are slow to change.
It excludes items with frequently fluctuating prices, focusing on those that remain stable over shorter periods.
Flexible Price CPI
In contrast to Sticky Price CPI, Flexible Price CPI focuses on goods and services with prices that change rapidly and frequently, reflecting the most volatile components of the consumer basket.
Chain-Weighted CPI
Chain-weighted CPI adjusts the weight of items in the consumer basket more frequently.
This reflects changes in consumer spending patterns and providing a more current representation of inflation.
Core PCE Inflation
Core PCE Inflation, similar to Core CPI, excludes food and energy prices from the Personal Consumption Expenditures index.
This aims for a less volatile measure of inflation to get at its trend.
Supercore Inflation
Supercore Inflation goes a step further than Core Inflation by excluding not only food and energy but also other categories that can exhibit high short-term volatility.
Provides an even more refined view of inflation trends.
Protecting Against Inflation in a Portfolio
One inflation protection stack would look like this:
TIPS / short-term TIPS
Best for normal inflation and demand-pull inflation.
Use direct TIPS or ETFs like VTIP or TIP.
TIPS principal adjusts with inflation, while VTIP gives shorter-duration exposure and has a low 0.03% expense ratio; TIP charges 0.18% and is more low/mid duration.
Commodities
Best for cost-push inflation, especially energy and raw-material shocks.
Think broad commodity exposure, not just oil or one metal.
Examples: PDBC, DBC, or commodity mutual funds.
Gold
Best for monetary debasement, currency distrust, geopolitical stress, and negative/falling real-rate environments.
Examples: GLD, IAU, or physical gold. GLD charges 0.40%. Gold futures are also a possibility.
Energy and resource equities
Oil majors, pipelines, miners, and materials companies can benefit when commodity prices rise. Higher volatility than commodities, but they can produce cash flow.
International / FX diversification
For monetary inflation and dollar weakness, own some non-US assets: international equities, foreign bonds, or currency-hedged/unhedged ETFs.
Cash / T-bills / money-market funds
Useful if inflation keeps rates high.
Gives optionality without taking duration risk.
How we got to today
To break the inflation of the 1970s and early 1980s, Fed Chairman Paul Volcker raised nominal interest rates to nearly 20 percent.
US short-term interest rates
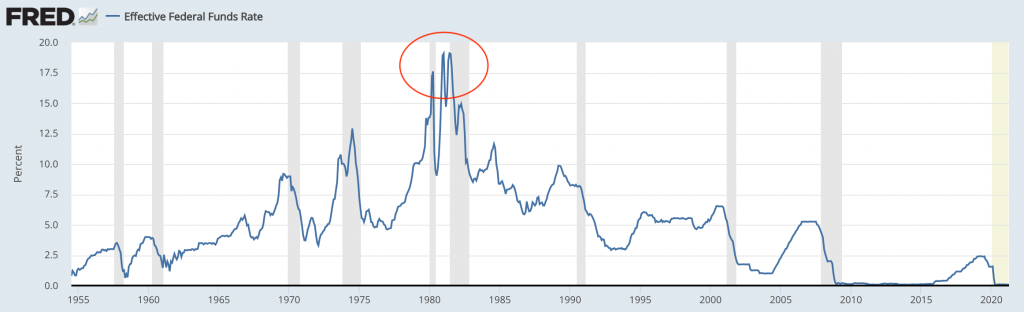
With interest rates that high, credit creation slowed. And so did spending along with it. From there, the US had a huge interest rate level from which to cut.
It also meant more control of the economy switched from the public sector (when rates were low in the 1960s, and really stemming since the Roosevelt administration in the 1930s) to the private sector.
When rates were high, the adjustment of short-term interest rates is enough to change the incentives of borrowing and lending and overall private sector credit creation.
But as interest rates were cut in each downturn, more debt relative to income piled up. Lower interest rates incentivize greater debt uptake.
That meant in the next expansion rates couldn’t be hiked as much because the servicing costs increased more readily.
For example, if your stock of debt relative to income is 20 percent higher than before, interest rates can be a similar percent lower and you’ll have the same servicing costs.
So, as the debt stock increases relative to output, you run into your constraints faster.
Then there was a debt bust in 2008. Short-term interest rates hit zero. They went to asset buying to lower long-term interest rates. This filled in the credit losses with money printing to prevent deflation.
But that policy affects the economy only indirectly. It more directly affects asset markets because that’s where the money goes.
By 2017-2018, nearly a decade after the crisis, the Fed began tightening. They got up to around 2.4 percent on the front-end of the yield curve (and not much higher on the back end) before asset markets dropped and they scrapped their plans to tighten further, lest they get deflation.
By late-2018, they realized they couldn’t tighten further because if they caused a downturn they didn’t have enough room in their yield curve to pull back out of it.
A typical recession requires 500bps of easing. If you have just 240-320 bps across the curve, you don’t have enough to pull out of it typically.
When they gave up on their further tightening plans, all of those expectations washed out of the yield curve and 2019 was a great year for asset prices.
Inflation needs to materially run above expectations before the Fed takes action
Before, the Fed was pre-emptive. If unemployment got low, they assumed inflation would tick higher even though it didn’t so by much.
All the deflationary forces, mainly the debt overhang, won out. And importantly, the labor market is no longer just people as it mainly used to be. Now a lot of it is technology that has low variable costs associated with it.
It used to be that when the unemployment rate got low, you would see inflation because there was a shortage of labor relative to the demand for it, pushing up its price (i.e., wages went up).
To offset, companies would raise the prices of goods and services. At a point, the rise in goods and services inflation would swamp the positive wage effect. The central bank would then tighten policy to curtail credit creation and perhaps bubbles.
The trade-off eventually gets more acute and difficult to handle, so they tend to over-tighten and produce a downturn, which requires an easy to pull back out of it to get more money and credit into the system. That’s the dynamic of a normal business cycle.
Because of all the debt relative to income these days, if you do tap the brakes through rate hikes, you’ll know it’ll work because it doesn’t take much in additional interest costs to increase debt servicing burdens.
But that has consequences.
Increasing demand without offsetting supply
The entire purpose of merging fiscal and monetary policy is to get the inflation rate up, and that’s what they’re seeing.
When you bring up the demand (money and credit) without the offsetting supply (production), inflation is a result, holding all else equal. That holds true for whatever the item is: labor, commodities and raw materials, financial assets.
But it can also be dangerous for both markets and economies.
In terms of financial asset prices, if they have to hike faster than what’s discounted in the curve, that’s a knock because the low rates are what underpin the valuations.
Just the mere suggestion of a faster-than-expected hike drives stocks down.
The long-duration assets are particularly vulnerable. These are mostly companies that aren’t making much profit right now, but are priced to make a lot in, e.g., 10-20 years from now. They are primarily tech companies (or viewed as tech companies).
In terms of the real economy, the major adverse effect is that the cost-of-living rises faster than paychecks.
Inflation can also be politically dangerous because it’s a regressive tax. People with low and moderate incomes dedicate more of their paychecks to cost-of-living expenses.
What to buy (or sell or do) to protect against inflation
Too many portfolios are exposed to long-duration assets, as mentioned. They are dependent on continual Fed liquidity.
60/40 stocks/bonds portfolios are one example of something that’s done well looking backward, but is poorly prepared for inflationary shocks.
Inflation can hit these assets by increasing nominal interest rates.
This creates competition for these assets by raising the yields on other types of securities, such as bonds.
Typically, traders respond to higher inflation by selling off long-duration assets. Indices like the NASDAQ, which are tech-heavy, are more susceptible than indices that are more diversified or value-oriented.
How to compensate for this?
You can tilt a portfolio to be less dependent on long-duration assets. More value over growth is one example. More companies that make money right now versus those that don’t.
There are also certain types of assets that can benefit from nominal GDP growth that don’t require constant liquidity infusions into the market.
These can include:
- Gold and precious metals
- Industrial commodities
- Real estate
- Consumer staples and utilities stocks (i.e., things that people always need to buy)
- Private businesses that consistently generate income
For hedging options, short bonds and short eurodollars (interest rate product) is a possibility.
As for what duration of eurodollars to consider shorting, what is the “sweet spot” of the curve where the Fed would need to tighten faster to control inflation.
Eurodollar curve example
(Source: Interactive Brokers)
If, for example, you’re in an environment where inflation is going to be structurally higher and only two 25-bp rate hikes are priced into the curve over the next two years, you might view that as quality reward-risk.
There’s not a lot of downside (you can buy eurodollar calls to protect against the possibility negative interest rates; they’re very cheap). If you own a lot of long-duration equities, it’s more important since all those assets are vulnerable to a faster rate-hike cycle, which is a possibility with a faster-than-normal policy response.
In a traditional portfolio, you’d generally want to be long bonds to offset the fall in cash flows when growth falls.
But when the room left in the yield curve is so low and you’re in an environment where fiscal and monetary policy are merged, it’s a different playbook.
You have to hedge against the possibility of stagflation. This is when inflation is higher but growth isn’t that great.
This isn’t ideal for stocks, as they benefit most in an environment that’s good for growth but with low to moderate inflation.
It’s not great for nominal rate bonds because inflation feeds into higher rates (yields), which decreases their prices.
So, things like gold, inflation-linked bonds (ILBs), consumer staples stocks, and industrial commodities can do well in these circumstances.
Policy right now gives you cash flow assets (because of high nominal GDP) that are better than bonds, but they’re extremely vulnerable to a compression in their valuations if the liquidity is taken away and/or inflation heads higher.
Countries that will benefit include those that won’t be as affected by price pressures – e.g., wage pressure, commodities pressure, tax pressure.
In other places in the world outside the US, you don’t have as much margin pressure.
The stocks that are going to benefit more from growth rather than liquidity are primarily going to come from outside the US.
Within the US, given the policy mix, it’s largely a function of where the liquidity goes that’s going to benefit.
This is a function of the way the policy levers are being moved so differently among countries.
Most traders and investors are heavily overweight the US both on the equities side and the bond side, even though forward returns will necessarily be lower in the US.
So diversification is always important for limiting big losses, but is more important than normal.
It’s important to have enough assets that can benefit in a stagflationary environment, to a reflationary boom, to something like a Japanification scenario where economic stagnation and weak market returns take over.
Extrapolation issues
There are many in the market who haven’t experienced or don’t remember a 10-year Treasury yield of more than four percent.
Some believe Fed policy will do whatever it takes to keep yields low.
At the same time, the policy response to the 2020 crisis was several magnitudes faster than the 2008 response.
In 1929, it took nearly four years for stocks to bottom because the situation was so different from the previous recessions and “panics” they had experienced.
In 2008, it took around 18 months after the top to hit the bottom, and about 5-6 months after the worst of it in September and October 2008.
In 2020, it took about four weeks.
And you can see the speed of the policy response in the real economy to an extent.
So, if people are accustomed to bonds moving very slowly could be surprised by the extent that bond volatility will have to pick up to some extent.
The US is spending a lot, which means financing those deficits with bonds, which means lots of new supply coming on the market over time.
And the free-market buyer isn’t going to want all that trading at negative real yields, which means more of the burden will be on the Fed to print money and buy the bonds and weaken the currency, holding all else equal.
Fiscal policy is much more important than it traditionally is while the interest rate cycle’s influence on the private sector, controlled by the Federal Reserve, is less important.
You could observe an accelerating economy in nominal terms, and interest rates and bond yields getting pulled up by that, and the Fed lagging that.
That could hit financial markets before it hits the economy (via the pass-through of higher credit costs).
Will the Fed lag the economy?
It’s expected that they will accept a higher inflation rate. They’ve learned that being pre-emptive generally has bad consequences with Q4 2018 being the latest example.
Yet, the market doesn’t expect much tightening out over any period. Even into the 2030s, traders don’t expect the fed funds rate to get much above 250bps.
That’s a risk to markets because financial assets are priced partially off the risk-free rate. If rates need to go up faster than what’s discounted into the curve, that’s a drag on asset prices, all else equal.
So, by and large, the market is unprepared for this. This could make the aforementioned hedge of short bonds or short eurodollar futures a quality hedge against risk asset exposure, especially of the long-duration variant.
There’s also a limit to how low interest rates can go (about zero) and no real limit to how high they can go. In 1977, nobody expected interest rates to be at almost 20 percent by the early 1980s because they were still under 5 percent.
In other words, rates were hiked nearly 15 percent in just 3-4 years.
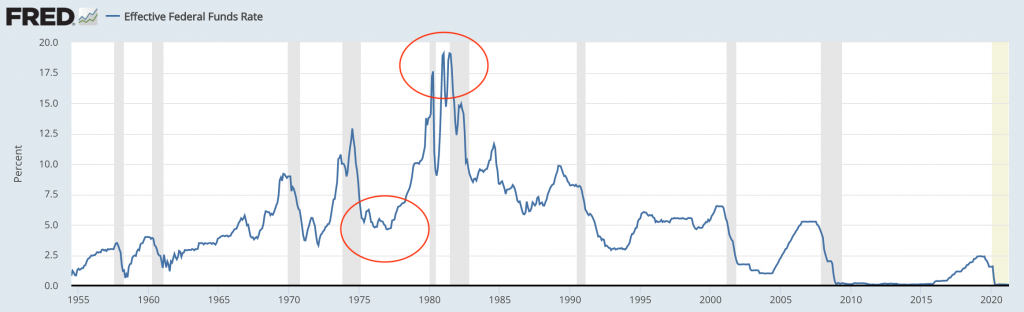
(Source: Board of Governors of the Federal Reserve System (US))
Another important factor is that as interest rates go low, it lengthens the duration of financial assets.
So the initial rise in inflation and rates is the most influential on asset prices, given that’s when they’re most sensitive to each incremental shift.
If you think of a yield on an investment as the number of years it takes to get your money back – e.g., 2% = 50 years, 1% = 100 years, 0.5% = 200 years, and so on – you can see that as yield declines, the duration lengthens in a steepening, non-linear way.
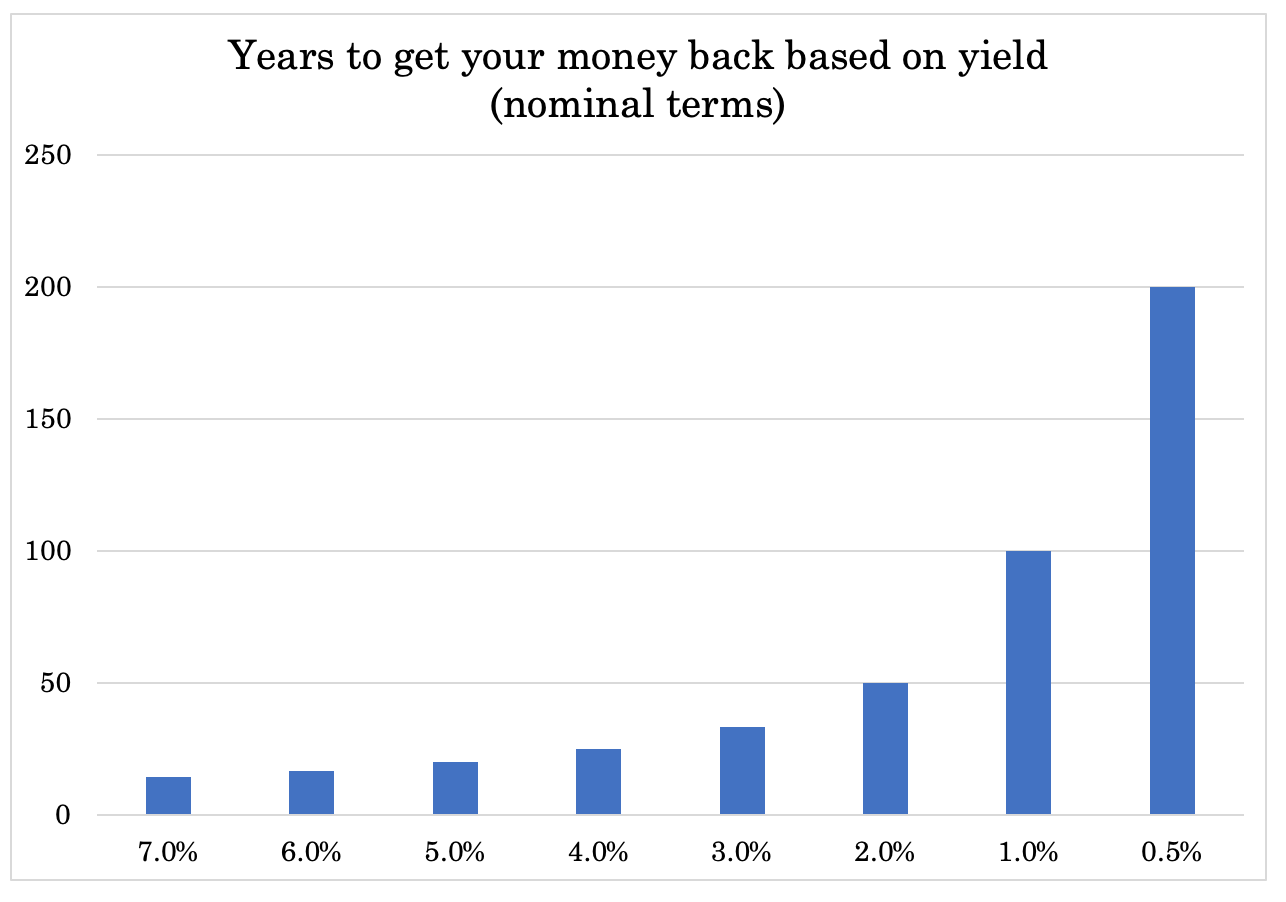
Central bank policy has driven earnings multiples to very high rates. In recent years, multiples on US stocks have been anywhere from 20x to 30x.
That means if you put up a lump sum, it’s going to take you an expected 20 to 30 years to get your money back.
The longer that timeframe is, the more interest rate-sensitive those assets are going to be. So, traders need to be wary of assets with a very long duration in their cash flows and are highly dependent on further liquidity.
Short bond and short rate positions can help offset this along with the things that can do well when nominal growth rises.
There is significant pent-up demand in the form of higher savings rates, which flow directly into spending and create a lot of demand.
There will be some real GDP out of that, but also price pressure due to shortages.
The ‘need’ for more inflation
The level of IOUs in the economy through not only debt, but non-debt (but cash flow-driven) obligations like pensions, healthcare, and other unfunded liabilities, is north of 15x GDP.
Those are never going to be paid back through income – which is productivity.
And you can’t feasibly default on them. So there needs to be more money printed to fill in the gap.
On top of this, there’s so much division in the country along various lines – economic, social, political – that policymakers are incentivized to be more stimulative to help paper over these problems.
Money printing itself causes problems.
When money can be printed, there will be enough money created to service the debt. The trade-off is that the value of money will go down.
Currency devaluation through the printing of money is a type of hidden tax. It also tends to stimulate nominal economic activity and certain types of assets like stocks, which see their values rise if done at a sufficient enough level to offset any economic destruction that might be occurring.
So generally in the short-term money printing is beneficial, especially if you have a reserve currency. This means there’s a lot of demand to save and transact in the currency, which means you can sell debt to fund your deficits to the extent that such debt is wanted.
Because money printing gives a short-term jolt, it’s much more politically palatable than taking debt problems through lower incomes and/or lower spending, which causes social conflict and worsened living standards.
Money printing is necessary in a shift away from a deflationary/net disinflationary policy, but we’re in an entirely new environment with new risks.
Most market participants weren’t around when these types of policies were last employed, so they may be more likely to extrapolate the more recent past, which occurred based on different policies which have different effects.
Central banks will push these policies until they cause problems (inflation, currency devaluation).
Central bankers don’t seem concerned about inflation. Should they be?
The power of monetary policy and hiking rates will still work.
There’s a lot of debt and hiking the rates will cause the debt servicing to go up in a way to direct spending out of goods and services, depressing any inflationary move.
But it’s a matter of whether they want to given the trade-offs.
Looking in retrospect, monetary policy of the 1970s looks foolish, but there were trade-offs that had to be made at the time.
With things like oil shortages, that led to them letting the inflation rate go higher. On the flip side of the coin, if they hiked rates sooner to corral inflation, unemployment would have run higher and the economy would’ve contracted.
Difficult alternatives
With the social problems and with asset prices are where they are and what inflation would do to them, inflation is viewed as a better trade-off – to a certain level – than tightening policy.
Income needs to be generated to support those asset prices. In the end, assets are only worth the discounted present value of their future cash flows.
Supporting a higher structural inflation rate is one way to keep asset prices good in nominal terms even if they aren’t great in real terms.
So you either need a lot of productivity to support asset prices at nosebleed levels, which is very unlikely. Or you need more nominal GDP through things like money printing (which is inflationary, holding all else equal).
If you don’t get that, then you get lower asset prices. You can also get a weaker economy, which brings with it lower living standards and increased social conflict.
Asset prices at around 25x earnings (income) or higher has only a few comparable periods in US history:
- 1910
- 1929 (consumer bubble)
- 1965
- 2000 (tech bubble)
1929 and 2000 resulted in lower asset prices.
But 1910 and 1965 were absorbed through higher inflation.
While asset prices trading at 25x nominal earnings aren’t likely to do well in real terms, it doesn’t necessarily mean they have to be bad in nominal terms. Nominal GDP can catch up to the assets.
On the other hand, if the Fed (and other developed market central banks) withdraws liquidity, that has a big effect on asset prices, especially with their durations making them more sensitive to that.
If they don’t withdraw liquidity, then higher inflation will be the result.
So they need to make that determination between how much they want to show up in inflation versus how much they want to show up in asset prices.
Higher inflation tends to hurt lower earners more than lower asset prices. Will they think of it from a income or wealth gap standpoint?
At the same time, a negative impact on asset prices has a negative feed-through into the economy. Financial assets provide the money and credit that go into creating the products and services that comprise the real economy.
And lower asset prices feed into lower wealth, lower creditworthiness, and lower incomes.
So it’s a difficult trade-off even from that perspective. Inflation will be tolerated but only to an extent. A four percent CPI could potentially become more normalized than two percent.
A higher inflation rate also helps “burn off” some of the fixed-rate debt. It delivers poor real returns to creditors, but creates relief for borrowers. In a situation where debt is high relative to income, it’s natural for policymakers to favor the borrowers.
There’s no easy way out and trade-offs will become more acute over time.
Tapering to rein in inflation
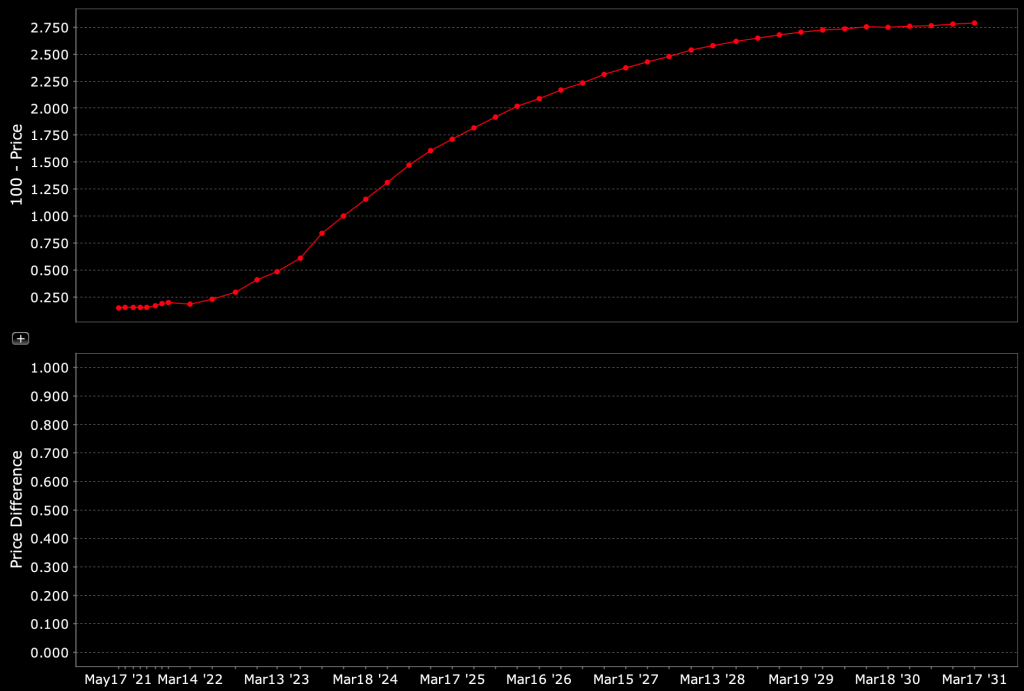
Generally, to check and see where rates are priced to go over time, you can look at the fed funds futures markets, out about five years.
Fed funds futures curve
To look even further out, you can look at eurodollar futures, out about ten years.
Eurodollar futures curve
Some standard brokers carry both of these interest rate products to trade, such as Interactive Brokers.
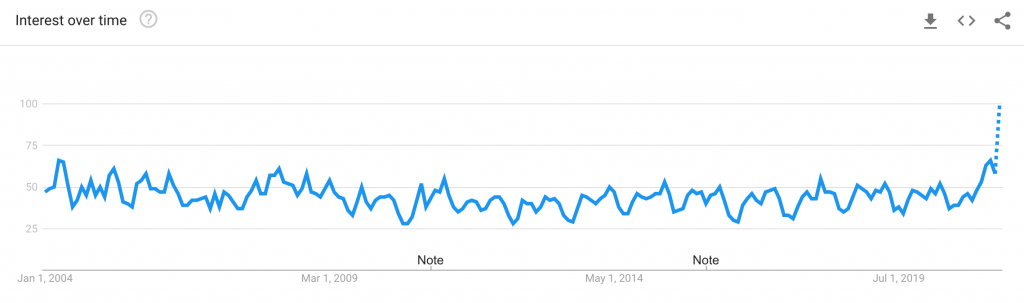
Inflation is always discussed. Why is inflation more popular now?
Inflation is receiving mainstream attention, even outside the trading, investing, and financial community, as evidenced by Google Trends.
Google Trends: ‘Inflation’ search popularity (2004-present)
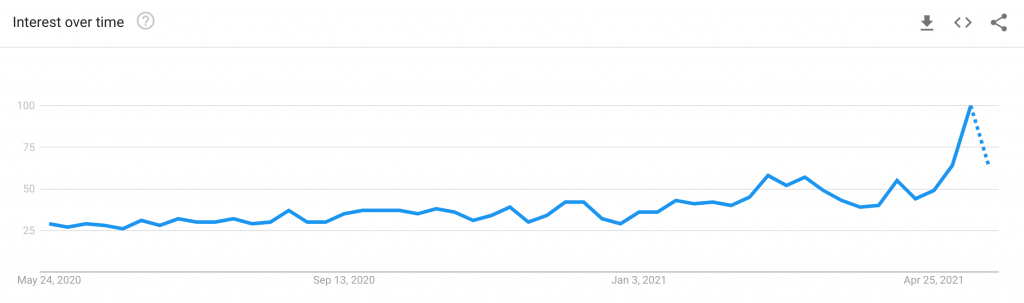
Google Trends: ‘Inflation’ search popularity (2020-2021)
We’re seeing some of the largest nominal growth gains in a long time.
There’s a lot of pent-up demand and lots of government stimulus. Savings rates rose substantially.
Now that’s we’re in a period of merged fiscal and monetary policy – rather than just working through interest rates and quantitative easing along – that stimulus can move more easily into goods and services inflation.
It’s not unfathomable to take this mix and have four percent unemployment, 8+ percent nominal growth, and growing wages.
When facing those conditions, you also don’t have much tightening priced in within the interest rate curve. So policymakers have difficult decisions to make.
On top of that, the growth isn’t going to be that driven by monetary policy but rather by fiscal policy. And there’s more spending still in the pipeline.
So economic growth isn’t as interest rate-driven as it normally is. There’s the risk of tightening on financial assets – if done faster than what’s discounted in the curve. But not as much in the real economy if so much activity is driven fiscally rather than by the interest rate cycle that normally dictates private sector outcomes.
It could be a situation where you have very low interest rates yet the economy continues to surge ahead.
Asset allocation decisions: Thinking in terms of spreads
When interest rates across the yield curve are 0 to 2 percent, and if nominal GDP is, for example, 8 to 10 percent, that’s a wide spread.
That means you can effectively borrow at those super low rates by borrowing cash or shorting bonds of some duration and capture a return that’s much higher somewhere else.
That represents a big opportunity.
You don’t want to stay in cash or bonds if they only yield zero or a bit above when you can go and get something giving you close to 10 percent, for example.
Then it’s a matter of what is that thing.
Traditionally, it meant having at least some bonds.
But the Treasury, for a long time, is going to be issuing 10-15 percent of GDP in bonds. The Fed is buying about half of those to prevent yields from rising and support the economy.
When the yields are negative in real terms, then who’s going to want to buy negative real yield bonds? There’s a shortage of private buyers, so it means more buying from the domestic central bank.
When you have inflationary conditions, they’re going to want to taper.
Then they’re going to have to fill that gap that they’re no longer buying – i.e., the shortage of buyers – then they’re going to find out how hard it is to do that.
So it’s a period that’s generally bad for bonds and cash. It can also be difficult for long-duration equities that depend on low interest rates and relatively mild inflation.
Which assets can do well when inflation runs above normal and in conditions where nominal growth is low?
Real growth isn’t likely to be very high because productivity growth rates are quite low.
So, stagflationary conditions are more common.
Assets that could excel, include things like:
- Gold, precious metals
- Industrial commodities
- Agricultural commodities
- Certain private businesses
- Stocks not overly dependent on rate hikes or cyclical cash flows (e.g., consumer staples, utilities)
- Certain types of real estate
- Inflation-index bonds (to an extent where you can get CPI)
- Assets in different countries and different currencies without these problems
- Cryptocurrencies (smaller amounts ideally because of their volatility)
Overall, the implications for markets are probably going to be more important than they are for the real economy.
Will the Fed be less sensitive to market convulsions?
Market participants are so used to central banks coming to save them if assets go down.
This was because in an interest rate and quantitative easing regime, assets are more sensitive to central bank policy. And asset markets are largely how policy is carried out.
But if policy is carried out more through fiscal channels and less through asset markets, the Fed’s reaction function could change.
So you have the possibility the Fed won’t be as willing to backstop the liquidity if the market turns down.
The economy rising and the markets falling is a possible and normal outcome.
Markets discount future conditions. The discount rate is based on nominal interest rates, which are a function of nominal growth rates. If nominal growth rates rise, that adds to GDP, but it can decrease the present value of future cash flows through the higher discount rate.
A bad situation for the markets is a strong economy that doesn’t require as much liquidity, which is what the markets are reliant on (especially long-duration equities).
Markets and economies have different drivers
It’s too heavily thought that markets and the economy are tied together. But what’s good for the markets isn’t always good for the economy.
Markets began rising in March 2020 out of the crisis in the US and many other markets. But the economies remained bad for a while longer.
Just as strong economies can be bad for markets if it believes reduced Fed or central bank support for the markets.
When liquidity comes out and more money is spent in the real economy rather than in financial markets.
A big point of differentiation will be the types of assets that require continuous liquidity and low interest rates to make sense relative to those that don’t.
Stocks that have a very long duration to their cash flows are one example of assets that require continuous liquidity support. Gold, precious metals, and commodities are examples that don’t.
In general, what are the assets that benefit from a high nominal GDP growth and those that get hurt from lower liquidity and higher inflation and/or nominal rates?
High liquidity environments and bubbles
More money and credit entering the system makes it more likely that bubbles will form.
This is when assets become too high relative to their underlying values. For a stock, this might mean that prices go too high such that their underlying cash flows don’t support it.
Stocks are the most prone to distorted perceptions of value because they’re not as “concrete” as other asset classes like bonds and interest rates.
Stocks are perpetual cash flow instruments, so there’s no real objective measure of what it should be worth from a notional fundamental equilibrium perspective. Unlike bonds where you have a defined amount of money to pay out to determine its value or an interest rate being at a certain level by a certain date.
So, to define a bubble, what is the measure and how reliable is it?
- Are prices high relative to traditional measures (e.g., P/E)?
- Are prices discounting unsustainable conditions?
- Are there lots of new buyers in the market?
A lot of people get attached to investments as being “the next Amazon” but few of those expectations are met.
Early investors tend to do well for those that capture the narrative as the discounted expectations build, but later investors tend to perform poorly.
That’s just one example of discounting unsustainable conditions. It’s very unlikely we’re going to go from two percent of companies growing at 20 percent per year to ten percent growing at that rate.
Macro-level bubbles
The big restraint, as mentioned, is currency devaluation and inflation.
Deficits need to be financed and many international buyers aren’t going to want to hold a lot of that debt. Dollars are already over-owned relative to what entities would want to hold based on various long term economic measures:
i) The size of the US debt markets’ capitalization relative to the capitalization of other markets
ii) The size of the US economy relative to the world economy
iii) The reserve currency holdings that would be suitable to meet the needs of trade and capital flow funding
iv) The asset allocation that international investors would hold in other to balance their portfolios in a prudent way
USD-denominated debt is large in relation to all these measures. The dollar is perceived as a safer asset than is justified and USD borrowings are disproportionately large.
Reserve currency status falls with a lag relative to the overall empire’s decline. Often, but not always, a better system is devised first, such as a new global reserve currency.
Reserve managers, central banks, and others responsible for determining what share of their holdings should be in what markets and what currencies are not going to be inclined to increase their share of USD reserves in line with the larger amounts of US bonds that need to be sold.
They’ll want to shift into other things, which could include more hard assets, like commodities.
In fact, many are considering reducing their exposure to US debt outright. If this happens, it will require more purchases of this debt by the Federal Reserve.
And geopolitically, anybody saving in the US dollar (through US debt) realizes it’s a risk. If the US needs more dollars to meet its obligations, it will print them. That’s not good for the real value of those investments.
The duel forces in a change in where money is saved and increased money creation likely to lead to a decline in the US dollar as the world’s top reserve currency. This will likely occur over decades, not in a short time horizon.
As fewer want to save in dollars, the lower interest rate effect that comes from this demand will decline. This makes US policymakers’ trade-offs more acute.
QE as a deflationary force
In 2009, when QE began, many feared that it would be inflationary. But the goal of QE – once interest rates hit zero – was to create money to help offset a deflationary credit contraction.
It’s the total amount of spending that influences where prices go. If the amount of credit contracting is greater than the amount of money being created, then prices will fall.
Printing $5 trillion, for example, isn’t inherently inflationary if the amount of credit that fell is at least that amount.
You will sometimes see the argument that an increase in the money supply is likely to be inflationary, but it’s not about the money supply. It’s about the aggregate amount of spending (money and credit) in whatever the thing is relative to its supply.
Ultimately QE wasn’t very inflationary because of the offsetting force of the credit contraction, plus the fact that not a lot of the money went into the real economy.
The money went into financial assets. So, there was a lot of inflation in financial assets but little of that new financial wealth went into goods and services.
In other words, reflations don’t necessarily cause goods and services inflation (typically measured via the VPI) because they can simply negate various forms of deflation.
The extent to which this occurs depends on how far they are taken and where the money goes.
On the other hand, when you move into an area where monetary and fiscal policy are merged, where you’re transferring money to those with the lowest earnings and savings rates, doing infrastructure spending, and more direct spending, it’s a totally different thing.
Many of these policies create demand in the real economy without creating supply. If there’s no new supply associated with that spending, then you have that mismatch.
A lot of it depends on the direction of fiscal policy, as that’s the main channel. If politicians are less willing to spend, then it’s a different story on the inflation outlook and the risks diminish.
But the policy framework now is very different relative to putting the money into asset prices and the effects on inflation.
There is a lot of good that can come out of that, but the mechanics are much different.
The 1970s vs. now example
Inflation went from something that seemed more transitory to something more permanent when oil shocks occurred in the 1970s.
The Fed figured that tightening into an oil shock wasn’t prudent, so this led to a more permanent nature to inflation.
Similarly, the Fed doesn’t want to tighten much into an economy that’s relatively fragile with high liabilities.
Technology as a deflationary force
Technology has been a notable deflationary force. It provides process improvements and can reduce the need for human labor in some respects – and increase it in others.
Technology mostly impacts lower-skilled jobs through automation, though it improves productivity for the whole. Like many things, some benefit and some don’t. Sometimes the benefits accrue to a small part of the population, which can increase “gaps” (wealth, income).
Technology has been one of the main deflationary/disinflationary forces on net since 1981. Altogether:
Central bank policy
Real yields went very high, money came into the country to capture those, which enabled the Fed to ease interest rates without stoking inflation.
Globalization
Offshoring and globalization enables production to be located where it’s most economical. This helps to decrease wealth gaps between countries but expands them within countries because of the disadvantages faced by some blue-collar workers.
Low interest rates and a pro-corporate environment
Unions have declined in popularity in the US since the 1960s. Corporate tax rates have also come down – not only in the US but globally. If companies have more retained earnings, they’re worth more.
But the world is changing.
The last three – central bank policy, globalization, and the pro-corporate environment – are all changing.
That leaves technology as the main deflationary force.
Can that also change?
We know that the semiconductor industry is becoming more concentrated and less competitive. Now you have three main companies instead of 20-plus. It’s not the competition it once was. It’s more of an oligopoly.
Now instead of minimizing operational costs, countries are looking more toward self-sufficiency.
That’s a risk from a geopolitical perspective, given semiconductors feed into many new important technologies. And whichever country is superior technologically tends to be superior in most other ways. There can be disruptive price pressures there.
There are still many deflationary forces in technology with AI and new inventions.
From a policy standpoint, the deflationary effects of technology go toward the benefit of few – e.g., shareholders and those it helps become more productive.
So they’re more likely going to want to transfer it to the benefit of many, by using that net deflation and printing the money and spreading it more widely through various programs.
Like with money printing in general, a little bit of it can be good. Increasing money in circulation is always necessary to meet the needs of trade. But too much of that can lead to an addiction and the consequences that come with that – e.g., currency devaluation, inflation, balance of payments issues.
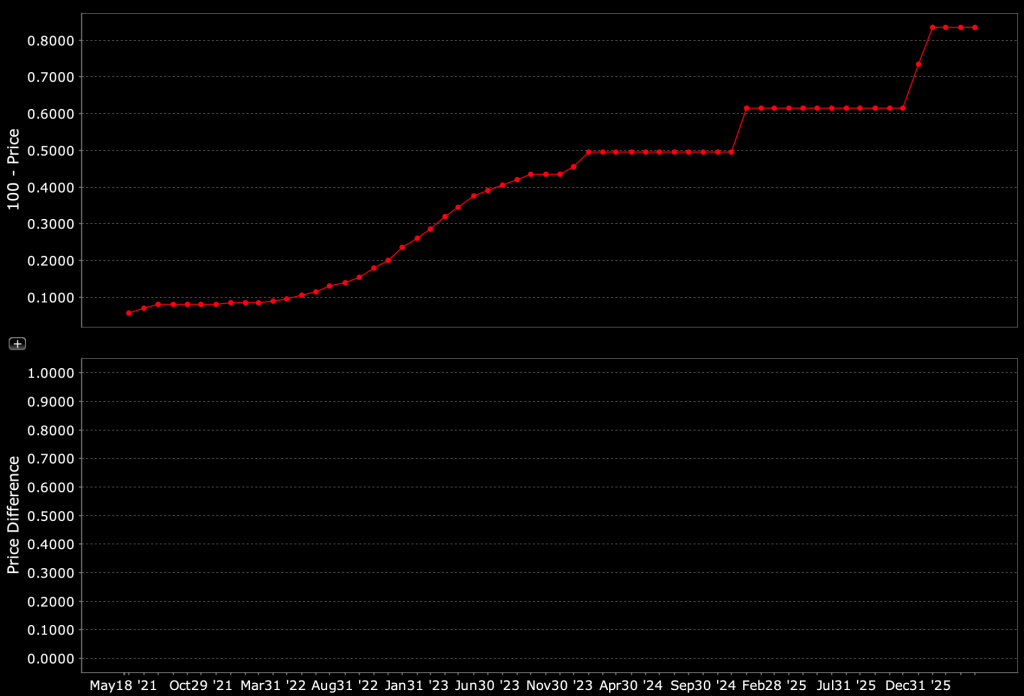
Quality adjustments to inflation
The CPI is not just nominal price adjustments of a fixed basket of goods. Some are quality-adjusted, sometimes called “hedonic quality adjustments”.
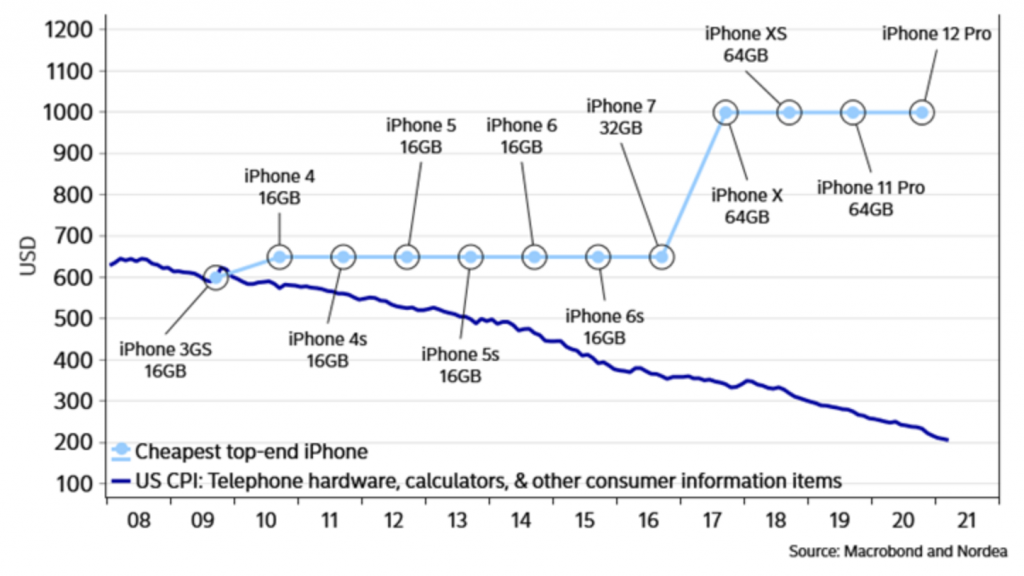
Cell phone prices are a common example of items that are quality-adjusted in the CPI.
Mobile phone technology improves over time. You get more CPU per dollar. In the inflation data, it’s measured as the CPU power per dollar rather than just nominal prices.
Over time, you’ve gotten better phones for the price even if the price of an iPhone went from $600 in the late-00s to $1,000 or more by the early-2020s.
Accordingly, telecommunication devices have been primarily a deflationary force on CPI.
Will this continue?
With supply chain issues on important telecom components becoming more of an issue with geopolitical competition and less private sector competition/industry consolidation, will technology continue to outpace nominal price increases?
If that’s not the case, then cell phones and other consumer electronics may not work as a deflationary force in the same fashion.
The price of a new phone in nominal and hedonic quality-adjusted terms
Demographics
Demographics are commonly talked about, as they commonly have a deflationary influence.
An aging population has fewer workers and changes spending patterns (which can be deflationary in some ways and inflationary in others).
Demographics also change heavily based on where you are in the world. Demographics are changing at a different rate in India relative to where they are in Japan, developed Europe, or the US.
They’re a net inflationary tailwind in younger countries – that may have other forces like more women entering the labor force – and a net deflationary one in older countries.
On average, the deflationary influence of demographics isn’t as much so with a lot of the demand shifting toward the developing world.
At the same time, if you’re cutting the labor force relative to the aggregate demand – the amount of spending needed to support all people – that is net inflationary in many respects. You have the demand without necessarily offsetting supply to compensate.
In another example, if you take Japan, they had a lot of housing stock to support a certain level of the population. But as the population declined you had a lot of excess capacity in housing (supply) relative to the demand, so prices fell and you had deflation.
So it’s a mix.
Policies can also help offset any deflationary force.
In the Japan example, some might say that Japan ran large budget deficits and ran QE. But Japan did nothing like what the US is doing now where they engaged in large fiscal spending with direct monetary support.
Many of the deficits Japan was running were due to low tax revenue, not high spending. The amount of money and credit being put into the real economy relative to supply was not sufficient enough to generate inflation.
So, the source of the deficit matters. And how much was printed matters. So the policies were much more subdued in how effectively they could generate inflation.
Inflation is often discussed in an overly simplistic way
When we talk about inflation… inflation of what?
It can be overly simplistic to talk about “inflation” because “inflation” is an average of many things with different weightings that behave differently from one another.
For instance, when an economy is depressed, during the reflation process when central banks are pumping lots of money and credit into the system to get it going again, there is very little or no inflation in the price of labor and assets used in production (such as equipment).
On the other hand, you will see inflation in assets that benefit from the consequent decreases in the value of money/currency (e.g., commodities, gold, many types of stocks, etc.).