Japanification: Will the US and Europe Follow Japan’s Economy and Markets?


Japanification, or Japanization, refers to the idea that other developed markets are at risk of following Japan in its low-growth and low-inflation pattern that has characterized the decades following the popping of the country’s 1989 bubble.
Japanification is also often called secular stagnation.
Japan has lots of debt, negative population growth, and sagging productivity growth rates. This mix has held its growth and inflation down.
Japanification might be an increasingly less anticipated outcome for the US economy, as it makes up for lots of lost capacity. But another “big sag” is likely.
Even with all the inflationary elements (low interest rates, QE, fiscal stimulus), there are still plenty of deflationary influences:
- High debt relative to income (i.e., if debt has to be paid it diverts away from spending in the real economy)
- Aging demographics (not enough workers, producing increasing obligations relative to revenue)
- Offshoring production of various forms to more cost-efficient places, a drag on domestic worker salaries in countries where workers are more expensive
- Technology helps increase economy-wide pricing transparency and reduces reliance on expensive labor
- Over time, in the US, there’s been a lower role for unions and organized labor
After all the big picture influences we’ve discussed in other articles…
- zero percent interest rates
- QE
- unified fiscal and monetary policy
- more geopolitical conflict
- more capital flows from West to East…
…policymakers could end up with a large debt profile with not much to show for it in improving actual productivity. As a consequence, that debt pile can become disinflationary.
In this Japanification scenario, bond yields sag, equity markets falter, and it has negative effects throughout the system.
If bonds don’t provide any income and equities provide negative returns, this is terrible for many different parties in the economy, from companies to retirees/pensions to the real economy.
When asset prices have been pulled so far ahead with low interest rates and asset buying, they can reach such a level that can cause years or decades of negative overall returns.
Japan, for example, saw its Nikkei 225 index decline after its 1989 top, and has yet to re-achieve those highs.
Japan has seen its nominal growth (real growth plus inflation) go down to around zero over time, so there’s little return in asset prices.
In the United States, considering the hurdle rates pension funds need to keep those systems going and all the demands on the system now because of wealth gaps and other types of gaps, it would make for large political and social unrest.
What characterizes Japanification
Despite Japan’s more than three decades’ worth of extraordinary fiscal and monetary stimulus, it failed to get the country out of its anemic growth and disinflation/deflationary trend.
You know you’re in a Japanification scenario when your sovereign mid-duration bond yields are right around zero. Japan practices yield curve control to prevent them from going negative and hindering bank profitability, or too high and increasing borrowing costs.
Japanese bond yields
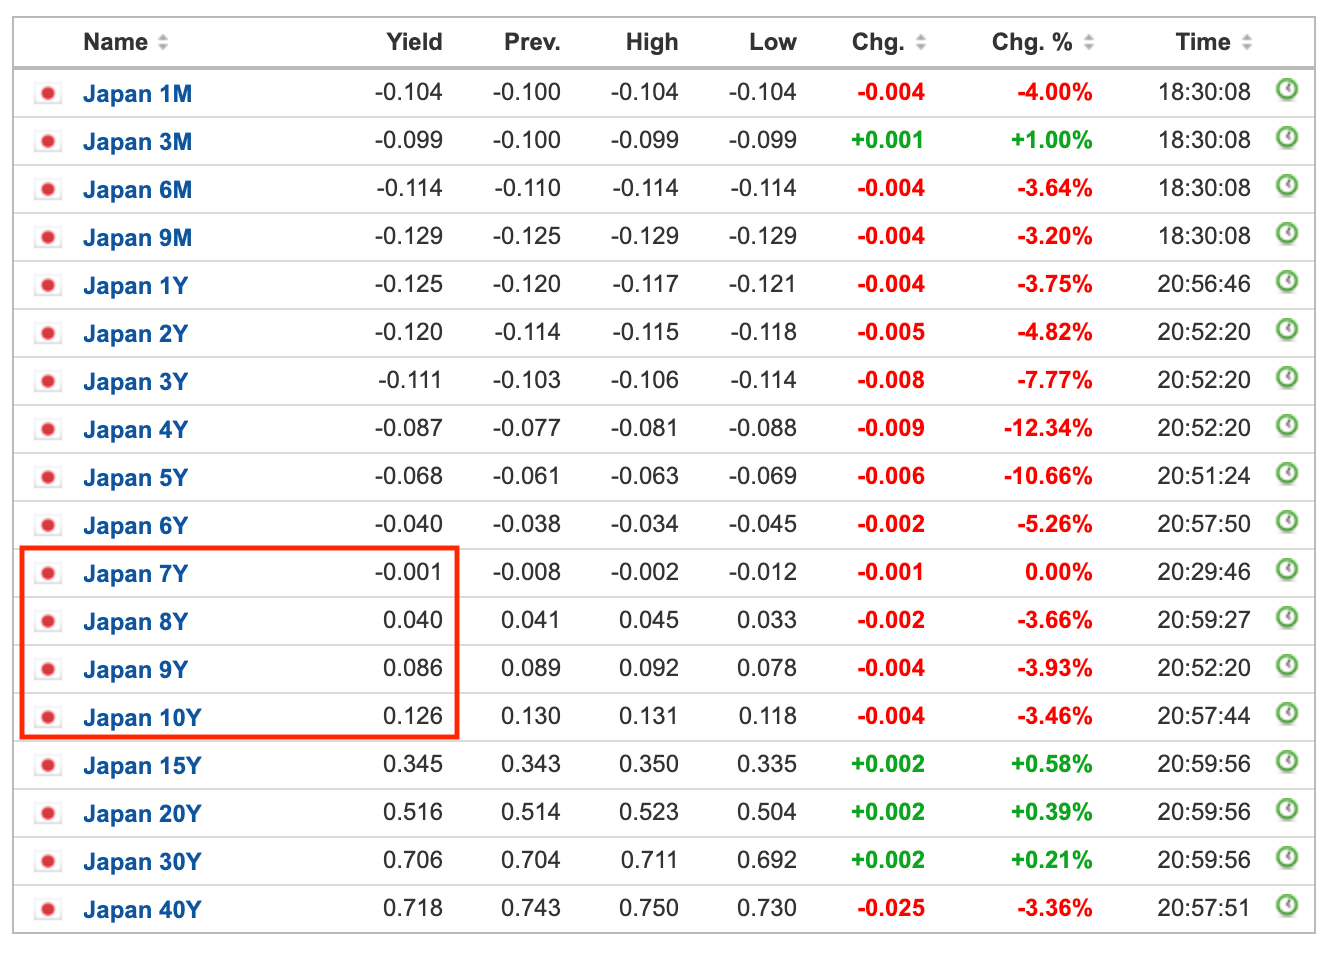
(Source: investing.com)
A 10-year government bond, a common benchmark in any market, yields about 150bps as this is written in the US, about zero in developed Europe (each market is different), and zero in Japan.
Those are the main three reserve currency areas globally and each suffers from the Japanification scenario to some extent.
The US has generally had an advantage over Japan and developed Europe because it has an overall younger population and higher productivity rates from tech being a bigger part of its economy.
For example, the US stock market has generally had about 25 percent of its market cap weighted by tech, compared to only about 5 percent for developed Europe.
For this reason, we’ve seen higher nominal growth and nominal yields in the US in comparison to Europe and Japan. This gave the US an advantage for capital and investment flows.
Europe and Japan have older populations, where the number of workers is tapering off or even going backward.
The US also has the world’s reserve currency, which can be an advantage (i.e., cheap borrowing) if it’s employed well.
Europe, on the other hand, through the euro (which most countries are on) is a weakly structured currency where countries with dissimilar economic characteristics are tied together. This leaves the currency too weak for some countries (e.g., Germany) and too strong for others (e.g., European periphery).
The Japanese yen is a little bit of a reserve currency (e.g., about 5 percent of global reserves), but is not in wide demand outside of Japan.
Japanification risks outside the developed world
China is the world’s second-largest economy and has the productivity rates and population to become the top economy in terms of GDP.
But it also has a large debt pile and older demographics that could cause secular stagnation similar to developed economies.
But its growth rates are still relatively high, as their technologies are developing rapidly and their GDP per capita will get closer to the developed world.
As of the early-2020s, China’s GDP per capita is still just 1/6th that of the US and about 1/4th that of the euro area’s and Japan’s.
Eventually, those incomes will get more in line and help bring along the RMB as a reserve currency.
In China, which now represents a compelling alternative investment universe to the US and other developed markets, the 10-year bond is around 3 to 4 percent.
China has more room to work within the traditional monetary policy framework with standard interest rates policy still effective.
China is a big lure for international investors looking to gain access to new sources of investment returns. Especially considering the lack of yields – particularly real/inflation-adjusted yields – in developed markets where many are submerged below zero.
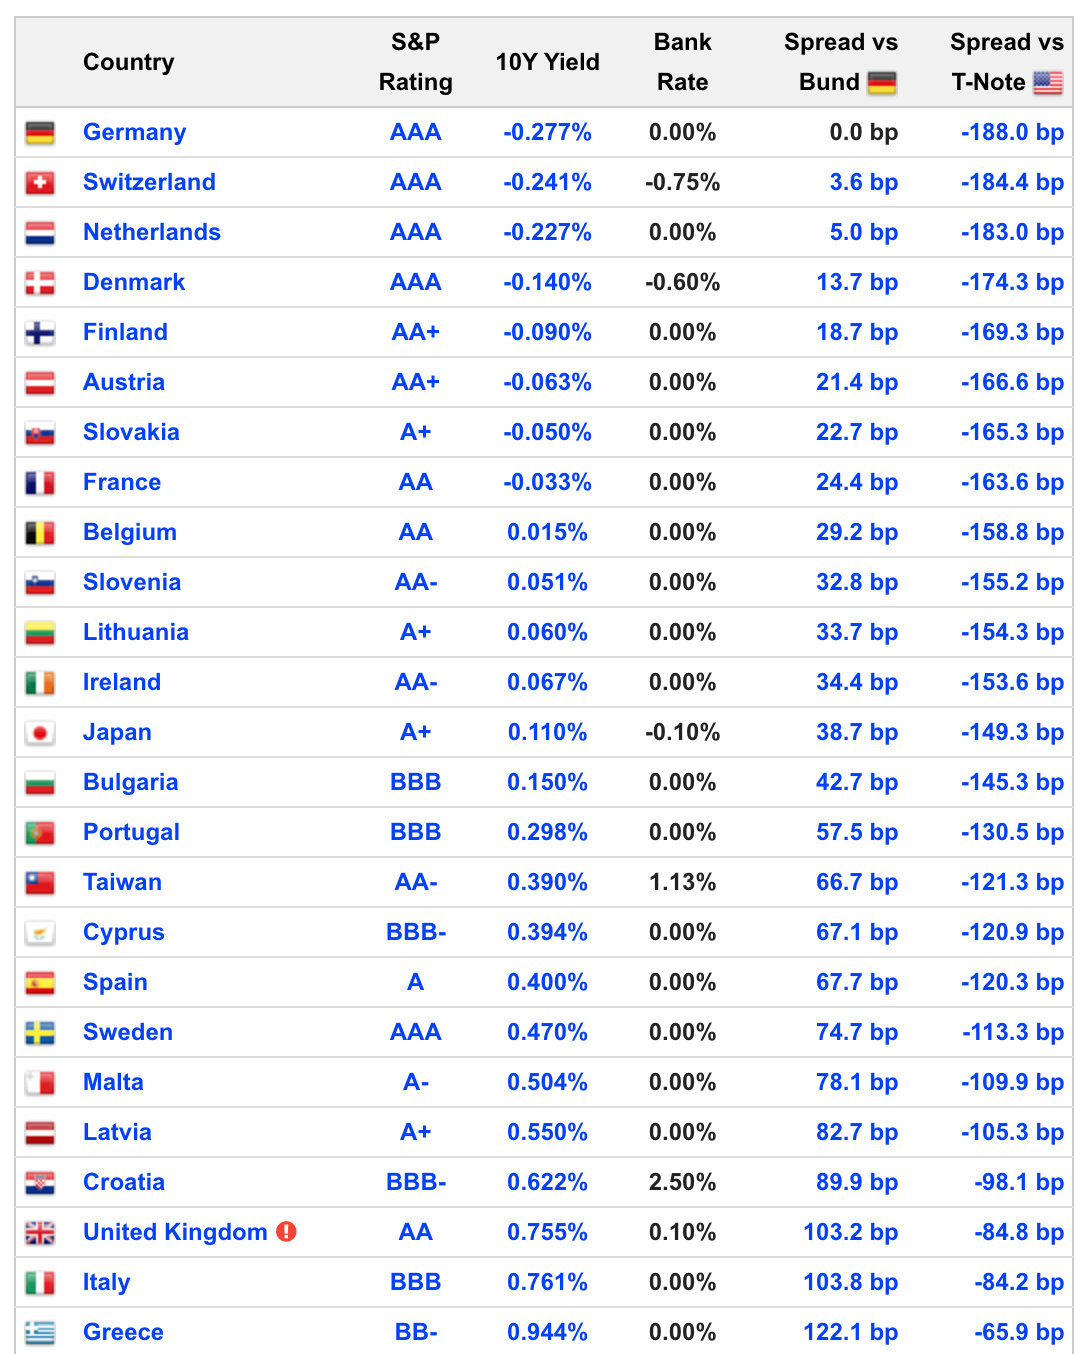
Countries in sub-zero yield territory include eight developed European countries.
Another eleven yield under 50bps (half a percent).
Twenty-five in total yield less than one percent.
That includes many with weaker credit ratings, which means credit risk is a concern as well. This includes countries like Bulgaria, Portugal, Cyprus, Croatia, Italy, and Greece.
The US has been viewed as one of the last remaining vestiges of positive yields when everything else won’t give any return.
At times, the US has been around 95 percent of the world’s available positive-yielding sovereign debt.
Japanification implications for investment managers
Pensions and insurers depend on a certain yield from fixed income. When that goes down, they’re forced to innovate in some way to get those returns.
That’s not easy to do, though pension funds could certainly benefit from having more balance to improve their return-to-risk ratio.
So that may mean taking more risk by getting into more defensive equities and seeing what can be had through offshore fixed-income markets (while hedging back into domestic currency).
Stocks are priced off the present value of discounted cash flows.
Over time, the yield on stocks is about 3.6 percent more than the 10-year bond. And this 10-year bond is generally giving you about 2-3 percent more than cash. Stocks have returned six percent annualized over cash since 1972 at an annual volatility of 15.6 percent.
If we apply these rates to today’s world, where cash is zero and bonds are 0-2 percent in most of the developed world throughout their yield curves, you’re looking at stock yields of only 3-5 percent.
That also assumes inflation will remain around two percent. They could be higher or lower depending on where inflation goes. Under moderate inflation, stocks should do relatively well holding their value.
Because of stagnation, cash and bonds are basically now funding vehicles rather than investments.
So all the newly printed money goes into stores of value and, when those risk premiums become compressed, eventually out of the country.
If we look at the returns of US stocks, the US 10-year, USD cash, and gold (another store of value that over the long-run returns a bit better than cash), we can see the following annual returns.
Portfolio assets’ performance: January 1972 to present
| Name | CAGR | Stdev | Best Year | Worst Year | Max. Drawdown | Sharpe Ratio | ||
|---|---|---|---|---|---|---|---|---|
| US Stock Market | 10.67% | 15.63% | 37.82% | -37.04% | -50.89% | 0.44 | ||
| 10-year Treasury | 7.05% | 8.02% | 39.57% | -10.17% | -15.76% | 0.32 | ||
| Cash | 4.65% | 1.01% | 15.29% | 0.01% | 0.00% | N/A | ||
| Gold | 7.62% | 20.02% | 126.55% | -32.60% | -61.78% | 0.24 |
We can also look at the monthly correlations between assets, and with the overall portfolio when each has a portfolio weight of 30% stocks, 40% Treasuries, 20% cash, and 10% gold.
Monthly Correlations
| Name | Stocks | 10-year | Cash | Gold | Correlation to Portfolio |
|---|---|---|---|---|---|
| Stocks | 1.00 | 0.03 | -0.02 | 0.02 | 0.76 |
| 10-year | 0.03 | 1.00 | 0.10 | 0.06 | 0.56 |
| Cash | -0.02 | 0.10 | 1.00 | -0.02 | 0.07 |
| Gold | 0.02 | 0.06 | -0.02 | 1.00 | 0.39 |
We don’t expect the returns of equities to exceed that 3.0-3.5 percent premium over bonds.
The nominal returns you see of the past also are highly unlikely to repeat themselves.
Those returns were not only assisted by interest rate declines and easy liquidity policies post-2008, but also by the higher productivity rates of the past and also employment growth tailwinds – e.g., women entering the labor force and a growing working-age population.
These influences are no longer there.
Higher returns are also not likely to come to pass in riskier private investments (real estate, private equity, venture capital). These provide a little bit of a premium over stocks but at the trade-off of being riskier, more leveraged, and less liquid.
If you were to hold a bunch of assets in your portfolio and look at it in 10-20 years, it’s very likely you’d have decent nominal gains.
But you’d probably be pretty disappointed at their value relative to how a stock and bond portfolio has grown over the past ten years and the ten years before that.
And probably disappointed relative to how they’ve done in real terms, which is what matters as far its concerns purchasing power.
Central banks previously had a lot of ability to help asset prices do well in both nominal and real returns. There wasn’t as much debt, so real rates could be high without punishing economies with high debt servicing costs.
That type of paradigm is largely over. Now debtors are being favored relative to creditors and other asset holders.
This is always the case when there’s too much debt relative to income. And income is a function of productivity. Income can also come in the form of “printed” money and credit, but that devalues it.
Financial assets might just seem like numbers on a screen day-to-day.
But in the end, of course, financial assets are securitizations of future cash flows. If you own a debt or equity asset, that’s a claim against somebody else’s future income. Somebody has to come up with the money to pay you.
The price of an asset is the sum of the discounted present values.
If very high expectations are built up but those profits aren’t realized (e.g., bubble stocks) – a function of productivity and labor growth at the more macro level, and revenue being above expenses at the micro level – then the asset won’t be worth what it is.
Because of all the debt and debt-like liabilities (e.g., pensions, healthcare, insurance, other unfunded obligations) in the US that are coming due over time at and at faster rates, we will need higher returns.
We can’t really afford a Japanification of the US financial or real economy without avoiding bad social and political conflict.
But the returns won’t be there at the level needed. They’re currently at about 15x GDP. So they’re never going to be paid through productivity outcomes.
By and large there are four main ways to get out of a debt crisis:
1) Debt monetization, money printing
2) Debt restructuring
3) Austerity
4) Wealth redistribution
Printing money is the most expedient way of getting out of debt crises and also the least understood.
It’s more politically acceptable to print money than to cut spending or raise taxes because it’s not clear who’s paying the tab.
Basically, it’s like if you were in a game of Monopoly and the “banker” created more Monopoly money and distributed it to everyone to help cover their debts and make them satisfied so they don’t go broke.
People rarely complain about money and credit creation. In fact, they want more of it and consider the government inhumane and cheap if it doesn’t do so.
Debt restructuring happens as well, which is deflationary since assets and spending power are being destroyed in the process. Money creation, which is inflationary, helps to negate the deflationary effects when policymakers work to engineer a rebound.
Austerity is rarely used in developed market countries as they have reserve currencies. Austerity is, however, common in emerging markets that don’t have reserve currencies and can’t print money.
Wealth redistribution (i.e., cutting spending, raising taxes) to help transfer money from those who have it to those who don’t works at the margins. But throughout history it practically never solves the types of big debt crises that regularly occur.
People will only take so much and will work to move their assets and/or themselves to places more hospitable to wealth and/or vote out the governments trying to take their money. There are constraints to tax policies because of the potential disruptions to capital flows and incentives.
Wealth redistribution is occasionally a material component of deleveragings when revolutions occur. Russia in 1917-18 is an example where there was a shift from right to left where the old system was torn down and replaced. That system lasted for the next 74 years until the early 1990s before Russia built its current one.
With money printing, it’s hard to clearly identify those harmed by the policy in terms of whose wealth was taken away.
In fact, in most cases, it causes asset prices to go up because of more liquidity in the system. Even if the assets are going up in depreciating money it appears that they’re getting richer because the prices are going up in nominal terms.
You saw this in 2009 (recovering from a credit problem) and you saw it in 2020 (recovering from a large drop in incomes) where central governments and central banks are creating massive amounts of money and credit to help fill in the gaps that were created.
But not all devaluations are good.
Some devaluations can be beneficial (e.g., to relieve a big debt problem, get pricing in line with other countries, to help an export-oriented economy) while some can be destructive (e.g., excessive inflation, imports are more expensive).
If a country has a high level of economic and military power at the time of the devaluation, many savers will still want to hang onto the currency and it’s generally not as bad as when the converse is true.
In cases where the money printing helps the flow of this liquidity into positive productivity and economic earnings for companies, there are rising real stock prices – i.e., real wealth creation.
Japanification occurs when the mechanism between lending and positive productivity outcomes is ineffective.
Printing money and being the lender of last resort (i.e., the central bank) is perfectly acceptable so long as the money is invested to have an ROI that is sufficient enough to service the debt that’s created.
Throughout history and from basic logic, investment programs in education, job training, infrastructure, and research that yields productive discoveries and inventions is very effective. They do have long lead times from when the investment is committed and when the fruits of these investments are achieved.
Improvements in education and infrastructure were essential behind the rises of all societies and empires and declines in the qualities of these projects are regularly part of the mix behind their declines.
When the central bank faces a choice between:
a) allowing real interest rates to rise and slowing credit creation and economic activity, or
b) preventing real interest rates from rising by printing money to buy debt and assets…
…they will eventually want to choose the second option.
This also reinforces the reality that holding cash and bond investments is not attractive relative to riskier equity and equity-like investments.
This generally results in rising stocks markets so long as these policies continue at a certain level and drive down risk premiums and forward returns.
Since 1850, the returns of holding interest-bearing cash been 1.2 percent annualized measured across reserve currencies (dollar, yen, pound, and so on) against 1.3 percent for holding gold, a long-duration, non-credit dependent store of value asset.
Of course, there are very large different in the returns of cash and gold throughout various periods of time and in various empires/countries.
For example, Germany, which went through two terrible experiences in the first half of the twentieth century had worse returns in their currency relative to a country like the US, which had two big (but not devastating) depreciations in 1933 and 1971.
Gold throughout time has had use as a way to help protect purchasing power. It is especially useful during a fiat monetary crisis when the value of a currency declines a lot.
Gold is measured as a certain amount of currency per ounce and is used more as a reserve asset than something prized for widespread industrial use. This makes it useful primarily as a barometer for the value of money. When a currency depreciates significantly, gold’s price tends to act as the inverse of its value, or essentially a barometer for the value of money in relative terms.
In a Japanification scenario, where cash and bond yields are extremely low and stocks have very high valuations, gold is typically more popularly demanded being a store of wealth substitute.
Such an environment is not ideal from a monetary soundness perspective.
Most people don’t pay adequate attention to their currency risks. Most worry about the movements in their assets prices, whether they’re going up or down in value. Rarely do people worry about whether their currency is going up or down and what that means for their purchasing power.
Japanification in the US
Asset prices are currently at a level well beyond the economy through the liquidity that was pushed in by the central bank to be stimulative in a zero interest rate environment.
That’s pushed up the prices of all asset classes relative to their expected returns. Therefore, expected returns are going to be lower, especially relative to what kind of returns are needed.
That’s just a reality that traders and investors have to contend with, especially those that effectively rely on being long. This includes insurers, pensions, and most individuals.
And there’s also going to be low returns yet a lot of volatility despite that. With monetary policy having less traditional room (it has to be unified with fiscal policy with zero or near-zero short- and long-term interest rates), there’s the risk of having a downturn and not having the capacity to deal with that in the standard ways.
At the same time, as markets run higher, leverage generally increases, especially as risk premiums decrease and borrowing rates are low.
That makes sell-offs more violent.
The new paradigm in monetary policy means there’s no longer the kind of allocation of capital in the ways we’re accustomed to.
Before, the way monetary policy worked central banks would put cash on deposit. Then it was the bankers, and those who had the savings and capital, who would lend it out to people and institutions based on the perceived reward and risk of the proposed investments.
Now it’s largely policymakers who get to decide who gets the money, who doesn’t get it, and how much. It’s more toward “state capitalism” rather than the previous form that was more laissez-faire and “bottom up” instead of “top down”.
We cover more about US-China relations in a separate article and in a follow-on six-part series discussing the various types of “wars” or conflicts going on between the US (and to a lesser extent other Western democracies) and China.
This include conflicts regarding:
i) trade and economics
iii) technology
iv) geopolitical
vi) internal conflicts within countries
If Reflation Beats Out Japanification
Because of all the debt being issued in the US that will create a lot of Treasury issuance and insufficient demand.
There’s not going to be enough private sector demand. Institutional managers, reserve managers, central banks, sovereign wealth funds, and those most influential in the Treasuries market are not going to want to increase their exposure to US debt.
The US is about 20 percent of global GDP yet 50-60 percent of global reserves. Plus the yield is low and a lot more issuance is to come.
That can have one of two effects, both of which are bad for anyone holding the debt:
i) Yields rise, creating mark-to-market losses
ii) The central bank prints money to buy the debt and devalues the currency instead
So you either get higher yields, which hurts their prices, or the currency is devalued.
In 2020, Treasury bond yields declined because the Federal Reserve bought so many of them to keep yields in check.
In 2021, it was a different story. A lot of debt was issued and the Federal Reserve didn’t keep up their purchasing speed.
Treasury Issuance vs. Fed Buying
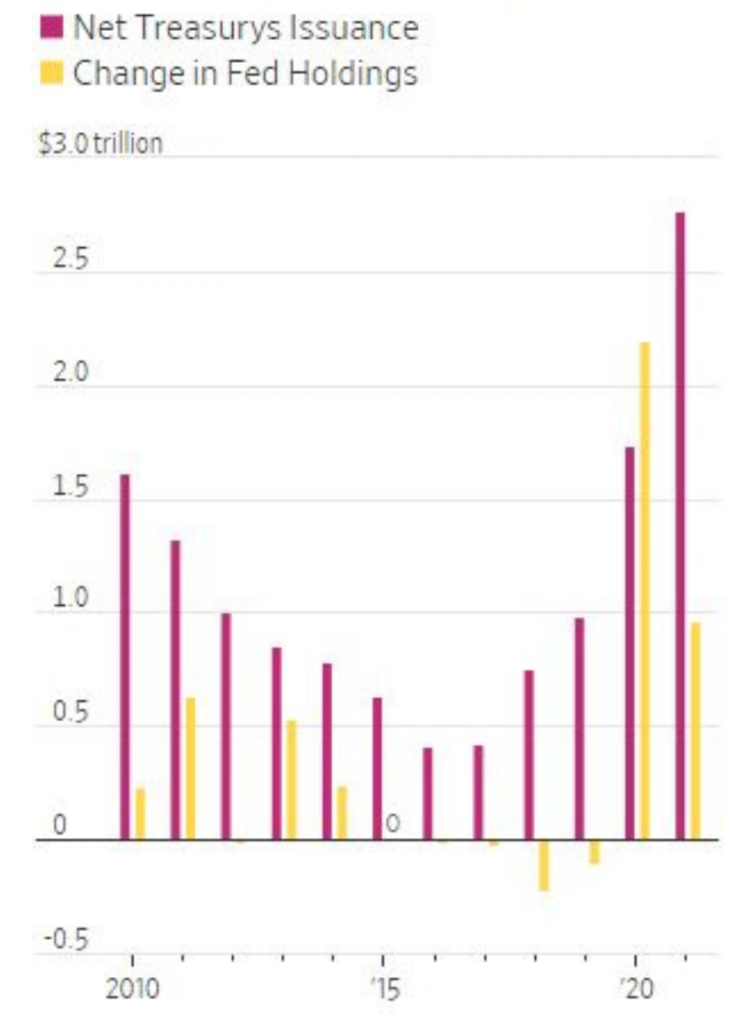
(Source: WSJ, BofA Global Research)
Because there isn’t enough global demand for the sheer amount of US debt that needs to be bought, that falls on the Fed to buy them with printed money.
They don’t want yields to rise too much, because that’ll hit financial assets and later the economy. So eventually they’ll have to take it through the currency instead, which is generally more discreet and less painful.
Portfolio Construction
In previous articles, we talked about holding a well-diversified portfolio that can capture risk premiums and grow in most environments, while producing lower drawdowns, being less vulnerable to overall left tail-risk and long underwater periods, among other benefits.
Diversifying well will increase your return per each unit of risk better than anything else you can practically do.
This is more important than ever before even if the returns of asset classes are not likely to be high, especially in real terms.
We’re also in an era where there are wide divergences between countries.
For example, while developed markets have more limited returns as evidenced by their low and relatively flat yield curves, many countries in Southeast Asia have more normal interest rates and a steeper yield curve.
This means higher returns in all three of the basic asset classes (without controlling for currency effects): cash, bonds, and equities.
Most portfolios are structured to be long a specific asset class, in a certain country, and in a certain currency.
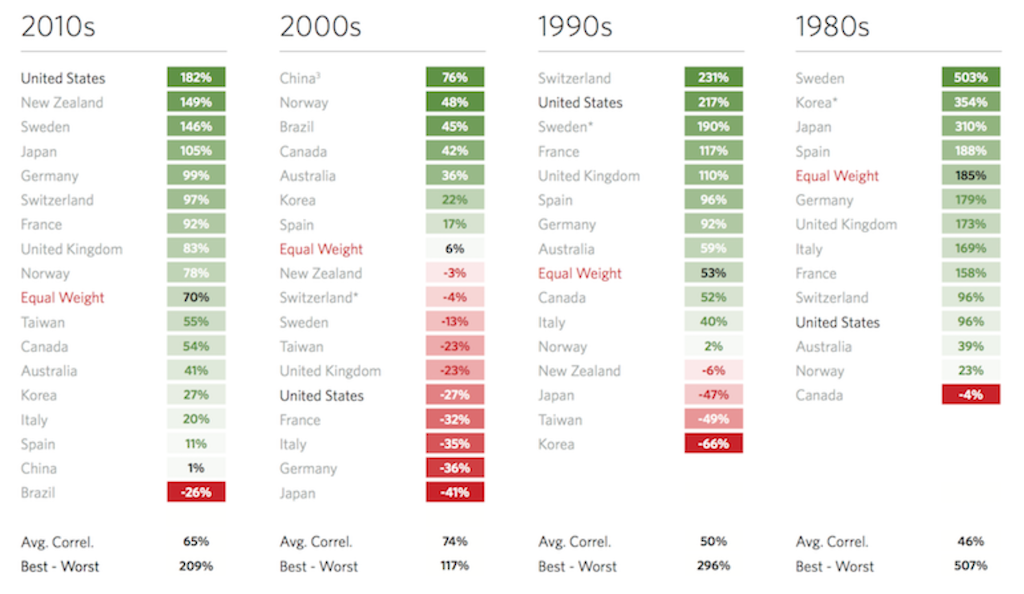
Most investors are biased toward their own domestic stock markets. This is especially true if they have done well in the recent past, even though their previous outperformance tends to make them lag going forward. (An increasing stock market generally means a more expensive stock market.)
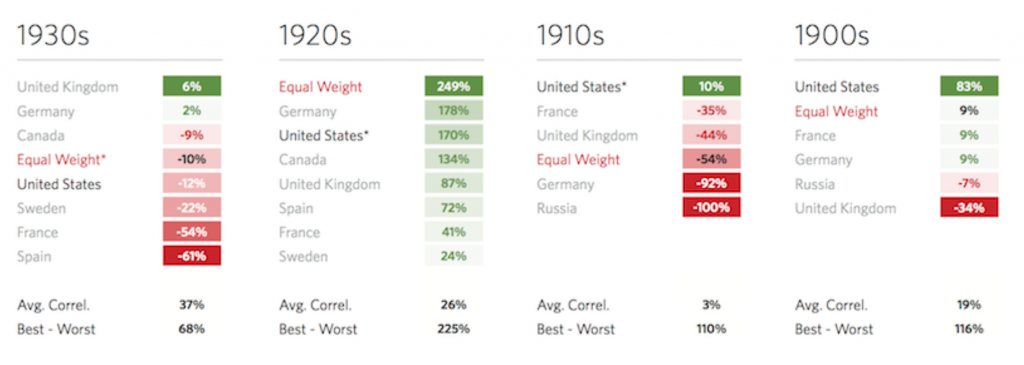
If you go decade by decade, you can see a pattern where the best-performing markets in one decade tend to lag the next. However, it’s common to extrapolate that they’ll continue to perform that way simply because that’s what people are used to.
Stock Market Decade by Decade Performance, by Country
1980s to 2010s
1940s to 1970s
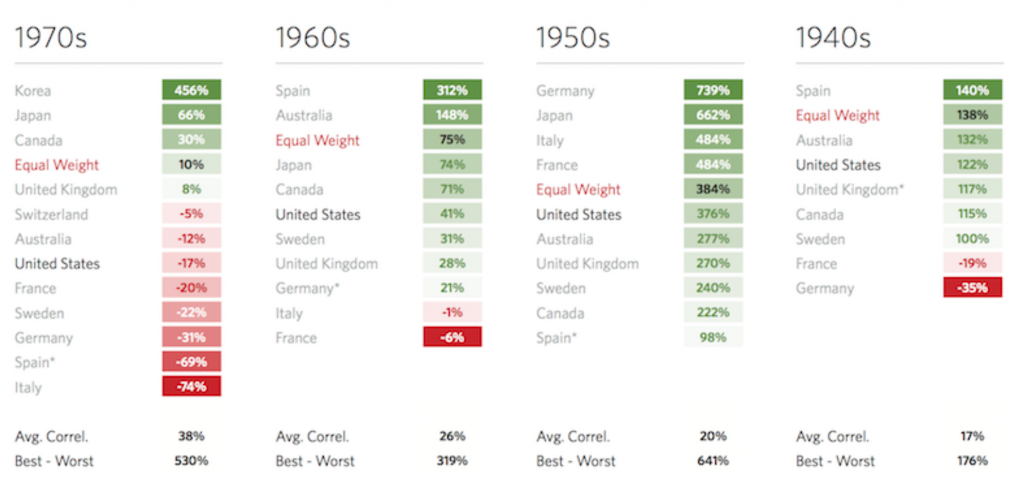
1900s to 1930s
Usually most traders and investors have almost everything in stocks. Or they’re in equities up to a level of volatility they can tolerate and throw in some other assets (mostly bonds) to round it out.
Even if it ends up as something like a 60 percent stocks/40 percent bonds portfolio, stocks are perpetual duration instruments with higher risk (being most junior in a capital structure). So, the portfolio by risk allocation is still very much in stocks – about 90 percent of it.
The most important thing for most investors is to start with diversification of asset classes, of different countries in different geographical regions, and of different currencies.
The one thing we know in this particular environment is that we don’t know much, especially with the wide divergences in outcomes between countries and between asset classes and within them (e.g., sector by sector, asset by asset).
It’s not necessarily easy to time what’s going to happen. The markets are relatively efficient in making comparisons between the various choices of assets.
It’s not always obvious to spot a mispricing and say that one thing is necessarily better than a different investment.
The best thing is to diversify in a way that produces the excess return so that it’s stable and the least risky as possible.
The combination of different assets that do well in different environments will make the portfolio more stable over time. When some assets do poorly, others kick in due to their intrinsic environmental biases.
Concentration in the traditional portfolio of stocks and in the same currency, as most tend to do, is dangerous, which is borne out historically.
Everybody’s favorite asset class is going to decline some 50 to 90 percent during their lifetime.
In recent times, we’ve seen central banks come in to boost asset prices, replace lost incomes, and reflate the economy through vast and unprecedented liquidity provisions.
It’s likely central banks are going to continue to do that where they can.
Then it becomes a matter of how that manifests in asset classes.
Outside that, you can be pretty sure that financial assets will outperform cash, you can’t be sure too sure how it’ll transpire.
– What does it do to inflation?
– Does it drive up stocks in real or nominal terms?
– Does it drive down the value of money and credit?
– Does it drive up gold prices (essentially priced as the inverse of money)?
– What is the role of inflation-indexed bonds in a portfolio (also known as inflation-linked bonds, or ILBs)?
From 1945 forward, the institution of the Bretton Woods monetary system and US military power created a US and dollar type of world order.
Through that, investors have learned certain habits and a way of operating, such as US equities, Treasuries, and the US dollar being a good place to park their money.
It’s largely been great for US financial assets.
But as the US has built up obligations and its role in the world declines (it gradually makes up for less of all economic growth), those kinds of returns (4%+ for cash, 7%+ for Treasuries, 10%+ for stocks) are no longer realistic.
Nominal vs. Real Returns
Whether Japanification transpires or whether it’s closer to stagflation or another outcome, the question of nominal returns versus real returns is important for all types of investors.
Market participants concerned about nominal return targets are usually those tasked with providing defined benefit plans. Pension funds are a common example. They know exactly how much they’re going to have to pay out in the future and thus mostly target nominal returns.
Investors more concerned about real returns include endowments and foundations. This is because these entities are most interested in their purchasing power – i.e., what they’re going to be able to spend with these returns.
Risk for many types of investors relates to an asset and liability mismatch.
Some investors have more of a fixed return liability situation where the nature of their liabilities (what they need to pay out) is known in advance.
Others have a real return liability where the real purchasing power component is more important.
In engineering the portfolio when considering nominal versus real, the first consideration is what is the base asset. What’s the basic building block of the portfolio, sometimes called the “risk free” return?
For a nominal return portfolio, it’s a nominal return bond.
For a real return portfolio, it’s a real return bond, or an inflation-indexed bond (also known as an inflation-linked bond, or ILB). This is part of why some investors decided to push the US Treasury to come up with an inflation-linked security.
For those most concerned about their real returns, inflation-linked bonds become the base asset off which the portfolio is built from, as those pay some yield (which can be negative or positive) plus the inflation rate.
Off that, the maturity of the base assets will need to match up with the nature of the liabilities.
Some might have a mix of both fixed-rate and floating-rate liabilities, which would then be calibrated in the portfolio.
Many individuals have a mixed liability situation. For example, mortgage payments are generally fixed but other types of spending are influenced by inflation.
With respect to going beyond that into other assets, it has to be consistent with the particular return objectives while also being consistent with the liability stream.
This is an engineering exercise that is different from one entity to another.
Many important entities won’t have enough income
The big picture concern is that most investors – e.g., pension funds, endowments, foundations –are not going to have enough income relative to what they need to service their liabilities.
Financial sustainability is a big question going forward, even more so in a Japanification scenario. All individuals and all companies have a certain amount of revenue, they have a certain amount of expenses, and a certain amount of savings and assets relative to liabilities.
Going through individual companies, you can see that some will not be able to pay out a certain amount of money based on the income they’re generating.
That means they’re going to have to tap into their savings pool. Then it’s a matter of how long this can go on for and whether they’ll be recipients of government support.
Some companies can either raise capital to push out their time horizon or receive direct government support if the costs to not “bailing them out” are higher than letting them fail. Some will go broke.
This is virtually always true, but it’s a bigger problem when nominal growth rates are very low and also when real growth is low.
When it comes to pension obligations, those under direct government oversight are not likely to default because you can’t tell people they won’t get their money. It’s not politically acceptable to default on those. So they’ll have to be monetized through further rounds of monetary “printing” to fill the liability gaps.
More private pensions will seek government support, which will devalue currencies since it’s such a pervasive problem.
Other relevant factors to today
Beyond the constrained monetary policy landscape and fiscal policy determinations of what capital goes where, there are other elements that are very important to the markets today.
Importantly, we have various issues, like wealth gaps, opportunity gaps, values gaps, and political gaps that are driving more internal conflict. This is due to a variety of reasons.
One is monetary policy itself, which has aided those who held financial assets over those who didn’t, creating wider wealth disparities.
Another is the influence of locating production wherever it’s cheapest. Many parts of the rural United States have been hollowed out as the jobs that employed many people in certain areas have gone to other countries.
This helps decrease the wealth gaps between countries but widen them within countries.
That’s led to depressed domestic incomes and various types of issues like higher suicide rates, more opioid use and addictions, and so on.
Then there’s the education issue, with certain groups having better access to quality education than others.
There is nothing in the US Constitution that says the provision of education is a federal obligation. So most of it is run on a state and local level, largely collected through tax revenues in those states and municipalities. As a result, kids located in richer municipalities tend to get better educations – sometimes significantly – than those in poorer locations.
That has implications for adult incomes, incarceration rates, class and social divisions, and so forth.
That’s driven more populist political tendencies and more of a wedge between the left and right.
You have values gaps and this moves into what kind of leaders are elected, where you have a populism of the left (e.g., Bernie Sanders, Elizabeth Warren, AOC) and a populism of the right (e.g., Donald Trump).
When you have an economic downturn, all this boiling conflict under the surface tends to spill over in one way or another and create additional demands on the system.
And who gets elected has implications for tax rates (individual, corporate, capital gains), and other matters related to dividing up fiscal spending.
Conclusion
Interest rates and bond yields follow nominal growth. In a Japanification scenario where real and nominal growth go to around zero, that means bond yields have to be low to keep nominal growth positive.
If the borrowing rate of the economy is higher than the nominal growth rate, the debt will grow faster than income and the economy will eventually contract if not rectified.
The low borrowing rates might be good for borrowers, but persistently low rates do not necessarily ensure quality economic growth, as Japan has shown. And it’s a reason why Japan has been seen as a precursor for developed market economies.
Longer-term investment entities, like insurers and pensions, depend on a certain return from their bond investments.
So, low rates presents difficulties and create more systemic risk, as certain market players go into riskier investments or add leverage to magnify lower spreads (i.e., between cash/risk-free assets and riskier assets) into the desired returns on equity.
Pension funds on defined benefit plans, for example, calculate the value of their long-term liabilities using high-quality bond yields.
When yields drop, pensions expected returns fall along with them. A decline in government bond yields (the safest asset class) pulls down the returns of other investment asset classes as money flows into them chasing their higher returns.
Their funding status declines and they have to achieve higher returns or set aside more money.
When yields fall, pension providers’ expected returns dim, their funding status deteriorates and they have to set aside more money.
The Social Security deficit in the US currently stands at over $21 trillion, with total unfunded liabilities at around $160 trillion.
Over $1.1 trillion is drawn against Social Security each year. Another $1.3 trillion is drawn for Medicare and Medicaid. Over $700 billion is used for defense, used to maintain the US’s sprawling empire.
The US is an aging country, which exacerbates the funding shortage and reliance on money printing.
In 2000, the US workforce stood at 158 million people. Now, it stands at 150 million.
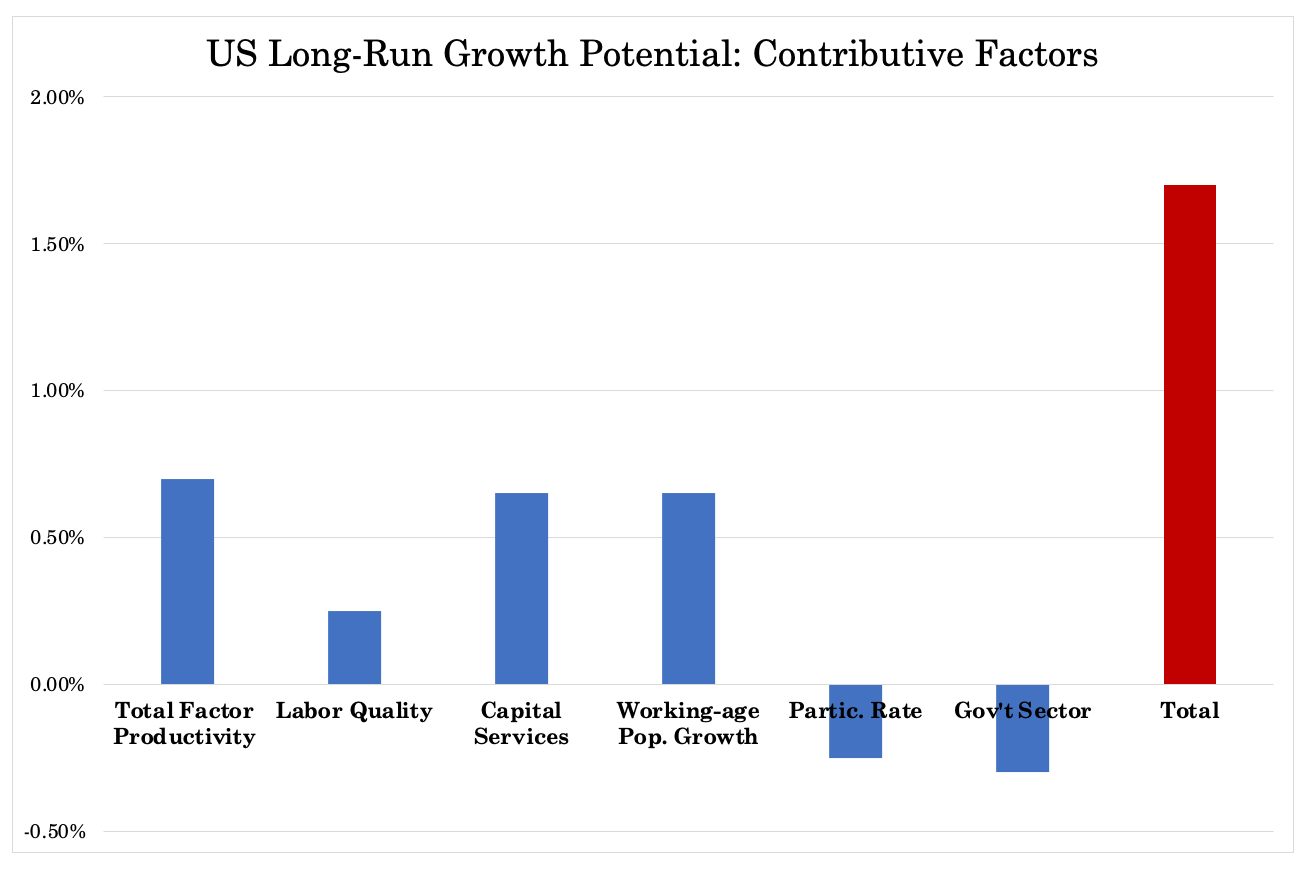
Productivity increases at 1.5-2.0 percent per year in the US, which is enough to offset declines in the workforce, but it doesn’t give a lot in real growth.
All of this adds up and is likely to produce a big sag in economic growth.
Not only is it bad for investments outside the bond market, it impacts equities. It means an anemic business cycle, which means the earnings outlook is weak long-term.
It doesn’t necessarily mean bad nominal returns (e.g., money printing, trending with inflation), but real returns are not likely to be good in the developed world.
Even in Japan’s “lost decade” following the popping of its bubble in 1989, equities underperformed bonds despite how cheap they became. This is not uncommon, as investor confidence is often shot after getting burned.