Stocks Overvalued? Considerations of How High Is Too High


When we talk about the question of are stocks overvalued, we need to frame the idea in terms of multiples of a metric that underlies their values.
The value of a business is fundamentally the amount of cash that you can earn from it discounted back to the present. Earnings is revenue minus expenses.
Free cash flow is earnings plus depreciation and amortization plus/minus the net change in working capital minus capital expenditures.
Some early stage companies aren’t ready to be profitable yet because they need to make investments to maximize the earning potential of the firm down the line. So, they go by revenue or something else like daily or monthly active users depending on the nature of the business.
In sum, to assess whether stocks are overvalued it comes down to multiples that are representative of what you’re trying to evaluate.
When you invest, you’re putting up a lump sum for an expected stream of income in return. For trading considerations, fundamentally the most important driver of the price is when the expectation of that income stream changes.
For the stock market as a whole, earnings multiples are generally a good bet. Companies in the major indexes are fairly mature and most of them make a profit.
Though some are focused on growing and getting market share, and haven’t pivoted to the “late stage” of maximizing profits for shareholders, bottom-line earnings is generally a good measure for valuing the S&P 500, for example.
Earnings as it relates to macroeconomic drivers
The earnings yield ties in heavily with nominal economic growth rates.
In most developed countries, real growth long-term is generally somewhere in the 1.0-2.5 percent range.
Central banks generally target a low, positive percentage for inflation of about 2.0 percent.
Combined, you get the nominal growth rate. This about 3.0-4.5 percent as a general long-term range in your main reserve currency countries (US, developed Europe, Japan).
It’s a reality that over the long-run businesses as a whole cannot out-earn what’s being produced.
When the stock market is in a strong bull market, people tend to extrapolate even when the underlying conditions don’t support these projections.
If they got about 16 percent per year in stocks, which was about the case for the 2009-2020 bull run in the US, they tend to think that’ll continue.
But you can’t have perpetual double-digit year-over-year stock market gains if the underlying economy is only getting about four percent nominal growth.
That’s eventually going to have to be reconciled.
If central banks want asset prices to stay high even if economic growth is stuck at ugly levels, there is a way to generate a safe landing at least in terms of asset prices (given their importance to the economy) – create more inflation.
This is called stagflation (a portmanteau of stagnant economic growth and inflation) and one of the future scenarios one should ideally be immune to because it presents a material risk to traditional portfolio approaches.
If stocks are pricing in something like 10 percent growth in earnings ad infinitum and you’re only getting 4 percent growth in the underlying economy, then a central bank is more likely to want to ease policy than keep it tight.
The financial economy and the real economy
Asset prices are important to the real economy. The markets represent the supply and demand for money and credit. This money and credit feeds through into creating products and services that people need, want, and buy in the real economy.
Central bankers are more academic and focus on different things than traders in the private sector. Academics are inclined to focus more on real economy measures like employment and investment levels whereas traders and investors are more likely to focus on things like debt, cash flow, and asset prices.
When stock and financial asset prices drop, the wealth effect of asset price movements is actually a bigger influence on economic growth rates than actual monetary policy. This is usually underestimated.
In the early stages of assets falling, stocks fall but earnings have typically not yet declined. (Credit is generally hit first and then income.)
When stock prices fall and earnings have yet to decline, people tend to mistakenly believe that the decline is a buying opportunity to find cheap stocks in relation to expected earnings and past earnings. They don’t properly account for the drop in earnings that’s about to come.
And this reversal is self-perpetuating. Wealth declines first through lower asset prices. Income falls next. This causes creditworthiness to diminish. This constricts lending activity. In turn, this hurts spending and lowers investment rates. At the same time, it becomes less appealing to borrow to buy financial assets.
All of this worsens the fundamentals of assets. Weaker economic activity leads corporate earnings to underwhelm. This leads people to sell and drives down prices further.
Very little of this has much to do with value. What’s most important to understand is that liquidity drives markets and matters of undervaluation and overvaluation are less important.
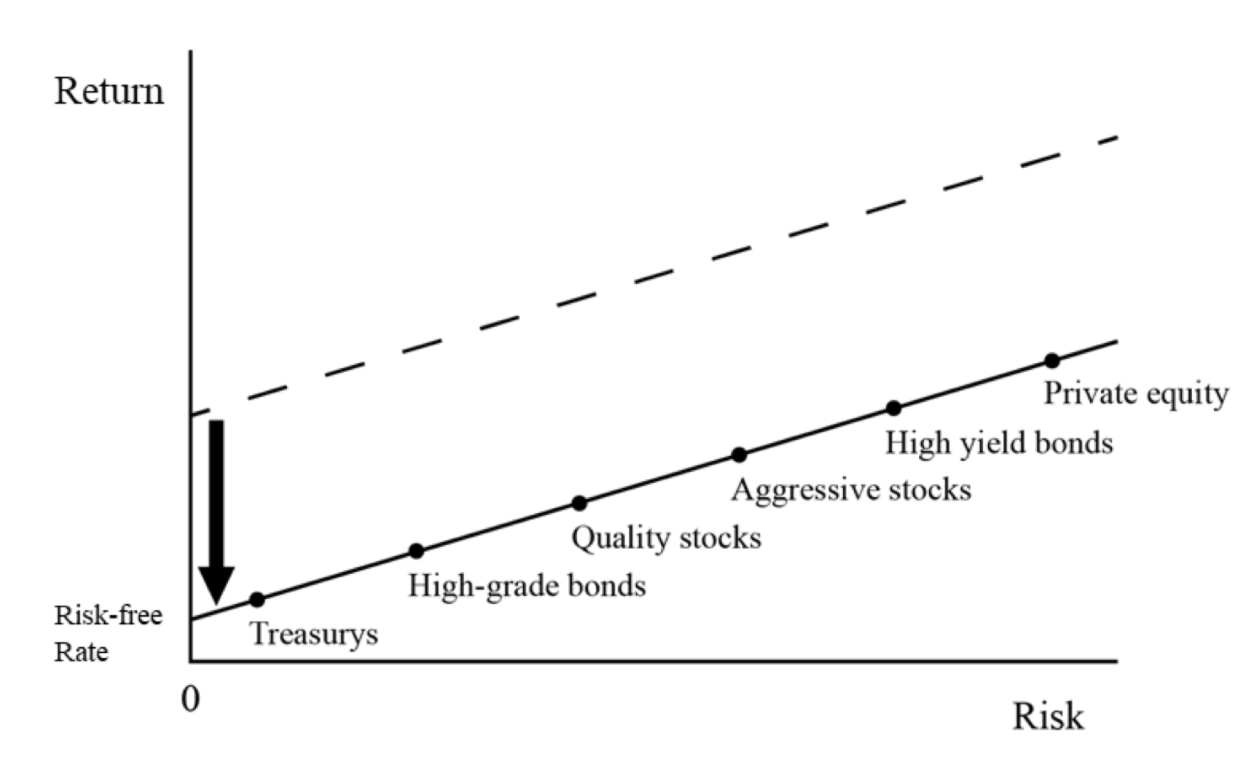
All assets compete with each other
Assets have relative risk premiums.
Stocks must yield above bonds, which must yield above cash, and by the appropriate risk premiums.
In the developed world, the cash rate is zero (in some places, negative). And the bond rate is at or near those levels as well.
When that happens, it’s a “no alternative” world. So, the yield of stocks bends down to the cash and bond yields as well. More money will go into illiquid, private assets. That includes real estate and private equity.
The below diagram demonstrates the effect.
Liquidity bids up everything
The enormous amount of money and debt that has been created in recent years – and will continue to be created to relieve debt and debt-like obligations – will put increasing focus on the value of that money and debt relative to the value of assets and other currencies.
Monetary policy, which is the primary lever influencing economies and markets, is run differently relative to the past in developed markets (US, developed Europe, Japan).
It’s no longer interest rate-driven or QE-driven (i.e., central bank asset buying).
Rather it’s primarily the central government borrowing a lot of money through fiscal policy actions and directing it to where it believes it needs to go. The central bank creates the money needed in lockstep with that.
More attention going forward will need to be paid on whether this money and debt is going into the things that will efficiently produce broad-based productivity gains.
If it does, then that’s positive.
If not, then there are ugly trade-offs between higher interest rates, a weakened currency, higher inflation, slower productivity gains, and ultimately a slower pace of gains in real incomes.
As mentioned earlier, stocks compete with bonds. Stocks historically trade at somewhere between 10x to 20x earnings.
If you’re a value investor, you probably like buying toward the lower end and dislike buying at the higher range. In general, you’re always looking for deals where the earnings are high relative to the price.
For example, if a value investor sees a $100 stock and its earnings are only $1 per share and doesn’t think they’ll grow much, it’ll be viewed as a terrible investment.
If on the other hand it’s a $100 stock and earning $10 per share and not expected to grow or shrink much and inflation is low and stable, it’s much more palatable. You’ll get your money back in dividends and distributions in ten years (in nominal terms) if all goes to plan.
Bonds are not particularly attractive in developed markets with around zero yields. That means if you put up a dollar, you’re not getting any interest on your money.
It might be a place to preserve money, but it’s not going to do anything to generate income.
And the longer the duration of the bond the more likely you are to get a higher yield on it. But then you have to contend with more price risk.
Then you factor in inflation and the buying power of your money in that bond is eroding. Unless you get deflation, which central banks don’t want.
Inflation, in a small quantity, helps debtors relative to creditors. It also helps some asset prices that are quality stores of wealth. It helps incentivize people to spend and invest knowing that cash’s purchasing power will go down over time.
Accordingly, central bankers want an inflation rate of at least zero. They want to avoid deflation. They generally target around two percent in developed markets.
In emerging markets it’s usually a little bit higher because they’re growing faster. Inflation is the pricing of economic activity.
It’s common for well-managed countries (i.e., those who manage the trade-offs between growth and inflation well) to generally get around one unit of additional growth (real goods and services output) per one unit of inflation.
In developed markets, that often means two percent real growth and two percent inflation. For emerging markets with a lot more catching up to do, that might mean four percent real growth and four percent inflation.
When nominal yields decline, cash and bond yields also decline.
Central bankers need to create a positive spread between the economic growth rate and the yield on cash and bonds. Otherwise debt will grow faster than income and eventually create problems when the debt servicing obligations swamp the cash flow.
Due to low growth and low potential growth, cash and bond yields will have to remain low in real terms.
With bond yields where they are, bonds are trading at 100x earnings or more.
Stock multiples
With cash being such a poor alternative, the idea of stocks trading at 40x or more earnings is really a question of “why not?”
If the bond yield is zero or thereabouts, and the risk premium of stocks over mid-duration government bonds is about 3 percent, then that’s your expected yield on stocks.
The inverse of that 3 percent is the earnings multiple, or about 30x-35x.
When volatility is low, then yield becomes the most important factor so the risk premium can decline further.
If the risk premium falls 100bps, such that the 3 percent yield turns into 2 percent, your multiple turns into 50x.
You can play around with any combination, but the idea is the same.
Cash and bonds have capped upside while stocks do not
The capped potential return of cash and bonds is also a material difference.
Cash doesn’t have volatility. Its return is just the interest paid on it. Bonds (at least most of them) are fixed maturity instruments that pay out a certain yield at fixed intervals.
You can make money trading bonds if interest rates decline, but they’re approaching their limitations with interest rates already so low.
Stocks, on the other hand, have no such constraints facing them. They’re perpetual cash flow instruments that have no capped upside. If the company underlying them earns more, they can increase in value.
Old multiples of 10x to 20x are not appropriate to use on the current market when other assets don’t yield much or anything, and more money and credit is being created to help the economy.
If it seems unthinkable that stocks could yield a 50x earnings multiple, not all that long ago a zero percent bond yield would have seemed implausible.
You might have only known bonds could yield zero or negative interest rates if you studied financial history over time.
In the US, such zero yields occurred during the 1930s Great Depression era.
3-month yield (cash yield), United States, 1934-present
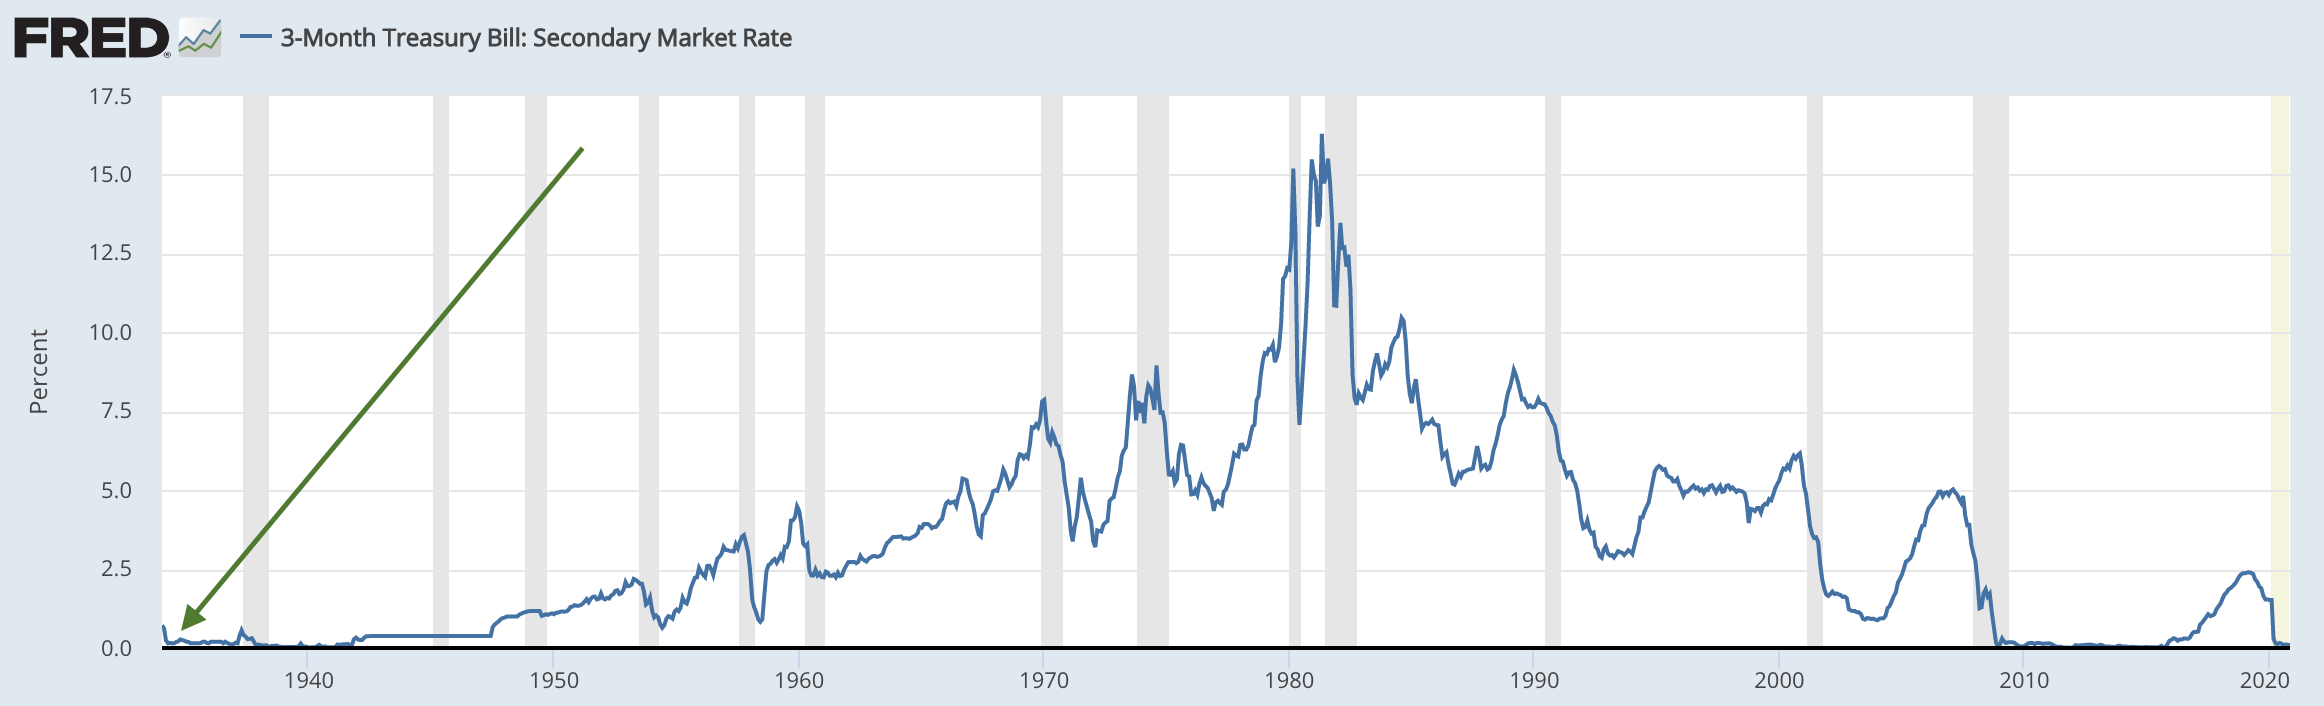
(Source: Board of Governors of the Federal Reserve System (US))
It’s also happened in other societies and in other generations even if it seems unique because it hasn’t happened over the time we’ve personally followed markets and economies.
Investment assets compete with each other, and with cash and bonds are bad as they are, there are limited traditional alternatives.
Traders and investors will look to diversify more of their cash and nominal rate bond exposure in other alternatives – e.g., inflation-linked bonds, gold and other precious metals and commodities, diversification in other countries with higher yields, and certain types of stocks and businesses with stable cash flows.
Examples of the ‘overvalued stocks’ phenomenon
Traders and investment managers have begun to shift their perspectives on what kinds of assets they want in recent years.
They looked at the environment and saw that cash and nominal rate bonds were terrible to have in any material quantity.
Cyclical stocks were also not great. With interest rates at zero, the central bank could no longer engineer a credit expansion in the normal ways.
Traditionally, if stocks are falling and the economy is turning down, the drop in interest rates helps offset the fall in lost income by lowering the discount rate at which the present value of future cash flows is calculated.
When there’s no more room to cut, the potential fall becomes greater. Moreover, the cut in interest rates is good for bond prices and therefore helps offset some of the equity risk.
But that’s gone. No longer is it about what parts of the economy are interest rate sensitive in what ways, and whether the central bank will raise rates or lower rates and how that’ll affect various assets.
We’re now in a fiscal policy driven world that determines who gets the money and credit and who doesn’t – what companies, what sectors, how much stays in the country and how much leaves, and so on.
That means more investment managers want something that you could call a store of wealth. That can include certain stocks and certain types of commodities that can fill this role.
Gold is a long-duration store of wealth asset that also provides currency diversification.
Inflation-linked bonds don’t have price caps in the same way nominal rate bonds do because real yields have no limit to how low they can fall.
(Real interest rates are the nominal rates you see in the yield curve minus inflation. If inflation picks up, then real rates can be quite negative, helping the prices of inflation-indexed bonds.)
Store of wealth equities
There are two broad classes of stocks that fit this store of wealth paradigm:
i) things that people need (food and consumer staple products and services necessary to live)
ii) things that involve where the economy is going and what’s going to be driving the next generation of big productivity gains
As more money pursues these types of assets, their multiples have gone higher. We see stocks like Wal-Mart (WMT), Coca-Cola (KO), and Proctor-Gamble (PG) climb to 30x or higher multiples.
Their earnings are stable as some of the largest and most diversified consumer staples companies, so they get rewarded.
They’re almost being treated as a type of bond alternative. Of course, with stocks being perpetual cash flow instruments you have to contend with the higher volatility.
Long-duration equities
Then you have the long-duration stocks. Long-duration means more of their income is scheduled to come in the future than later.
Tech is the classic long-duration equity asset. They’re often growing a lot and working on the new technologies that’ll drive productivity or help consumers in some way.
They’re also the most susceptible to extremely inflated multiples. Stocks are the most prone to distortion from narrative than any other asset class, especially the ones working on new technologies or interesting things that are difficult to value.
Some start out growing fast and mature into stable cash flow firms, which shortens their duration because more of their income starts coming in the near-term.
Examples include Cisco (CSCO), Intel (INTC), and even Apple (AAPL).
Some companies are big cash flow producers and big innovators at the same time. Sometimes the innovation aspect comes a lot through wholly-owned venture arms. These companies tend to get rewarded with huge valuations.
Examples include Google (GOOG), Facebook (FB), Microsoft (MSFT), Apple (AAPL), and Amazon (AMZN).
Then you have the long-duration companies, like Nvidia (NVDA), Advanced Micro Devices (AMD), Shopify (SHOP), and, while controversial, Tesla (TSLA).
Long-duration securities have more sensitivity to interest rates and liquidity due to the way the discounting process works. This can make them highly convex bets.
All the liquidity that was being produced lowered the discount rate at which their future cash flows are discounted bringing their valuations higher.
Tesla and the overvaluation question
Tesla, for example, is the poster child of the modern-day conception of what a stock bubble looks like. Fear of missing out (FOMO), whatever you want to call it.
1720 had the South Sea Company. 2020 has Tesla.
Tesla CEO Elon Musk, well-known for making bold assertions to aid the company’s stock price (to the point of getting himself in legal imbroglios), asserted on May 1, 2020 that the stock was “too high” at a pre-split price of about $750 (equal to a post-split price of $150). It then rose by a factor of more than 4x in barely over six months.
Tesla is controversial because of strong disagreements over what the company is now and what it will be, and also how relevant its aggressive financial reporting is to the current and future business and what it means for the stock.
It combines various elements. There’s the “new technology” part.
This includes electric vehicles. This involves regular cyclical manufacturing. But many of Tesla’s proponents make a market share argument despite the capital intensity and thin margins.
There’s the autonomous driving part. Will Tesla ever make a dent in that market? Well, investors may take a flyer on it anyway. It currently has a Level 2 automated driver assistance system (ADAS), but that’s a very long way from full autonomy (L5).
There’s the alternative energy part.
There’s the continued assistance from the government part. It can sell energy credits to other companies (at 100 percent margins).
In short, the company has a large variety of “exciting” businesses that are very hard to value, plus a lot of PR and promotion, and a very loyal fan base.
Part of it is basic momentum and the psychology behind a bubble. If a market only goes in one direction, a lot of people want to hop in and try to ride the wave.
Then there’s the reality of zero percent cash and bond rates massively inflating multiples. Where do you go or can you go outside the “hot” companies?
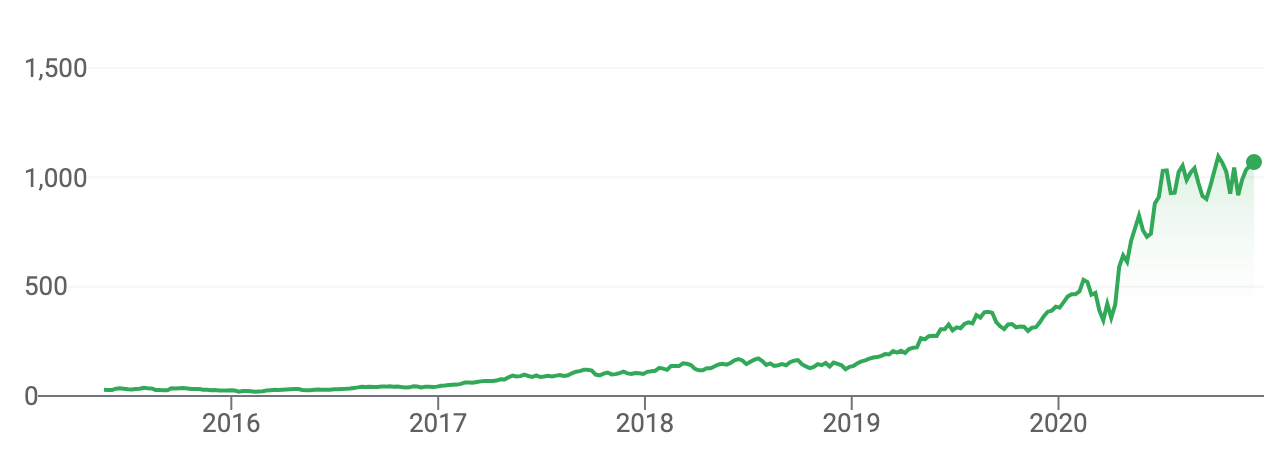
The price action is the following:
Tesla stock price

Tesla’s valuation is basically a call option on a certain conception of the future.
With the backdrop of zero rates on cash and bonds, if you assume 50x earnings multiples (for example) are possible in equities, then the valuation doesn’t seem quite as absurd.
If a company has a valuation of (say) $1 trillion and earnings multiples are at some point are 50x, that means $20 billion of annual earnings (50 x $20 billion = $1 trillion). And, of course, that $20 billion of earnings would be presumed to grow.
If a company is:
- generating somewhere around $30 billion per year in revenue, and
- is assumed to grow that revenue and get higher margins by becoming more tech-like…
- …while also inventing goods and services that may not yet be reflected in the valuation (because it’s presumed to be innovative)…
…then does that $20 billion in earnings and the inflated valuation based on “there is no alternative” seem so farfetched?
The average investment manager will say that Tesla is in a bubble and grossly overvalued, buoyed by the liquidity environment and narrative more than business reality.
But that’s the general rationalization if you were to have to make a logical valuation argument about the company.
Shopify
Shopify is another one that fits the long-duration, new-age company theme.
You see some similar price dynamics.
Shopify stock price
You have a burgeoning market for its convenient “create your own e-commerce store” product.
The other end: “value” sectors
Divergence between sectors and countries is a big implication of the new type of paradigm we’re in.
The traditional monetary policy of interest rate cuts and QE is broad-based. It’s a “lift all boats” type of policy.
Putting more of it in the hands of politicians means money and credit will become more targeted. And only certain countries are running these types of policies.
Countries that can print money aggressively, like the US, have seen big boosts to their stock markets and have cash on the sidelines.
Countries that are more limited in their policy arsenal, like the UK, have greatly lagged (even though the weekly correlations between US and UK stocks are still some 90 percent).
While certain technology stocks have gone up quite a bit, the divergence has been very high across sectors.
Banks and financials
Banks are being crimped by lower net investment income with short and long rates at or near zero, reducing the spread they can collect. They also have lots of competition from fintech firms that look to take a lot of their business.
Energy
Energy is also a big downer.
According to a recent investor survey, 86 percent of investors think clean energy investments can be positive for oil and gas companies. Yet only 25 percent also want to increase their relative exposure to them.
If companies like BP and ExxonMobil want to transition more of their businesses to becoming “the energy company of the future” (i.e., clean energy), that’s going to take capital. And there’s a lot of risk because it’s not in their wheelhouse in terms of what the company is good at right now.
It may also shift the culture of these companies over time. The general skills and abilities (and even values) of their employees may need an overhaul.
Energy companies may not be able to use their cash flows to increase dividends or buy back shares.
Moreover, energy development is capital-intensive and doesn’t have much margin to it.
And obviously, the big roadblock to transitioning to different types of energy is the even worse economics associated with wind, solar, and so on relative to oil and gas. (These sources of energy are intermittent and lack energy density.)
Investors overwhelmingly think it’s a laudable goal for these companies to move that way. But when it comes to actually putting their money down, it’s largely a different story.
Traders and investors know the economics aren’t the most appealing. And they aren’t rewarding energy even in an environment of ample liquidity.
The income component is an important determinant for many individual investors.
But what’s most important isn’t the dividend. Rather, it’s whether the earnings can support it and whether there’s also enough leftover to make the capital investments needed (to attain the future earnings projections baked into its stock price).
A dividend is just a cash outlay that decreases the stock price by a similar amount when it’s issued.
Dividends do help stocks on their own in some way, though. This is because it essentially signals that a certain amount of earnings are guaranteed. It also helps to diversify the shareholder base because some dividend funds and income investors buy in.
Companies like ExxonMobile, BP, and Chevron are especially attractive to income investors who may rely on the dividends as a source of income.
If the companies’ cash flows don’t cover the dividends, then that impacts the share price. Exxon borrowed $15 billion in 2020 to cover its dividend.
Anybody investing in these types of more value-like companies that are basically income investments will like the quarterly check. But they have to be concerned about not only the dividend’s sustainability but the value of the holding as well (i.e., the value of the principal they have invested).
As there’s no credible growth leg in many of these companies – or at least an enticing narrative – energy is being treated as something like an outsider.
In these cases, traditional earnings multiples do matter a lot more.
Conclusion
Are stocks overvalued? One of the most important things to know about the valuation matter is that all investment assets compete with each other.
Cash competes with bonds, which compete with stocks, which compete with private assets for capital. Money is always shifting between asset classes, countries, and currencies in search of the best returns relative to the risks.
Many investors make the mistake of thinking that what the recent past was like will be representative of the future.
If they’ve gotten (say) 10 percent annually on stocks, that tends to be extrapolated as normal even when the underlying conditions don’t make such returns – especially in real terms – particularly likely.
When cash earns nothing (or worse) and bonds earn nothing, close to nothing, or less than nothing, then a lot of that capital will go into riskier and more speculative assets.
This can mean a lot of regular stocks, but will also probably mean outsized performance for stocks in buzzy verticals whose economics are highly uncertain.
In the US, since 1972, cash has delivered a bit less five percent per year. The 10-year bond has given a bit more than seven percent. Stocks have yielded 10-11 percent.
Portfolio Assets (United States)
| Name | CAGR | Stdev | Best Year | Worst Year | Max Drawdown | Sharpe Ratio | ||
|---|---|---|---|---|---|---|---|---|
| Cash | 4.68% | 1.01% | 15.29% | 0.03% | 0.00% | N/A | ||
| 10-year Treasury | 7.17% | 8.03% | 39.57% | -10.17% | -15.76% | 0.33 | ||
| US Stock Market | 10.57% | 15.66% | 37.82% | -37.04% | -50.89% | 0.43 |
That environment of great returns in everything is virtually gone. Now the first two yield 0-1 percent and stocks will trade down closer to those yields as well.
Certain companies that are cyclical will not see the kind of outperformance that certain other companies will.
Investment managers will want to hold the stores of wealth that have stable earnings or the ones that are most likely to grow their earnings.
That’s going to cause earnings multiples to rise as a whole. But there’s going to be greater differentiation between what companies do well and what companies don’t. The averages won’t be representative of much.
The market might have an overall forward earnings multiple of 25x, but that doesn’t say much of how it varies by sector.
Energy and banks are going to be a lot lower than the innovative tech companies and the consumer staples that will reliably grow their earnings over time.
Traders and investment managers are going to want to hold hedges against inflation and/or currency debasement like gold, certain commodities, and inflation-indexed bonds.
They’re going to want to go to other countries that still have a normal cash rate, and a normal bond rate and yield curve, like many Eastern countries.
It’s prudent not to become Western-centric. The investment world is multi-polar, with the main reserve currency countries (US, developed Europe, Japan), China and emerging Asia, and the cyclical emerging markets that comprise most of the rest of the world.
Traders are also going to want to be well-diversified as interest rate cuts are no longer effective in the Western world in helping generate a credit expansion to offset falls in spending, earnings, and incomes.
The general idea is that old multiples are not an effective guide of what future multiples will be or should be.
The former 10x to 20x multiples that generally dictated the “fair value” range don’t apply in an environment with cash and bond rates virtually non-existent and negative in real terms.
Equity multiples will only normalize when cash and bond yields normalize in conjunction. But that would cause a massive valuation re-rating that policymakers would find unacceptable due to the way it would feed through into lower spending and incomes in the real economy.
And the multiples you get in one sector will be very different from another. Even then trying to pick the winners and losers will be very hard because the price of anything already reflects the discounted expectations.
It will be more important than normal to be diversified well among asset classes, countries, and currencies.