Is There Cash on the Sidelines?

Contributor Image
Written By
Contributor Image
Written By
Dan Buckley
Dan Buckley is an US-based trader, consultant, and part-time writer with a background in macroeconomics and mathematical finance. He trades and writes about a variety of asset classes, including equities, fixed income, commodities, currencies, and interest rates. As a writer, his goal is to explain trading and finance concepts in levels of detail that could appeal to a range of audiences, from novice traders to those with more experienced backgrounds.
Updated

Cash on the sidelines is a term that traders refer to in order to describe how much capital is supposedly out there to go into financial assets.

The price of a financial asset is just money and credit divided by the quantity of it. So while things like valuations and determining notional fundamental values of assets is important, it’s really about liquidity that drives asset markets.

The entity with the biggest lever over liquidity is the central bank, so it’s important to know what these entities are doing.

The US Federal Reserve is the world’s most prominent central bank. The ECB and BOJ take care of the eurozone and Japan, respectively. The PBOC oversees China’s monetary policy.

First, it’s important to know why all this cash is around (e.g., higher bank deposits, higher personal savings rates).

This comes from knowing the different forms of monetary policy, what type or monetary policy paradigm we’re currently in, and what effect that has on the economy and markets.


Categories of monetary policy

There are three main general categorizations of monetary policy.

Monetary policy #1: Interest rates

First, there’s interest rate-driven monetary policy. This is where the central bank adjusts short-term rates up and down to change the incentives governing private sector credit creation.

When that hits about zero, then that’s gone.

That means the boom-bust cycle, as we commonly know it, is gone.

In 2019, central banks around the developed world had virtually given up on trying to normalize interest rates.

They didn’t want to tighten because debts relative to income were so high. That creates asymmetric risks when it comes to any potential decision to tighten policy.

Inflation wasn’t a problem, but it’s easy to topple over markets and then the economy with just a small amount of tightening. The Fed found this out in Q4 2018.

They didn’t tighten because the ability to ease with such low interest rates was limited.

In a typical downturn, central banks ease by about 500bps to get a floor under the credit market. That helps to stabilize the financial economy and then the real economy at some point thereafter. Markets lead the economy.

A cut in interest rates normally produces an expansion in credit.

But if debt to income ratios are high and you can’t cut interest rates to generate that kind of credit expansion, then the ability to effectively save the economy, when necessary, is low.

So, they get into a situation where central banks don’t want to cause a downturn because they won’t be able to pull out of it. As a result, they don’t tighten.

Monetary policy #2: Asset buying

When short-term interest rates are about zero, they move onto quantitative easing, a type of asset purchase program. That works when risk premiums are high and liquidity is tight.

That’s also no longer the case throughout the developed world.

The Covid-19 pandemic produced enough economic harm to the US and European economies to the point where their central banks had to produce a lot of liquidity to make up for the shortfall in spending, incomes, and overall economic activity.

When longer term interest rates (basically the yields on bonds) were pulled down to zero, then they had to move onto the third form of monetary policy.

Monetary policy #3: Monetary and fiscal policy coordination

The third type of monetary policy is a type where it’s driven by fiscal policy in determining how much money and credit is needed and the central bank supports those actions.

Some might call this ‘MMT‘ but it’s how it’s always worked historically when money and credit expansions couldn’t be generated in normal ways.

Basic evidence of all this new liquidity

In the spring and summer of 2020, the Fed created a lot of new liquidity in order to replace lost spending and incomes due to less economic activity.

This ended up in new bank deposits.


Deposits, All Commercial Banks (US)
fred chart
(Source: Board of Governors of the Federal Reserve System (US))


The personal savings rate in the US went from about 7 percent at the end of the year to about 34 percent in April 2020.

People wanted to be defensive and saved in case they lost their jobs. And they also had fewer things to spend money on with travel, leisure, entertainment, and most public places and gatherings shutdown to control the spread of the virus.


Personal Savings Rate (US)
personal savings rate
(Source: U.S. Bureau of Economic Analysis)


In this world where we’re on the third form of monetary policy, at least in the Western world, the decisions have largely shifted to the politicians and away from central banks in terms of how economies are primarily governed.


Political risk

While fiscal and monetary coordination is essential, and this is always how it’s worked historically, it’s fraught with political risk.

When you have higher wealth gaps and opportunity gaps in an economy, and especially when you have an economic downturn, this spills into social movements. In turn, this impacts what kind of leaders get chosen. This naturally has a feed-through into ideological gaps and greater political polarization.

For many things to get passed, there needs to be some consensus and middle ground.

There’s always the risk that it’s not adequate and either nothing gets done or not enough gets accomplished.

Both parties are likely to alienate the other if they’re trying to use “stimulus” bills as part of their power plays – e.g., writing in certain agenda items to pass along with everything else.

The thinking is that if certain spending bills are badly needed, then sneaking in pet legislative ambitions would be the most opportunistic time to do so because they are more likely to get passed.

When each side picks up on the discreet tactics of the other, saying that such items have nothing to do with what’s actually important and really needs to get done, then they can claim that their opponents are trying to torpedo everything to detriment of society for something extremely small. Such is the environment associated with the political decision-making process.

It also presents a new type of world that all market participants need to understand. How to allocate capital, what assets to invest in, and what portfolio approaches to take is important to understand.

The Covid-19 downturn was unique because it was caused by income literally falling.

As part of the distancing process, people stayed home, they worked less and spent less, and economic activity dropped in a big way.

Normally, a downturn works through credit through a tightening in monetary policy through a rise in interest rates, typically to rein in inflation. Debt servicing obligations rise in excess of incomes, credit availability, and money and liquid assets.

In these cases, credit gets hit first and income later. You see this in certain statistics like the unemployment rate, which is a proxy for the amount of spending in an economy.

Though unemployment rises during a recession, it actually generally peaks very early in the ensuing expansion and not during the actual recession itself. Labor is typically a lagging indicator. This can be observed in the graph below.

With the Covid-19 downturn, income was hit first, producing the high unemployment rate right at the beginning before tailing off afterwards.


Unemployment rate, U-3 (US)
u-3 unemployment
(Source: U.S. Bureau of Labor Statistics)


The economy turns down, and the central bank rectifies the imbalance with a cut in interest rates in terms of the normal way it works.

That didn’t and couldn’t happen because monetary policies one and two were out of gas, so it transferred over into the fiscal side of government with the monetary side assisting in the ways they could.

Debts continued to climb to offset the lost incomes from the distancing process.

Debt creates a liability on one side of the balance sheet (heavily in the public sector) and has created a lot of cash and savings on the asset side of the balance sheet(heavily in the private sector).

But it’s come at the trade-off of severely limited potential growth rates in the post-virus world.

It also increasingly puts the emphasis on fiscal policy, instead of monetary policy, as the main lever over the economy. You may get more fiscal policy support (or not) based on the individual willingness of any country to do so.

Each country runs into its own constraints in that process. Eventually the debt becomes too high and the printing of money to fill in the gaps creates problems in various ways (e.g., currency devaluation, inflation, balance of payments problems).

It’s the biggest issue for emerging markets because they don’t have much global savings in their currencies – namely, they aren’t reserve currencies.

After that, the next countries to run into constraints would be smaller reserve currency countries (e.g., Australia, New Zealand, Canada, Great Britain, Japan, Switzerland). Then followed by developed Europe and the US.

As a result, the biggest recipients of all this liquidity are the euro area and the US, using the power of their reserve currencies. They can simply push this process further than other countries. But there are always constraints to everything.

The US is seeing pressures on its exchange rate as the result of its policies, both relative to other global fiat currencies and relative to non-fiat contra-currency stores of wealth like gold.

And these important divergences are important to point out, as this is mostly a matter of what’s going on in the West. But this tertiary monetary policy regime doesn’t apply to China and most countries in the East.

The economic destruction and liquidity expansion – the latter being the whole cash on the sidelines element – is really a figment of the West and not the East.

Mobility data is a good proxy for economic activity as a whole.

At first, the mobility data dropped a lot. Then it came back somewhat but not back up to baseline, about 20 percent below. Then it stagnated.

Global Retail Mobility vs. Global GDP

Global retail indicator

(Source: Google Mobility)


Monthly Retail Mobility Data vs. Economic Activity Across Countries since March 2020

google mobility data


The longer that level of income and spending remains depressed (and there are big divergences between sectors, countries, and assets), the more will be required on the behalf of the fiscal side of government to replace that.

And the greater the pressure on whoever is dependent on that income. That accumulates over time.

The combination of depressed income and spending and high levels of liquidity is going to produce divergent outcomes in terms of who gets the money and what types of assets benefit.

Store of wealth assets – e.g., certain equities, certain commodities, inflation-linked bonds – have benefited based on expectations of what will be safe.

You probably don’t want cash or regular low-yielding nominal rate bonds if they’re creating and issuing a lot of it.


What to do about cash?

As a result of all these policies, there’s a lot of cash being held. People and businesses are not sure what comes next. And in any crisis, they begin saving more.

Cash doesn’t yield anything in the developed world, so it’s not much of an asset. It loses spending power over time.

People know this and these are the incentives central banks create to get more investment and spending in the real economy.

So, does cash on the sidelines get liquidated, does it get swapped for another asset eventually, or does it stay in place as a longer-lasting “rainy day” fund?

Even though cash is the worst investment over time, people still need to save. And a lot of people like cash simply because its value doesn’t move around much like taking risk in other assets.

Around the world, the accumulation of cash balances was around 5x what you normally see in response to the virus.

New cash became about 13 percent of GDP globally, or 17 percent of GDP in the US.

That’s a huge amount of cash to be sitting in bank accounts.

Savings rates are also important.

Personal savings rates are defined as personal savings as a percentage of disposable personal income (DPI). It’s calculated as the ratio of personal savings to DPI.

Personal savings is equal to personal income minus personal outlays and personal taxes. It is commonly viewed as the portion of personal income that is used to provide funds to capital markets for investments in equities, bonds, and so on, or to invest in real assets, such as homes.

Savings rates matter a lot as a potential source of “juice” for asset markets.

In the US in July 2005, because of the bubble that was getting started in housing, savings rates were only 2.2 percent. That’s the low point on the graph bel0w.

From 1960 to 1985, 10 to 15 percent savings rates were common. From 1985 to 2005, 5 to 10 percent was normal before dropping again.

They then returned to the 5 to 10 percent range after the financial crisis.


Personal Savings Rate (US)

personal savings rate


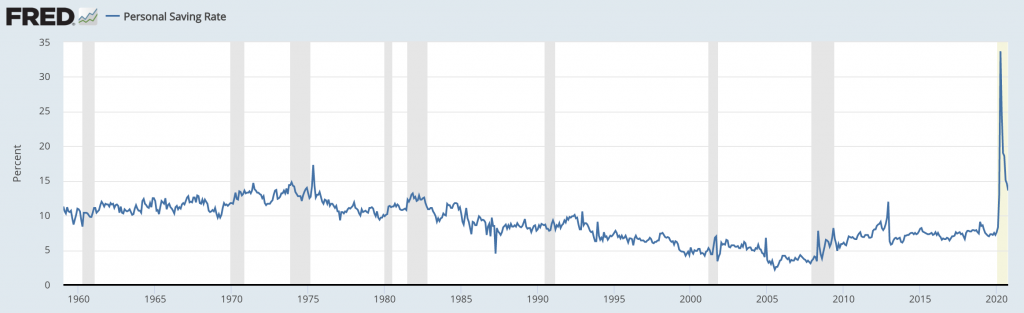
Why were they so high in the 1960s and 1970s? There’s likely the element of those individuals growing up in or living through the sparse 1930s period, where many people developed strong savings and financial cautiousness mindsets.

As the new generation came into adulthood, growing up in the post-1945 boom period, those savings rates began to decline more or less until the financial crisis.

Then it rose back up a bit, though central banks orchestrated a historically great bull market in stocks by lowering interest rates to zero and buying financial assets as part of the main two forms of monetary policy (much as they did back in the 1930s).

Post-virus personal savings rate

Post-virus, the savings rate rose by a lot and is staying somewhat elevated.

In other downturns, as the diagram in the preceding section shows, you only saw slight ticks up in terms of the personal savings rate.

So, it’s a unique question for economies and markets because we’ve never had to deal with this type of situation before.

If there’s a lot of cash on the sidelines, the first thing you need to figure out is who has the cash.

People in different income deciles and quintiles have different propensities in terms of what they do with their money.

When the US sent out support checks during the pandemic, that was capped at an income of $99,000 and began tapering at $75,000.

So, it heavily went to the lower- and middle-income brackets.

The chart below breaks down uses of the money by household income. The lower-income brackets heavily spent it on food and basic needs and put little into savings. The middle-income brackets spent less of it and saved more of it.


cash on the sidelines

(Source: The Economist)


Debt repayment was pretty even throughout in terms of the percentage.

Taking the middle-income people who account for a lot of the new cash in bank accounts, when they come out on the other side of the pandemic, there are questions about where it goes and the longer term impact on markets.

Are they going to spend that money?

Are they going to continue to save it?

Are they going to put it into investment assets?

Clearly, people are going to be motivated to use a lot of it in improving their financial security or their lives in some way. It’s just a matter of what that means.

Some of it will mean paying down debt. In the middle-income levels, about 30 percent of the stimulus payments went into debt repayment. In the lower levels it was around 20 percent.

It could also mean saving for a big-ticket purchase. That could mean travel or a vacation. The kibosh on those particular leisure pursuits was put on that during the pandemic. Travel and leisure will be one of the last sectors of the economy to fully recover and will take years.

It could also go into a longer run goal like saving for kids’ college.


Cash on the sidelines and into… housing?

Housing is also an interesting one.

If you look at the breakdown of assets by income and wealth levels, in the middle net worth range, it’s not equities and other financial assets as the main item.

Their largest asset is a house.

If we go by the net worth tiers, from the beginning of the five-figure range ($10k) to the ten-figure range ($1 billion), we see some clear trends.


net worth asset type

(Source: Visual Capitalist)


In the five-figure range, many people rent. Many do own a house, but have a low net worth because of the debt owed on it or from other forms of debt they have (e.g., student loans, personal loans, credit card debt).

Their vehicle is a large component and that’s a depreciating asset.

In the six-figure range ($100k to $1mm), then you’re in the middle class area where a lot of adults in developed markets end up.

A house takes up about half of their net worth. Stocks, or discretionary investments, take up only a little bit. Most of their investments are wrapped up in their pension, 401(k), or RIA in addition to the wealth stored in their home.

And, of course, as you get higher, then the housing part shrinks and business interests and discretionary investments begin taking on a higher proportion.

So, having a lot of those cash balances go into a down payment on a house is an interesting possibility.

With government front-end rates at zero, the 30-year fixed rate mortgage is under three percent in the US.


30-Year Fixed Rate Mortgage (US)

mortgage rates

(Source: Freddie Mac)


If mortgage rates are only two to three percent, that means the interest payment isn’t much.

A $500,000 home with a 20 percent down payment ($100k down payment, $400k mortgage) with a 2.75 percent interest rate over 30 years is only paying a bit more than $1,600 per month in principal and interest, or around just $20,000 per year.

The monthly payment isn’t much because the interest is so low and total owed on the amount borrowed is spread out over 360 months.

So, the main limitation on housing is in the down payment.

Then you look at the monthly supply of houses in the US, it’s very low. It traditionally stayed between 4 and 7 months during the last expansion after all the excess supply from the 2008 bust was sopped up in 2012 (the year of the eventually bottom in US housing).


Monthly Supply of Houses in the US

housing supply

(Sources: Census, HUD)


With the Covid-19 crash, that dropped to about three months’ supply.

All that liquidity on individual balance sheets in combination with a restricted supply of homes brings up an interesting dynamic in the residential housing market.


On the savings rate dynamic

When you look at the cash on the sidelines in terms of the personal savings rate, when that comes down that does go into spending.

But it’s interesting in terms of what’s causing that savings rate to be so high and in a way that’s out of character with other recessions where savings rate don’t typically move much.

It’s really the high-income groups that have saved.

The reasons behind that savings can be found in certain items like transportation in the consumption report (which is released by the Bureau of Economic Analysis (BEA)).

It’s really what people are spending more on and spending less on, and the difference nets out to savings.

Transportation has gone way down because people want to distance and be safe.

More spending has gone to things like leisure items (e.g., boats, airplanes) and less to traditional leisure and lodging.

If people like their new lifestyles to a point where travel for leisure or for business remains impaired in some way, then that savings rate isn’t going to come down to more normal levels.

It’s not that they don’t want to spend; it’s just that there’s a reluctance or lack of need for certain traditional big category items.

The virus for a long time is the key determinant in economic outcomes globally. It’s remained a drag in the Western world more so than a continued drag in the Eastern world.

That will cause continued policy response by Western governments, which goes back to the policy approaches taken as discussed earlier in this article.


Conclusion

The cash on the sidelines concept is an interesting economic question due to the way governments must now run policy in a coordinated way between the fiscal and monetary arms.

The main driver of liquidity is traditionally central banks but is shifting more into fiscal policymakers who must decide who will and who won’t receive that money.

Who gets the money can have a big impact on how it gets spent. A lot of balance sheets have been built up and it’s a question of how is that going to get put to use?

It could mean certain big-ticket purchases. It could mean a longer term savings plan in a mix of traditional financial assets (cash, bonds, stocks).

Housing is a wild card. The supply of homes was constricted following 2008 and also went down a lot following the Covid-19 pandemic.

For a lot of holders of this new liquidity in the middle-income groups, a house is something they generally want if they don’t have.

Housing is generally around half of the net worth of the average middle class household, as defined as a net worth between $100k and $1mm.

With record-low mortgage rates and a bump in liquidity, you could see more of that converted into residential real estate.