Price Earnings Ratio (P/E Ratio)


The price earnings ratio, commonly known as the P/E ratio or sometimes PER, is the ratio of a company’s share price relative to its earnings per share (EPS).
P/E = Price per share / EPS
Some mistakenly calculate the P/E ratio as the market capitalization of a company (“price”) relative to its annual net income (“earnings”) or a projection of net income going forward (usually the next twelve months).
The Best Brokers For Trading Against P/E Ratios


But market capitalization takes into account any new equity that has been issued.
Market cap is current shares outstanding multiplied by the current price per share while P/E reflects the average number of shares (over a certain period) divided by net income.
The P/E ratio is usually quoted on a trailing twelve months (TTM) basis – “trailing P/E” – or on a “forward” basis (i.e., the next twelve months) – “forward P/E”.
Example
If a company trades for $72 per share and has earned $4 per share over the past twelve months, its P/E ratio is $72 divided by $4, or 18x.
18x represents its trailing P/E.
If the company is expected to grow its earnings per share 50 percent over the next twelve months, that would come to $6 per share.
Then its forward P/E ratio would be $72 divided by $6, or 12x.
Markets are forward-looking and generally place more emphasis on forward measures rather than trailing.
Trailing P/E vs. Forward P/E
Trailing P/E is generally the more commonly quoted version of the price-earnings ratio, given it represents earnings that have already been listed on the company’s income statement.
They are updated quarterly, such that four quarters of data are always included.
Forward P/E ratios are determined by analyst estimates and based on projections.
Some estimates will used operating earnings. This discounts the effect of one-time gains or losses or extraordinary items that are not representative of earnings derived from normal operations.
Trailing P/E is generally higher than forward P/E. This is because earnings tend to rise over time, causing the denominator (earnings) to rise in value, lowering the ratio.
How To Interpret The P/E Ratio
The P/E ratio essentially tells you how much investors are paying today for $1 of a company’s annual earnings. So if a stock is trading at $100 per share and earns $5 per share annually, its P/E is 20. That means investors are paying 20 times annual earnings.
Sometimes people loosely interpret this as ‘about 20 years of current earnings,’ but it’s not a literal payback period and should not be confused with dividends or distributions.
Earnings of public companies are reported quarterly, though EPS carries the implication that the unit of time is at the annual level unless otherwise noted.
A Measure Of Value
The P/E ratio is a common measure of value. It helps investors determine how shares of various companies may be valued relative to each other.
P/E ratios also vary quite a bit by industry.
In lower-growth industries like financials or industrials, P/E ratios tend to be lower.
In higher-growth industries like tech, their P/E’s tend to be higher.
When companies are trading at very high P/E’s, such as 50x or 100x or more, this generally denotes that the market expects them to be earning a lot more in five or more years to justify that valuation.
On the flip side, a single-digit P/E ratio (i.e., 10x or less) does not necessarily mean that the stock is cheap.
It could mean that the company is viewed as being in secular decline and seeing negative growth and/or earnings that are not sustainable going forward.
Some investors depend on P/E as a measure of value and lean on the ratio for buying stocks at a perceived bargain.
Others place little emphasis on the measure. All of a market’s expectations are already embedded within the price.
While higher P/E stocks may be better companies, they also tend to be more expensive. This brings with it the implication that their forward returns may be lower accordingly.
Like in sports betting, it is pretty easy to make predictions about what teams will be superior to others. But it’s not easy to convert that knowledge into winning bets because of how their prices reflect all that is currently known.
Similarly, it is not easy to simply buy low P/E stocks and sell (or short sell) high P/E stocks and come out ahead relative to a representative benchmark.
P/E also reflects a limited timeframe. The cash flows of stocks are theoretically perpetual, so the influence of future expectations a long time out has an influence on the stock’s price.
P/E reflects only the past year of earnings history relative to the current stock price or an estimate of earnings projections one year forward. But markets are always discounting growth and risk many years or decades in advance.
P/E As A Measure Of The Earnings Yield
The inverse of the P/E represents the earnings yield of a company. If a company’s P/E is 20x, then the reciprocal of that number – 1 divided by 20 – is the earnings yield, or 5 percent.
The investor could interpret that figure as the investment generating a return of 5 percent per year.
There is, of course, matters related to risk, growth, and the stability of earnings to take into consideration.
While it might take 20 years for earnings to cover the price, earnings are quite unlikely to stay constant over time.
Index Wide P/E Ratio
We can also look at P/E not at the level of not just the individual security, but at the level of the index.
The S&P 500 is a market cap weighted index. Each individual component prices add up to form the total value of the index.
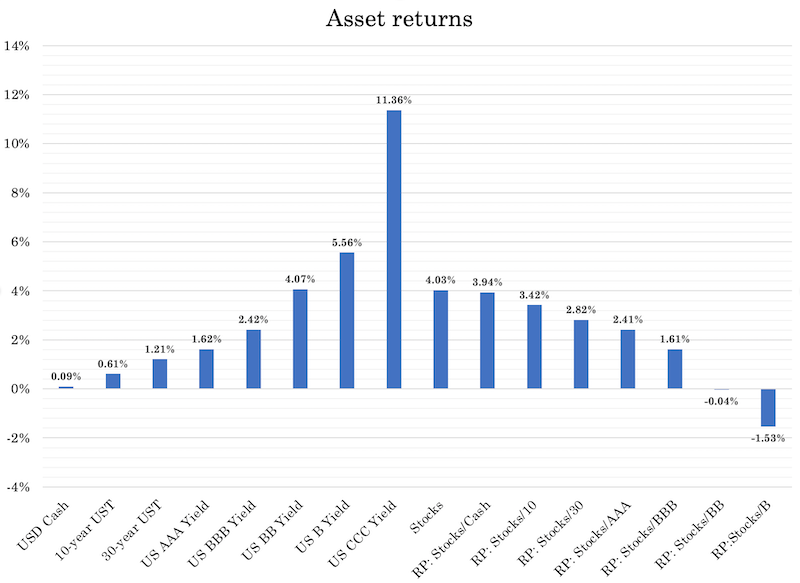
For example, if the S&P 500 is earning 140 and the index is priced at 3,473, then the P/E is 3,473 divided by 140, or slightly more than 4 percent.
We can also compare this alongside other asset classes and look at the risk premiums (“RP”) between them:
What Is The P/E Ratio Of A Company With Negative Earnings?
Technically, a company’s P/E can be negative, but it is generally expressed as “not available or N/A” if its earnings are zero or negative.
Historical P/E Ratios
The average P/E for US-based public companies typically varies between 10x and 20x since the beginning of the 20th century, with the mean somewhere in the middle.
P/E rates vary based on capital gains taxes, transaction costs, and the prices of competing investments.
When cash and safe bonds offer higher yields, more investors become attracted to these safe assets in relation to riskier stocks, compressing the P/E multiple.
Likewise, when cash and bond yields are low, more investors turn toward stocks due to inadequate returns elsewhere. This increases their prices relative to their earnings, sending P/E multiples higher.
Sometimes they can go to extreme lows or highs depending on the economy and other market conditions.
In the US, the P/E ratios of equities reached a low of 4.8 in December 2020 during the 1920-21 recession and a high of 44.2 in December 1999 near the peak of the tech bubble.
Though 10x to 20x has been considered a normal range, what is sustainable depends on economic growth, tax rates, and the prices of other investments in relation.
Many academics and investors have noted the inverse correlation between high P/E ratios and low forward investment returns.
Starting P/E ratios vs. 10-year returns
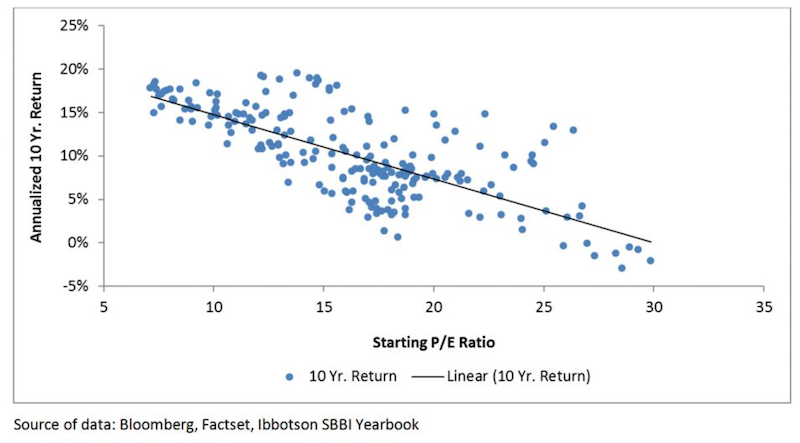
It shows that once P/E ratios get above the 25x mark, 10-year forward returns average a little bit less than zero.
When they get below 15x, the next ten years often see annualized returns of 10 percent annualized or higher.
The general idea is the standard “buy low, sell high”. But this is harder to do in practice.
Markets classically top when all available buyers are off the sidelines and liquidity is being drawn out of the financial system by the central bank (usually from the tightening of money and credit from higher interest rates).
Markets also classically bottom when people need to sell assets to make their payments and a huge amount of stocks, bonds, and other financial securities are up for sale.
Central banks come in to put more money and credit into the system by lowering short-term interest rates, and if necessary long-term interest rates as well by creating money and buying financial assets.
What’s the Right Price to Pay for a Promising Future?
Imagine a business that is projected to generate $1 million in profit next year and then cease operations.
How much should you pay for it?
The logical answer is somewhat less than $1 million, which would give you a positive return on your investment.
As we’ve covered, stocks are typically valued using “P/E multiples,” or multiples of projected earnings for the coming year.
This is fundamentally because a company’s profitability isn’t expected to be limited to a single year – it’s assumed to continue for many years.
When you purchase a stock, you’re essentially buying a claim on the company’s future earnings. Historically, the S&P 500 has traded at an average price-to-earnings ratio of about 16 since World War II.
This is often described as “paying for 16 years of earnings.”
However, due to the concept of discounting – where future earnings are worth less than current earnings – a P/E ratio of 16 actually represents the present value of more than 20 years of expected earnings, depending on the discount rate applied.
During market bubbles, certain stocks have traded at significantly higher multiples. For example, the Nifty Fifty stocks of the late 1960s were priced at 60-90x earnings.
Investors back then were effectively paying for decades of anticipated profits, even after accounting for optimistic growth assumptions.
However, many weren’t considering it at all given the implicit growth assumed.
The leading companies in today’s S&P 500 are arguably far superior to the best companies of past decades.
They benefit from transformative technologies, enormous scale, dominant market positions, and exceptional profit margins.
Additionally, many of their products are idea-/code-based rather than reliant on physical materials, meaning the cost of producing additional units is low, resulting in unusually high profitability.
Unlike the lofty valuations of the Nifty Fifty era, today’s market leaders generally trade at more moderate multiples. For instance, Nvidia, a top designer of artificial intelligence chips, has a P/E ratio in the low 30s at the time of this writing, depending on the earnings estimates used.
While this is about double the historical average for the S&P 500, it’s far less than the Nifty Fifty’s peak valuations.
Yet a multiple in the 30s carries certain assumptions: that Nvidia will remain operational for decades, that its profits will consistently grow, and that it will fend off competition.
In other words, investors are banking on Nvidia’s long-term resilience.
However, achieving resilience is particularly challenging in high-tech industries, where rapid innovation and new competitors can displace incumbents.
It’s worth noting that only about half of the Nifty Fifty companies are still part of the S&P 500 today.
Many names from that era, such as Xerox, Kodak, Polaroid, Avon, Burroughs, Digital Equipment, and Simplicity Pattern, are no longer in the index.
While mergers and acquisitions (rather than failure) have caused some of these companies to vanish, others struggled to adapt and were eventually overtaken by newer players.
P/E ratio And Its Use Among Management Teams
Management teams are often paid in stock or stock options in their company. This is used to align the interest of those running the company, or officers within the company, with those of other shareholders.
Generally, the stock price can increase via the business either earning more or by achieving a higher multiple (i.e., a higher P/E ratio).
A higher P/E ratio can be achieved through higher future growth rates, or creating the perception that the company will grow more in the future. It can also be achieved through lower rates of return on other investments like cash and bonds, which incentivizes more investors to move into stocks.
As a result, managers want to boost earnings per share in the present while also improving growth rates in the future.
This could lead management to do the following:
i) Find ways to make earnings steadier over time. Investors generally reward greater reliability in earnings (and/or higher earnings) through a higher share price.
Management teams may consider diversifying the risk by building multiple revenue streams and additional business units.
For example, an oil and gas company may choose to have both upstream (exploration and production) and downstream (refining) units. Those engaging in exploration and production generally benefit from higher oil prices because selling oil is the business. Refineries, who purchase oil, tend to benefit from lower oil prices.
ii) Management may want to acquire a high-growth leg for their company. This may mean buying a company with a higher P/E ratio.
This may also help with getting the market to positively re-rate the company with more of a growth multiple.
iii) Companies that use their own stock to buy higher growth companies may face dilution to their own share price in terms of the way the EPS math works.
This can knock the share price as investors prefer to not be part of deals that are dilutive. This entails the issuance of stock in excess of the earnings they’re acquiring.
As a result, cash or debt funding may be preferred for the acquisition of higher-growth companies. This adds earnings while keeping the share count the same, therefore boosting EPS.
iv) Companies with lower P/E ratios may choose to take on more debt instead of equity.
Debt is cheaper than equity, given debt’s seniority in a company’s capital structure, and it doesn’t dilute ownership.
A higher debt to equity capitalization may help improve a share price by keeping earnings per share higher than it would be otherwise.
This, of course, assumes that the debt piled on the balance sheet doesn’t cause stress that would actually hurt the share price.
Outside the financial engineering component, debt also of course conveys spending power. In turn, it can be used to make investments that boost earnings.
v) Company’s may choose to report greater stability in earnings by working doing its financial reporting and accounting in a certain way.
They may choose to pull forward certain revenues in one quarter while delaying expenses to a future quarter during “down” quarters. Or they may defer revenue into future quarters or pull forward certain expenses in “good” quarters.
This may help smooth out earnings over time while growing them at the same time. Investors reward reliability and growth.
The P/E Ratio And Its Relevance Today
P/E ratios among developed market stocks are higher than they normally are.
We’re in a zero interest rate world and will be for a while. This is the most important theme governing financial markets currently and has material implications for portfolio construction and how to think about valuations.
In the developed world, cash rates are zero practically everywhere. In some places (e.g., developed Europe, Japan), they are negative. In the US, some parts of the curve briefly went negative, anticipating that the US could be forced to go this route as well, though the Federal Reserve is likely to use other tools.
Short-term interest rates: US, Japan, UK
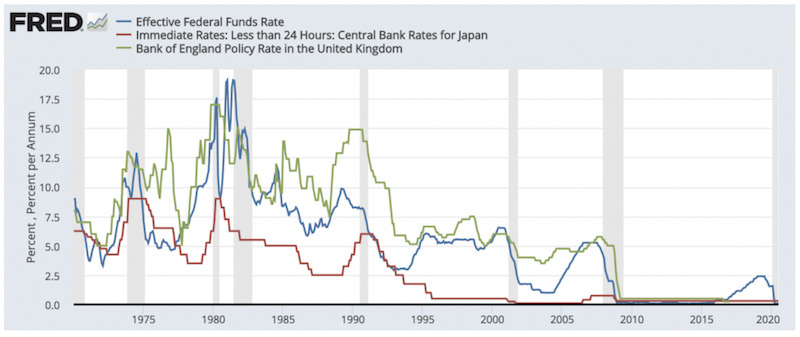
(Source: St. Louis Federal Reserve)
When cash rates are low, this tends to pull bond rates down with them.
Central banks have also pressed longer-term interest rates (i.e., those associated with bonds) down very close to zero or below zero to provide additional assistance to the economy.
When everything else is low yielding, stocks bend down to these types of yields as well.
By extension, this means we’re in a period where the forward returns of practically all financial assets will be low across the board. There will be winners and losers within asset classes, but these are difficult to predict as the range of knowns is already priced in.
While such central bank support is necessary, it makes markets susceptible to persistent overvaluation, which you’ll see in the form of high P/E ratios.
The forward returns are lower, but the risks remain the same or are in some ways elevated.
The yield of stocks is more difficult to determine relative to cash and bonds because they don’t come with advertised rates.
With fixed income securities, you always know the yield. The only time that yield differs from what’s always published is if the issuer defaults.
Equities convey ownership in a business that represents the cash available to shareholders after everyone else has been paid.
Stocks are perpetual cash flow instruments.
While P/E can get at the earnings of the previous twelve months or estimate the next twelve months to get at an earnings yield, this level of earnings fluctuates throughout time.
Their longer duration and uncertainty in future cash flows makes their structural volatility higher.
What we do know is that stocks, over the past 50 years or so, have had an extra 3.2 percent annual return over 10-year Treasury bonds.
Portfolio Assets
| Name | |||||||||||||||||||||||||||CAGR | ||||||||||Stdev | Best Year | Worst Year | Max. Drawdown | Sharpe Ratio |
|---|
| US Stock Market | 10.39% | 15.60% | 37.82% | -37.04% | -50.89% | 0.42 | ||
| 10-year Treasury | 7.21% | 8.03% | 39.57% | -10.17% | -15.76% | 0.34 | ||
| Cash | 4.69% | 1.01% | 15.29% | 0.03% | 0.00% | N/A |
So, if mid-duration “safe assets” yield 50bps or less, there’s very little to no discount rate in terms of the risk free yield.
Accordingly, if there’s no discount rate – i.e., the rate off which the present value of future cash flows can be calculated to get at a stock’s fundamental value – then you’re just left with the risk premium (traditionally that 3 or so percent).
If a 10-year bond yields 50bps and the risk premium is that 3.2 percent, the discount rate becomes about 3.7 percent.
The inverse of that 3.7 percent represents the price-earnings ratio, or about 27x.
This is well above the 10x to 20x we’ve seen and been accustomed to historically.
If the 10-year bond yield dips down to zero percent as it has in Japan and many developed European countries, and the reach for yield starts to push down the risk premium as well, then the P/E ratio can become even more inflated.
If the risk premium is 2.5 percent and the 10-year risk free reference point is zero, then the P/E ratio of the market becomes 40x (one divided by 2.5 percent).
Traditional Notions Of Value Are Out The Window
That means traditional indications of value, like the 10x to 20x P/E ratios that investors have become accustomed to are extrapolations of a previous environment in which yields on safer assets were much higher.
Cash over the past half century has yielded between 4 and 5 percent in the US. It’s now zero throughout the developed world. Ten-year bond yield averaged out to just over 7 percent over that same period. They’re also now very close to zero.
Stocks yield a bit over 10 percent, so we should expect those returns to come down by quite a bit as well.
These 10+ percent annualized returns came as a function of:
- higher inflation
- higher productivity rates
- higher population growth (including more women entering the labor force), and
- a huge interest rate tailwind over the past 40+ years, with 10-year bond rates coming down from 15 percent down to around zero
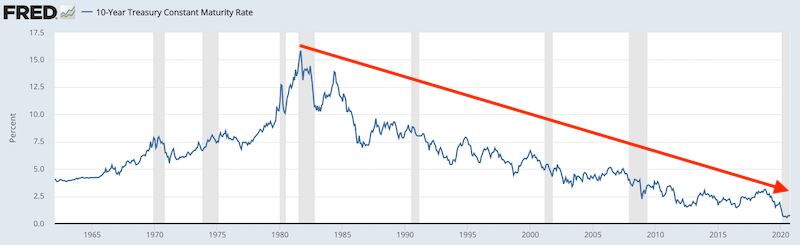
(Source: Board of Governors of the Federal Reserve System (US))
None of these factors are repeatable, though we may potentially get higher inflation.
Higher inflation can make asset returns high in nominal terms but high real returns are no longer very likely. Namely, investors might still see decent returns holding some stocks, but the returns are not likely to convey large amounts of higher real spending power as they have in the past.
For instance, in an environment where the cash yield was 5 percent, mid-duration safe bonds may have given you 7 percent, and stocks would typically yield around 10 percent (10x P/E). This would keep in line with the typical risk premiums.
But if cash and bonds are now at zero yields, and stocks keep that same ~3 percent premium over bonds, your P/E is now 3x to 4x higher than your averages seen over the past 50 years or so.
The implication of this, for instance, is that a company with a $50 billion market cap might expect to earn around $5 billion per year. A 10 percent market-wide yield on stocks would convey a P/E ratio of 10x.
Now with those $5 billion in earnings discounted at a higher earnings multiple given zero interest rates and keeping in line with the historical risk premium of stocks over safe bonds, it might be valued as a $150 billion to $200 billion company instead.
This is a direct consequence of central banks pushing more liquidity into the financial system (e.g., zero interest rates, asset buying programs, special credit and liquidity programs).
The direct purpose of asset buying programs is to close the spreads of longer-duration assets to encourage lending and push investors into riskier assets, which helps create a “wealth effect”. This lowers their forward returns in both absolute terms and also relative to other assets.
But it also creates more risks by decreasing returns relative to risks, currency depreciations that come with zero interest rates and the need to print a lot of it, more leverage, and the potential for asset bubbles to develop.
All Assets Compete With Each Other For Investor Capital
All assets compete with each other.
Once other assets get bid up, others look more attractive in relative terms even if their returns in absolute terms are worse.
For most of the post-2008 period, financial assets didn’t look attractive in terms of absolute yields, though they didn’t go to extremely high levels relative to cash.
Even if the forward returns on stocks are about 3 percent in developed markets going forward and priced at 30x or higher earnings multiples instead of the 8x to 20x P/E ratios in recent history going back decades, the risks are actually higher.
Low productivity growth and aging populations will keep real returns low going forward.
Based on the previous studies showing P/E ratios of 25x or more resulting in forward ten-year returns of about zero, that’s also likely to be the case, particularly if one is talking about real returns.
When the returns of riskier or higher duration assets get down close to zero, then it increasingly no longer makes great sense to own them, especially in a concentrated way.
For example, if the 10-year yield is 50bps, and your upside is the yield going down to minus-1 percent and your downside is a normalization in real rates plus an inflation rate of four percent, your risk is about 3x your potential reward.
And if stocks only yield about 3 percent going forward or 30x earnings or higher, that type of return can easily be wiped out in a day or so.
P/E As A Way To Determine Duration
Investors can measure the estimated duration of the assets they own and what a modest tightening in monetary policy would do to its price.
When P/E ratios expand, that also makes them more sensitive to changes in interest rates because their durations become longer.
For example, if an asset has a forward yield of three percent and is a perpetual cash flow instrument (i.e., a stock), that means its earnings multiple is the inverse of that, or 33x.
That means a one percent rise in rates could potentially cut the value of the asset by up to one-third, holding all else equal, multiplying that one percent by the effective duration of the asset.
Conclusion
The price-earnings ratio (P/E ratio) pertains to a company’s share price relative to its earnings per share (EPS).
A higher P/E ratio could mean that investors are expecting high growth rates in the future. Some investors may also interpret it as a sign of overvaluation.
A company that has no earnings or negative earnings is not typically given a P/E ratio, as the ratio doesn’t convey meaningful information is the denominator is zero or negative.
The exception is when a non-earning or negative-earning company is expected to make a net profit over the next twelve months. In such a case, the company would not have a trailing P/E ratio (past twelve months of earnings history) but would have a positive forward P/E ratio.
Lower interest rates are correlated with higher P/E ratios, as the present value of cash flows is discounted at a lower rate (assuming the risk premium doesn’t rise to offset).
When the interest rates (i.e., yields) on cash and bonds fall, so do the forward returns on stocks through the increase in their prices.
The earnings yield of a stock – as measured of the past year (trailing P/E ratio) or forward year estimate (forward P/E ratio) – is represented by the inverse of the P/E ratio.