Characteristics of a Market Top


In Part I, we covered the early stage of the bull market and the bubble phase. Here in Part II, we are covering the characteristics of a market top.
Market top
Markets that become driven from a lot of leveraged buying are prone to reversals.
This reflects the general idea that when things are so good – and they’re unsustainably priced to reflect these expectations ad infinitum – a market top is more prone to forming.
Tops occur for various reasons. Usually they form when the central bank starts to tighten monetary policy and interest rates rise more than what’s discounted in.
Sometimes monetary tightening is brought about by the bubble in financial assets. The financial economy provides money and credit into the real economy.
So, the financial economy (i.e., the markets) is a leading indicator of the real economy.
When demand grows in excess of supply and inflation occurs in the real economy, it’s an indications that capacity constraints are starting to kick in. Inflation and nominal growth start to rise, which causes central bankers to want to tighten policy.
In some cases, monetary tightening is driven from external forces.
For instance, for a country that’s become reliant on external funding, the pulling back of this funding due to certain causes will lead to liquidity tightening.
Foreign capital can be pulled back when there’s a tightening in the monetary policy in the currency in which the debts are denominated in.
This can happen for exogenous reasons that are not directly relevant to conditions in the domestic economy. For example, a financial crisis in the reserve currency country can result in a pullback of capital to the countries they lend in.
Cyclical conditions in the creditor country can tighten money and credit, reducing their lending to offshore borrowers.
Especially in emerging markets, a rise in the currency the debt is denominated in relative to the currency incomes are generated in can cause an especially large squeeze. It’s the equivalent to a large rise in interest rates.
Also, unexpected shortages in cash flow for a variety of reasons can trigger a debt crisis. It’s also especially problematic when debt problems are located within key entities of an economy.
This is common with financial institutions who provide lending and key financial support to various parts of an economy.
Regardless of the cause of this squeeze in debt servicing commitments, asset prices get hit, particularly risk assets such as stocks and corporate credit.
This has a feed-through effect into the economy as lenders begin to worry that they won’t be able to get their money back from those they lent it to.
Borrowers get squeezed as more of their share of new borrowing isn’t rolled over and/or has to go toward debt service requirements. Their spending slows.
One person’s spending is another person’s income, which is a loop that feeds on itself in positive conditions.
The opposite is also true. In the reverse process past a market top, spending slows and as a consequence incomes fall.
The way borrowers traditionally get squeezed is due to people buying assets at high prices with leverage. Rising prices tend to reinforce optimistic assumptions about the future and how much cash flow is likely to be produced.
Credit and debt problems tend to become more apparent 6-9 months before the economy peaks. They are most concentrated in the most vulnerable and frothy parts of the economy.
The most overleveraged borrowers will begin to miss payments and lenders worry if the uptick is part of a trend. Credit spreads will begin to go higher and credit standards tighten to avoid risky lending.
Capital shifts from risk assets to assets with less risk, such as traders liquidating stocks and putting the money into safer assets like government debt and high-quality corporate debt.
It could also mean shifting it into different countries if its perceived to be likely to cyclically underperform, especially if it’s an emerging market that lacks a reserve currency.
This contributes to the contraction, as lower stock prices lead to less capital availability.
The yield curve
Generally, when a market starts to top the yield curve flattens or inverts.
This is when the rise in short-term interest rates comes up to approximately the same level as longer term rates.
The flattening of the yield curve reduces the spread of interest earned between lending long and lending short term. Sometimes this spread turns negative (e.g., 3-month rates higher than 10-year rates, or 2-year rates higher than 10-years).
With a higher yield on the shorter term rate than the long rate, this means there is more yield for less price risk.
In turn, this reduces the incentive to lend relative to the incentive to hold cash.
When the yield curve flattens or inverts, the movement of capital from longer term bonds to cash slows credit growth, which also works to depress growth in the real economy.
Early on in the market top
Typically, in the early stages before the market tops, some portions of the lending landscape suffer.
But it’s generally perceived to be localized while others remain strong.
And sometimes it remains contained, such as the drop in oil prices and its effect on the energy sector in late-2015 and early-2016. Many oil and gas companies became distressed and energy is essential to an economy, but the economy didn’t enter into a recession in most of the developed world.
Also, in the early goings, emerging credit problems tend to be lost beneath the averages. So, it’s not clear that the economy is weakening.
This is all going on while the central bank is tightening credit, usually by raising short-term interest rates. A further tightening of credit can cause a contraction in credit creation that can sow a recession.
Sometimes a recession, with a drop in asset prices and a drop in real economic activity, is considered a necessary evil in order to combat excessive inflationary pressures.
In other cases, the recession is a policy mistake. As the cycle goes on and the trade-off between growth and inflation becomes more acute, the harder it become to get right.
This is also especially true if capital is leaving the country.
Capital flows coming into a country allow it to increase its foreign exchange reserves, lower interest rates, and/or appreciate its domestic currency, depending on how the central bank wants to use the advantage of positive capital flows.
When capital is moving out, the central bank’s job is more difficult. Less growth is achieved per each unit of inflation. The flows cause the currency to depreciate, FX reserve to decline, and/or interest rates to rise.
Tightening typically goes at its fastest pace 0-6 months before the top in the stock market.
The general dynamics of inflation
Central banks usually tighten monetary policy to rein in inflation.
The inflation dynamic is fairly straightforward. In any economy, there’s a certain amount of demand and a certain amount of supply that can accommodate that demand.
When an economy is operating a high rate, demand pushes up against the capacity to produce the supply needed to accommodate that demand.
Some think that inflation is caused because companies have leverage with respect to pricing power as it pertains to labor and/or goods and services.
That can be part of it, but the main determinant with respect to inflation in anything (e.g., financial assets, prices of goods and services in the real economy) is demand of something running in excess of its supply.
It’s like a car going at 70 miles per hour behind a truck in the same lane going 50 miles per hour. At their speed trajectories, at a certain point the car is going to have to hit the brakes. If the truck slows, then the car is going to have to tap the brakes sooner.
Real economy inflation vs. financial economy inflation
Likewise in an economy, policymakers don’t want intolerable price pressures. Central bankers tend to think of inflation mostly in terms of the real economy (i.e., the supply and demand for “stuff”) and less so in terms of inflation in the financial economy (i.e., the supply and demand for money and credit).
But inflation in the financial economy can actually be more dangerous than inflation in goods and services. This is because financial asset inflation seems like a good thing and isn’t prevented.
In reality, bubbles in asset prices are no different than any other form of indebtedness.
For those assets to live up to their value, economic earnings need to be produced that are commensurate with their prices to validate those valuations. Otherwise speculating on wildly overvalued assets is just like playing a “greater fool” game.
Investment booms financed by debt that go along with low levels of inflation typically occur before busts.
This was true in most of the world during the 1920s, Japan in the late 1980s, and in much of the developed world in the mid 2000s.
Cyclical inflation in the real economy is easier to deal with by raising rates or pulling back on other liquidity programs.
When demand is pressing up against supply and production capacity, unemployment is usually at cyclical lows. Inflation tends to be on an upward trajectory.
When the central bank raises short-term interest rates to make cash more attractive, this tends to cause an appreciation in its currency relative to gold and relative to other major exchange rates (unless they’re engaging in monetary tightening in conjunction).
Market participants shift their capital into the places that will give them the most return per unit of risk. If USD cash provides a better rate than EUR cash, for example, assets will flow into USD assets and away from EUR and boost the relative exchange rate in favor of the dollar.
A rise in short-term interest rates is also used to discount the future cash flows of assets to determine their prices. This creates weaker risk asset prices and slower lending.
In the real economy, goods and services bought on credit become more expensive. More cash flow gets shifted into debt servicing payments and away from investment and consumption, which slows demand.
Short-term interest rates typically peak a few months before the stock market tops, though like everything it depends on the nature of the bust.
In the lead up to the 2008 financial crisis, the Federal Reserve began cutting interest rates in July 2007 with the stock market in the US topping in October 2007. (The real estate sector, which was most problematic, topped in February 2007.)
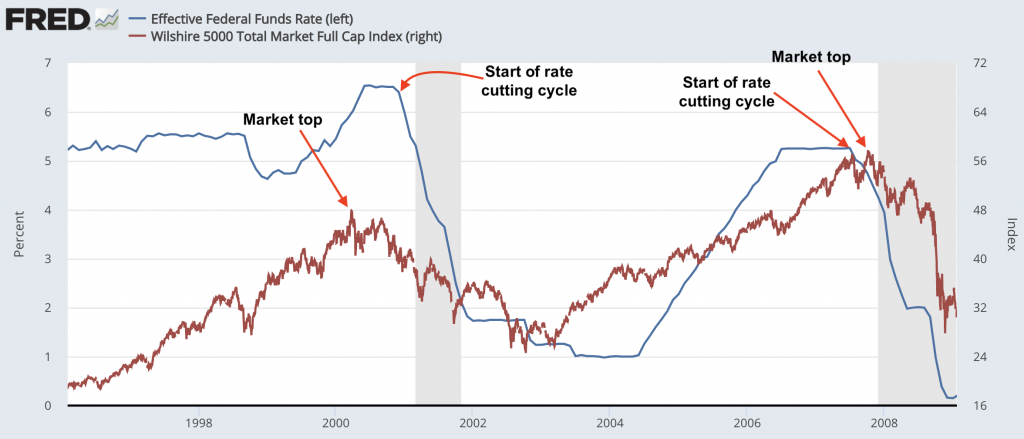
(Sources: Federal Reserve Board of Governors, Wilshire)
On the other hand, during the dot-com bust of 2000, the market topped in March 2000. However, the Fed continued to hike interest rates past the top in the market. It didn’t start cutting until later in the year.
The higher the prices and the more leverage that exists within the economy (debt relative to income and especially debt servicing relative to income) the easier it become to create a top in the market.
Additionally, the higher the prices and the higher the leverage, the more violent the reversal in the market tends to be.
Less important is the extent to which money and credit tightens and more about what each specific sector’s sensitivity to tightening is. Namely:
a) What are the big important sectors of the economy, and
b) Who are the big important players in each sector?
This will give a better feel for what a downturn will probably be like as opposed to just going by averages at the broad economy level.
After the popping of the bubble
After the bubble pops, the negative wealth effect from the asset price movement has a larger impact on economic growth rates than monetary policy.
While most focus on monetary policy factors, the effect of asset price compression is sizable in the initial jolt downwards.
The market cap of US equities to US nominal GDP is, for example, over 150 percent. It is much higher than the levels seen during the dot-com bubble and financial crisis.
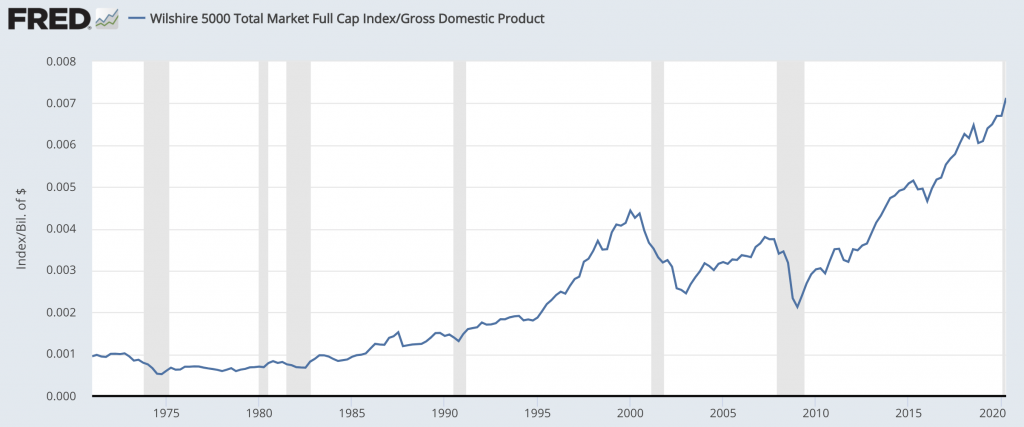
(Sources: U.S. Bureau of Economic Analysis, Wilshire Associates)
This means historically a reversal in asset prices has a bigger impact on economic growth than it usually does. This makes asset prices more important to an economy. Central bank policies to rectify the 2008 in particular have led to these types of overvaluations in the first place.
Early on after a bubble bursts, stock prices drop but earnings have not yet fallen in conjunction. So, people tend to mistake the drop as a time to “buy at a discount”.
Stocks may seem cheap relative to past earnings (as earnings tend to rise over time) and expected earnings (because their prices have become cheaper, compressing their P/E multiples).
However, this doesn’t take into consideration that prices fell because they are discounting what’s to come. Earnings are likely to decline.
If the level of earnings compression is under-discounted, then stocks will actually be more expensive relative to where they were when their prices were higher.
And this drop becomes self-propagating because it sets off a spiral. Wealth falls first. Incomes fall later.
Creditworthiness gets worse. This constricts lending activity. As lending falls, spending drops.
Capital investment rates also fall. This, in turn, makes it less attractive to use leverage to buy financial assets.
The fundamentals of an asset get worse as lower economic activity causes lower spending and sales. So, corporate earnings underperform and are likely to persistently disappoint for some time.
This causes people to sell assets and prices drop more. Some individuals and companies run into cash flow issues. So, they need to sell assets at cheap prices just to raise cash to pay their bills and often to just stay afloat.
Investment managers who are involved in the buying and selling of financial assets also face the same issues.
Some who sold put options (i.e., effectively underwriting insurance) on events they assumed couldn’t happen face losses and higher collateral requirements.
Some will try to dynamically hedge by borrowing the asset to short sell to cover their derivatives-related liabilities. This compounds the sell-off.
All of these factors have an influence on accelerating the impact on asset prices, wealth, and incomes.
Why extrapolating the past is dangerous
As mentioned earlier in the article, markets are susceptible to reversals when buoyant expectations are discounted into prices that are unlikely to pan out, or don’t take much to trigger a disappointment (e.g., highly leveraged markets).
When traders make tactical bets in the markets, the reality is that most are going to lose, not just smaller investors but institutional investors as well.
Whenever you make a trade, there’s somebody on the other side of it and there’s a reason why they’re making it. It’s difficult to add value in the markets, especially when the index many traders benchmark themselves to doesn’t have trading costs like they do (e.g., commissions, price spread) and doesn’t have its gains taxed.
Then there’s the reality of playing the markets. Assets look like better investments when they go up and worse investments when they go down. Though the perception should actually be the opposite. (Rising assets are generally more expensive assets and falling assets are generally less expensive assets, though not always.)
There’s the example of the Peter Lynch Fidelity Magellan Fund, which was the most successful mutual fund of all time, earning 29.2 percent annualized returns from 1977 to 1990.
Yet the average person who invested managed to lose money.
Why?
When the environment was favorable toward good investment returns and the results were great, people got excited about buying in and inflows went up.
Yet when it had spells where it did poorly people got scared and sold out of it.
This behavior led to buying toward the tops and selling at the bottoms. And when people need to liquidate assets to meet their payments it’s usually when things are bad.
When things do well, people look at the past and assume it’ll continue to be that way going forward. When things go poorly, people assume that it’s a bad fund or a bad investment.
Generally when markets go down it shouldn’t be thought of in terms of “this is a bad market to be in” but rather “this is a cheaper market”.
Tops are typically made in markets when the rate of buying is not sustainable (which is also when people think prices will rise).
Likewise, bottoms are made when the rate of selling is at a pace that’s not sustainable (and typically when most people are bearish).
How to know when it’s a good time to buy and sell
If you do choose to make tactical decisions in the market, below is a general guide of buying and selling as it pertains to most risk assets like stocks.
Buying
The time to buy is generally when:
(i) The Federal Reserve (and other developed market central banks) have eased monetary policy, letting more money and credit flow into the economy.
(ii) Unemployment is high and there’s a lot of slack in the labor market. When many workers are on the sidelines the economy will run at below potential growth. However, asset markets will have already typically bottomed before the unemployment rate tops.
Labor is a lagging indicator, as credit problems emerge before the labor force is cut back.
Notice how unemployments tends to top after the recession is over.
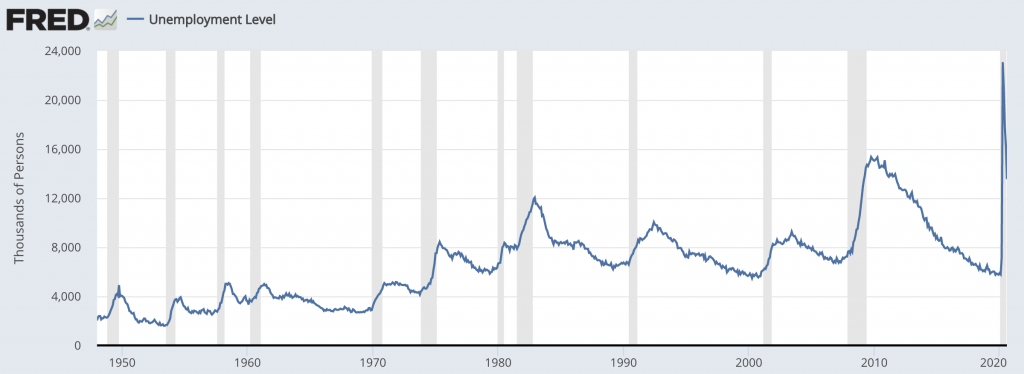
(Source: U.S. Bureau of Labor Statistics)
(iii) Bearish sentiment is running at or near cycle and/or all-time highs
How do you find out how sentiment is trending?
a) You can look at the speculative positioning in various markets.
Some websites (e.g., investing.com) provide CFTC and other data to see the net long/short exposure in various markets.
Net long exposure suggest traders are bullish (and net short exposure showing general bearishness).
b) There are also various surveys published to gauge sentiment.
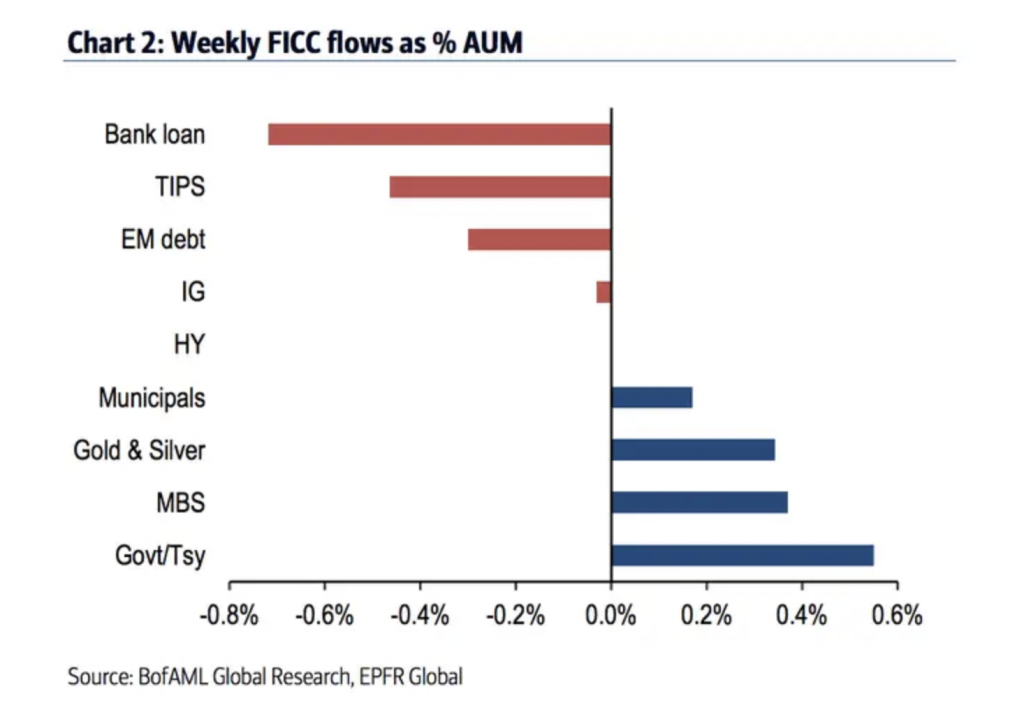
Bank of America Merrill Lynch provides the a comprehensive set of sentiment reading to its clients.
These include:
– FICC flows as a percent of AUM
Example
– Percent equity allocation (higher means more bullish)
– Percent cash allocation (higher mean more bearish)
– The beta of clients’ top 10 stocks (higher is more bullish, and vice versa).
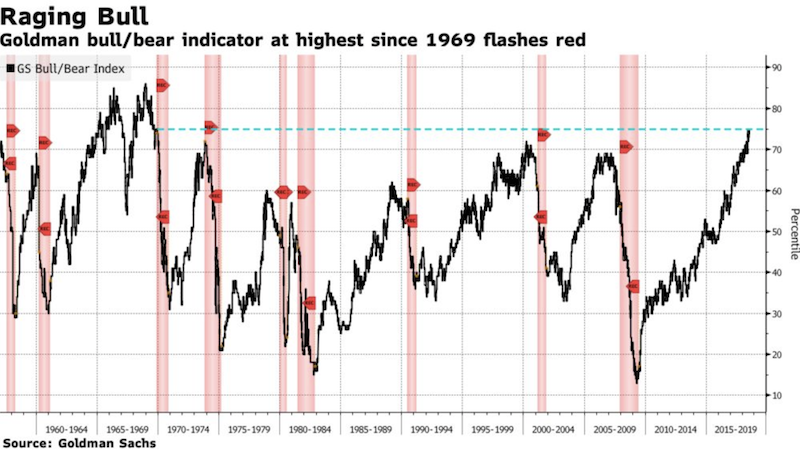
Goldman Sachs also provides a popular bull and bear market risk indicator.
Example
Sentiment should inherently be treated as a type of contrarian indicator.
If traders are heavily invested in stocks (and have low amounts of their portfolios put into cash) that means they have less “dry powder” to invest in them further.
Classically, markets will top when there are no additional buyers at the margin.
Central banks traditionally get more liquidity into the financial system by lowering interest rates (which helps credit creation and lending) and through the purchases of financial assets.
If the central bank creates money and buys financial assets with it, that gives the owner of that asset cash that can then be used to buy other assets. That can mean stocks, but is generally something similar to what they previously owned.
(iv) You can look at credit spreads, or the difference between corporate bond yields and comparable government bond yields.
The best time to buy is when credit spreads have blown out to high levels. You can find this data on the St. Louis Federal Reserve site for US-based data. There are various different types of credit spreads.
BBB is one of the most commonly cited credit spreads (i.e., investment grade but directly above “junk” grade, which is BB).
See 2008 for a massive buying opportunity, with mild buying opportunities in 2011 (US recession fears), and 2016 (oil plunge).
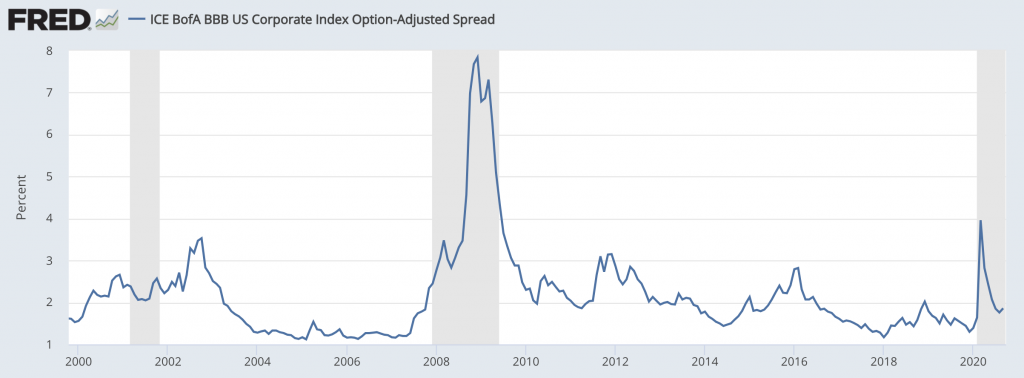
(Source: Ice Data Indices, LLC)
(v) The earnings yield discounted into stocks will start to getting to a level that makes the yield worth the risk.
Using the inverse of the forward P/E ratio and converting that to a percentage is a common easy way to find forward earnings expectations.
For example, if the forward one-year P/E is 20x, the inverse of that – 1/20 – is 5 percent, suggesting a 5 percent forward yield on stocks.
Another way to put it is that it would take 20 years of dividends, distributions, and capital gains to match your principal.
Selling
The time to sell, while not necessarily meaning “all at once” but rather potentially shifting down the risk asset allocation in a portfolio, is when you observe the following:
(i) The Federal Reserve and other developed market central banks are tightening monetary policy. This removes liquidity from the system, cutting down on credit creation.
(ii) Unemployment is low and there’s little spare capacity in the economy. This means that the economy is operating right at around capacity and growth isn’t likely to get much better.
(iii) Bullish sentiment is running at cyclical and/or all-time highs.
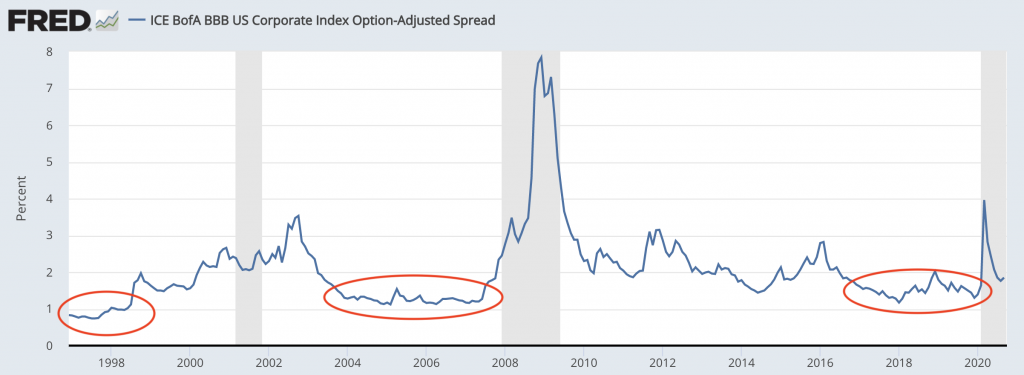
(iv) Credit spreads are very tight.
For example, the 1997 to mid-1998 period was especially tight, with BBB not providing even 100bps in extra yield over government bonds most of the time. The same was true for the 2004 to 2007 period. You also saw this for three full years 2017 to 2019.
(v) The earnings yield priced into stocks starts becoming less attractive.
This is largely up to one’s discretion. Some might find a 5 percent yield on stocks attractive while others won’t.
Some will find the yield mediocre in absolute terms but good in relative terms if cash and bonds provide very low yields.
For much of the post-financial crisis period, because of zero/negative or very low interest rates, stocks were bid up. They became unattractive in absolute terms. But relative to cash and bonds they still maintained reasonable risk premiums.
Since 1972, US stocks have returned an extra 3.2 percent per year over 10-year bonds and a bit less than 6 percent over cash.
| Name | CAGR | Stdev | Best Year | Worst Year | Max. Drawdown | Sharpe Ratio | ||
|---|---|---|---|---|---|---|---|---|
| US Stock Market | 10.49% | 15.60% | 37.82% | -37.04% | -50.89% | 0.42 | ||
| 10-year Treasury | 7.22% | 8.04% | 39.57% | -10.17% | -15.76% | 0.34 | ||
| Cash | 4.70% | 1.01% | 15.29% | 0.03% | 0.00% | N/A |
Borrowing at zero percent to buy stocks at 6 percent yields is no different than borrowing at 4 percent to get 10 percent yields.
When this spread contracts then the risk relative to the reward becomes less appealing. Yet in more placid market environments, yield becomes the more important factor over volatility.
So, risk premiums compress and traders feel more comfortable leveraging up their allocations to get the desired return on equity.
Leverage builds in the system and this tends to sow the seeds of its own demise.
This is why as prices go up and yields go down, it can be prudent to trim allocations to risk assets even though psychologically it feels better doing the opposite.