What’s the Difference Between a Recession and a Depression?


What’s the difference between a recession and a depression? Most think of a depression as simply a really bad recession, but they are two distinct but naturally occurring events.
The ineffectiveness of monetary policy is causing financial assets to fall faster than they did during the Great Depression, 1987 (stocks fell hard and fast in one particular day, but recovered afterward), and the 2008 financial crisis.
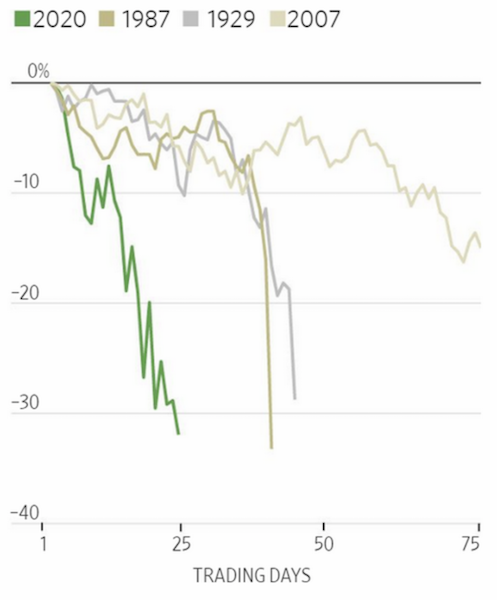
(Source: Wall Street Journal)
Investors are pulling back from corporate bonds at the fastest pace ever. An index or raw materials is hitting all-time lows. Funding shortages have produced a dollar squeeze, pushing the US currency to around an 18-year high.
What’s the Difference Between a Recession and a Depression?
Recession
A recession is a drop in economic activity that’s typically caused by a fall in private sector credit creation. It is officially defined as two consecutive quarters of negative GDP growth.
The buildup to a recession
Later on in the business cycle, the economy reaches a point where spare workers are close to all being pulled off the sidelines.
At a point, the demand for labor exceeds the supply. Labor can bargain for higher wages. Corporations try to pass this off in the form of increases in prices on goods and services. So, you get inflation.
This gives the central bank the incentive to begin raising interest rates. The trade-off between growth and inflation becomes more acute and it becomes harder to get the balance right between the two. Sometimes the need to rein in price pressures exceeds the adverse impact on output.
That results in a recession, which ends when the central bank eases policy. Markets normally bottom when nominal interest rates are pushed below nominal growth rates, and the economy bottoms sometime after.
That’s the normal dynamic that we’re traditionally used to. Business cycles normally run from 5-10 years (a bit shorter or longer depending on the exact way things transpire) so we normally experience many of them over the course of our lifetimes.
Depression
A depression is a drop in economic activity combined with an unsustainably high debt burden and monetary policy that is no longer effective.
For purposes of this article we will call it a “depression”. But less important is the exact term applied relative to understanding the differences between the two dynamics and how they work. “Depression” is a term that is commonly overused and/or misapplied for sensationalistic purposes.
We’re in one such environment right now (March 2020, as this is being written) where debt is unsustainably high relative to income and the adjustment to short-term interest rates is no longer effective is easing the burden.
This was also true (in the US) in 1929 and 2008 in most parts of the world. Namely, interest rates are at zero and the central bank has no way to stimulate the economy.
To get around this, the central bank has a few options:
(i) They can let the debt go through widespread write-downs. This risks more economic pain because the debtholders who believe they hold an “asset” don’t really have an asset at all or simply one that’s worth a lot less than they initially believed.
A bond is simply a promise to deliver money over time. Broadly that’s what any financial asset is. It’s a securitization of a particular type of cash flow (corporate cash flow, among other potential forms).
When there are write-downs, the assets become worth less, so the entities owning them becoming less creditworthy, lenders pull back, and this exacerbates the process.
Debt write-downs, restructurings, and accompanying austerity measures inevitably happen on some scale. But at a point, the economic pain it inflicts is too much if policymakers don’t provide forms of credit guarantees and bridge loans to backstop the situation.
(ii) The central bank must “print” money and buy debt and longer-duration assets in various forms to put liquidity back into the economy. We saw this during the Great Depression and during the 2008-09 financial crisis. We’re seeing it now.
This is inherently inflationary, but when the deflationary forces of the debt restructuring and write-offs are balanced against the inflationary impact of the money printing – and is done on a sufficient enough scale – then it’s a positive thing that gets a floor under the markets and economy to begin the next expansion.
(iii) A combination of both restructuring, debt write-offs, and money printing.
(iv) Another option is wealth transfer payments from wealthier entities to those who “need it more”. This could, for example, mean the way spending and taxation is determined among a population. It could also mean wealthier countries supporting poorer countries. But wealth transfers rarely amount to anything meaningful.
The precursor to depressions
The business cycles that we’re accustomed to add up to one larger cycle that hits its constraints once interest rates hit zero or a bit below zero. When this lower bound is hit, debts can no longer rise relative to output and monetary policy is no longer effective at producing credit growth.
The chart below shows each of these situations. In the early 1930s with the Great Depression, we had rates at zero, as well as in 2008 and 2020.
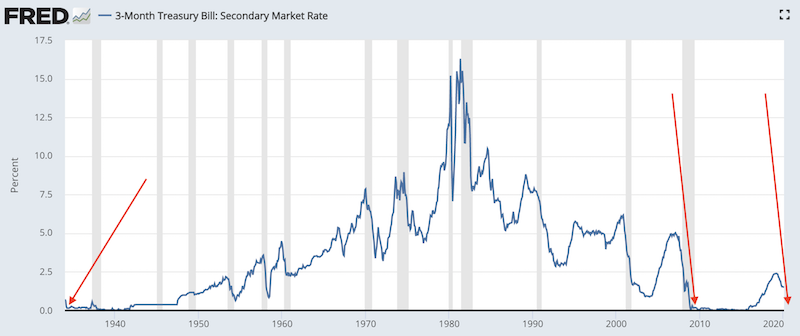
(Source: Board of Governors of the Federal Reserve System (US))
Leading up to this “crash landing” the upswings in the cycle are caused through the process of money growth producing higher debt growth. This debt growth finances spending and investment, including asset purchases.
This process is self-reinforcing because assets become worth more and people and entities become more creditworthy.
Lenders determine how much they can lend on the basis of prospective borrowers’:
(i) income, earnings, and cash flow available to service the debt
(ii) collateral and other assets, as well as their own ability to lend
If a business earns $1 million per year, can borrow $100,000, that supports its ability to spend up to $1.1 million per year. This increased spending leads to higher earnings. This supports higher stock and asset values. People’s incomes and net worths increase, which gives them higher collateral to borrow against, and so forth.
This process begins to quickly resemble a cycle.
The process of the expansionary phase of the cycle is where the promises to deliver money in the future (i.e., indebtedness) rise relative to:
(i) the amount of money and credit debtors have flowing in through the incomes, borrowings, and sale of assets, and
(ii) the supply of money in the economy
This kind of cycle can go on for many decades with the chief variations occurring due to central banks easing and tightening the flow of money and credit into the economy – which make up the standard business cycles that we’re all aware of and are shorter-term in nature.
But debt can’t rise faster than income (and other borrowing and asset sales) indefinitely.
At a point, the debt service payments become equal to or higher than the amount than is viable based on the money (i.e., income and asset sales) and credit (i.e., new borrowing) coming in. So, spending must decline. Then, as happened in 1929, 2008, and March 2020, the process works in reverse.
What is most important is not the level of debt, but cash flow.
Declines or disruptions in cash flow (e.g., virus-related quarantine measures) or cash insufficiencies relative to the debt payments (principal and interest) coming due is what causes the squeeze to occur, not simply “high debt” itself.
For instance, if interest rates decline by enough, debts can increase without the debt servicing becoming enough of a problem to create a squeeze.
It is most dangerous when these debt problems occur in the household sector, which is the most important part of the economy. Consumption is what drives around 70 percent of growth in the US and other developed market economies.
Such debt problems can also occur in the government sector. But the government has tools that individuals and corporations do not, such as creating the currency to monetize their obligations. They have the power to deal with their debt problems assuming the debts are denominated in their own currency. When they are denominated in their own currency, the debts can be managed in all the usual ways, such as changing the interest rates, maturities, and whose balance sheet it lives in (e.g., having the central bank monetize it).
Simply observing that debt is rising faster than output or looking at a rising debt to GDP part is not sufficient evidence that a trigger is coming.
What causes the reverse process to occur?
This debt cycles tops when monetary policy can no longer push credit into the system because interest rates are already at or near zero and/or because debt burdens are already high. All of these begin to run in reverse when there’s a lack of money relative to borrowers’ needs for it.
Once it reaches this point, debt cannot rise relative to output, money supply, and net worth. To rectify the imbalance, this ratio needs to come down.
This leads to many types of households, businesses, and financial institutions pulling back on their spending, defaulting on their debts, cutting back on labor needs (leading to higher unemployment), and other economic issues.
How did these debt problems emerge in the first place?
They can occur in a number of different ways, but often they occur because investment assets were bought at high prices and through the use of leverage. In other words, the mistake of excessively optimistic assumptions about future cash flows are compounded by high debt levels.
When either the trigger happens (sharp squeeze) or these problems emerge over time (gradual squeeze), actual cash flows end up falling short of what’s necessary for borrowers to service their debts.
Sometimes, cash flows begin to fall short because of monetary policies that are tight in order to restrain pockets of vulnerability. This was true in the lead up to 1929 bursting of the consumer debt bubble, in 1989-91 in Japan, and in the 2005-07 period in the US and much of the developed world.
Financial asset inflation versus goods and services inflation
Inflation in financial assets, paradoxically, is actually worse than the inflation experienced in the real economy.
When financial assets increase in price through debt-financed purchases, this seems like a positive thing. Ostensibly the rise it’s generated by an investment or productivity generated boom.
But it’s like any other form of unhealthy indebtedness. Asset market booms that are accompanied by low inflation are the type of environments that sow the seeds for busts down the road.
When inflation is low and below target, this means central banks are unlikely to raise interest rates to put on the brakes. This tends to cause asset prices to go up. Debt is cheap and because assets go up their forward returns go down. This causes people to leverage up to obtain their desired return on equity.
The low interest rates since 2008 have fueled a binge in corporate borrowing. The interest rate on debt for companies as a whole has been low relative to the return on equity. That boosted the incentive to engage in share buybacks, further pushing up the prices of equities.
But all this extra leverage in the system made companies more susceptible to exacerbated shocks in their share prices when the next downturn came in March 2020. In the capital structure of a company, debtholders are senior to shareholders. This means in the event of a hypothetical liquidation bankruptcy, shareholders get paid last. A lot of debt means a lot of stakeholders (secured debtholders, unsecured debtholders, preferred stock shareholders, etc.) in front of shareholders, adding more risk for those at the bottom of the capital stack.
When companies run into a period where revenue declines, particularly when its unexpected and unplanned for, debt is coming due and rolling it over is difficult because lenders have pulled back and grown more cautious (both on the company in question and out of broader systematic necessity), they have an issue.
This extra leverage has fueled a decline in the stock market that has been among the steepest ever.
In normal times, having corporate debt as ~47 percent of GDP might not be a bad thing if the rates on it are sufficiently low and the maturities are spread out or it can be refinanced easily such that it’s not a problem.
But when things head south and there’s a drop in revenue, all of that debt can become a huge problem.
Offsetting the problem
As in 1929, 2008, and 2020, central banks reacted to the market and economic conditions by easing monetary policy. Interest rates went to zero. But once you hit zero, you’re virtually out of room.
You can go negative to try to make cash a little bit cheaper, but the marginal benefit in negative interest rates in making lenders willing to lend again and getting investors into the type of assets that will help finance spending is low.
As a result, central banks have limited ability to alleviate these debt burdens by producing private sector credit creation. Moreover, when interest rates hit zero, the ability to lift asset prices by lowering interest rates through the present value effect is gone. The result is a steep market decline.
Owners of financial assets are skeptical that the value of the money they receive from owning the assets will be more than the value of money they pay for it. Unlike in normal recessions where interest rates can be lowered to get asset prices to bottom, in these cases they no longer can be.
When the reversal begins, instead of indebtedness increasing as it had been – debt and debt service requirements rising relative to income and new borrowing – it begins to fall.
What are the solutions?
The way the problem – reducing debt to income ratios – can be rectified comes in four main ways, as addressed earlier:
(i) Reduction of the debt (write-offs and restructurings)
(ii) Less spending, also known as austerity
(iii) Debt monetization, also known as the “printing” or creation of money
(iv) Wealth transfer payments
Debt reduction and lower spending are both deflationary and bad for asset prices. Usually cash or short-term government debt becomes the best performing asset class in this environment. At the beginning, when interest rates are lowered, longer-duration government debt may perform well. But when people need to sell assets to meet payments and other obligations, cash is often a better and safer asset to hold, assuming you’re in a deflationary environment. (Emerging market countries, because they often borrow in foreign currencies, often have depressions that are inflationary in nature).
Debt monetization is inflationary and stimulative to the economy.
Wealth transfer payments, or moving money from the more well-off to less well-off, rarely occur at a high enough scale to rectify the imbalance.
The Phases
The most contractionary part starts at the beginning of the reversal process.
This is the part where defaults and austerity kick in most heavily.
Central bankers and/or fiscal policymakers may recognize what’s occurring and react by lowering rates and printing money, but it may be insufficient.
Great Depression example
During the Great Depression, policymakers didn’t get a floor under the markets until July 1932 despite the cracks first coming out in October 1929.
President Franklin Roosevelt had a litany of various government programs that directly employed a lot of people and created fiscal incentives to stimulate credit and spending. But it took a long time to work off the debt overhang.
Nominal rates needed to be pushed below nominal growth to get the deleveraging. But since the recovery came starting from a high debt base – unless the debts are wiped out on a great enough level, which would create a lot of economic pain – that means sluggish growth became the norm and the economy is sensitive to downward shocks. It was the same dynamic following 2008.
The debt crisis that emerged in 1929 was different from the other “panics” that policymakers had encountered in their lifetimes (e.g., 1907, 1920) so they were late to react.
Interest rates went to zero, but that wasn’t enough so eventually they bought longer duration assets starting in July 1932.
In 1933, there was the dollar devaluation against gold and breaking the “gold clause” from debt contracts. That helped debtors relative to creditors by making liabilities cheaper and easier to service.
In 1937, they tried to tighten monetary very slightly, but debt was still too high relative to output and there were other factors – e.g., WPA employment program was reduced, veterans’ bonuses were fading, currency devaluations in Europe caused the dollar to rise. Stocks fell back by more than 50 percent.
From 1938-40, there was monetary and fiscal easing – e.g., gold sterilization to prevent dollar appreciation, increase in WPA employment, a $2 billion fiscal bill – but didn’t result in much of a boost since rates were already very low.
The real pickup in activity started coming in 1940-41 from supplying the Allies and preparing for potential war entry. Then there was the official entry that kept war production flying.
The Fed monetized government spending from 1942-47 through a cap on long-term Treasury bonds at rates of 2.5 percent and short-term rates at 0.375 percent. The Fed stepped in to buy the bonds whenever rates approached those levels.
Falling asset prices accompany the first phase
In the initial phase of the depression, the money coming in to borrowers via income and net borrowing is not enough to meet their obligations. This leads to reduced spending and asset sales.
The asset sales lead to falling prices. This reduces the value of collateral and reduces incomes.
The dual effect of lower collateral values and lower incomes reduces creditworthiness. This means less credit gets extended to them. This goes on in a self-reinforcing way.
Because we know that the creditworthiness of debtors’ is a function of:
(i) the value of their assets relative to their liabilities (net worths), and
(ii) the size of their earnings/incomes relative to the size of their debt servicing, and incomes and net worths fall decline faster than debts,
…lenders will pull back as borrowers become less creditworthy.
When debt cannot be serviced it hurts both debtors and creditors:
a) Debtors no longer use the debt to make investments that generate them more income. Namely, “good” debt turns into “bad” debt.
b) Creditors lose because the asset they formerly believed they had is no longer an asset (or one of reduced value) if the borrower can no longer pay.
When both parties lose you get less of those transactions because they’re profitable for neither side. The contraction then continues on in a self-reinforcing way. This also causes debt to income and debt to net worth ratios to rise because the denominators (i.e., income and net worth) are declining.
Moreover, as incomes drop, spending is reduced. This reduced spending capacity also causes the contraction to keep going. One person’s spending is another person’s income. When people cut back on their spending, this pulls down other people’s incomes.
Repairing lending and borrowing relationships
Most of what people think of as money is actually credit. We live in an economy where most spending is done with credit (an IOU) and not money (what you settle your payments with).
When you walk into a store and buy something with your credit card, you paid that with credit rather than money because the transaction hasn’t been settled yet.
Where did that credit come from?
You created it out of thin air. The transaction created a credit asset and a credit liability.
Credit is a “short money” position. It eventually needs to be covered. Once you pay your credit card bill with money, the transaction is settled.
If the owner of the store you made the purchase from has right to believe that you and others will not pay the credit card company and the credit card company will not pay him if that happens, then what he believes is an “asset” is really not an asset at all.
A painful part of the depression process is people discovering that a lot of the wealth they believed to be theirs (e.g., stocks, bonds, lending commitments) is not actually there.
When there’s a dash to liquidate investments to meet payments and other obligations, this tests the liquidity of their investments.
How readily can they convert investments into cash?
When investments are illiquid, this creates sell-offs and “runs” on securities. Banks are particularly susceptible to runs, though it’s applicable to entities that rely on short-term funding. When they have trouble raising money and credit to meet their needs, they often fail.
Then it’s a matter of the government identifying the problem and choosing who to save by providing them with credit guarantees and/or money. Do they get this money through the central government via the budget or do they get it from the central bank through their ability to “print” money?
How well these contractions are handled and whether they are deflationary or inflationary depend on the extent to which central banks print money to offset the impact of contracting credit.
In recessions, cutting interest rates is effective in helping resolve this imbalance because the central bank can lower interest rates to push credit into the system. It also eases existing debt service burdens. Lower interest rates allow for refinancings and/or automatically lower interest rates on pre-existing variable rate loans. Lower interest rates also help create wealth by boosting asset prices through the present value effect.
In depressions, this process is no longer effective in creating credit. Interest rates are at zero and can’t be lowered further with much influence on stimulating credit creation. Moreover, producing credit growth is hard to do because borrowers remain highly indebted. This makes prudent lending difficult to do.
When depressions are inflationary in nature – as they often are in non-reserve currency countries who typically borrow a lot in foreign currencies – monetary policy is not effective in producing credit growth because money growth flows into inflation-hedge assets or other currencies. This is because investors believe that their lending will be paid back in money that’s of depreciated value.
To relieve the imbalance, governments try to repair the lender/borrower relationship by:
(i) ease up on the rules by which borrowers are forced to come up with the money to pay their debts,
(ii) create incentives for lenders to create credit, and
(iii) print money and create incentives for economic actors to buy goods, services, and financial assets with it.
In the government sector, this shows up by central banks printing money and using it to expand their balance sheets, and for central governments in their deficits running higher to backstop the private sector (companies and individuals) and to account for the lost revenue associated with lower economic output.
Depressions for countries with pegged or commodity-based currency systems
Countries with fixed-exchange rate systems (i.e., pegged currencies) or commodity-based monetary systems have limited ability to change their money supply. Those with independent fiat monetary systems – as all the top reserve currency countries do – are not as constrained.
Nonetheless, in each case, regardless of the system, both have great incentives to get more money and credit into the system.
Essential banks are backstopped and the quality of the collateral the central bank accepts is reduced. Some non-bank entities critical to the infrastructure of a country (e.g., military, national security) will be supported as well.
Because of the central bank’s easing of monetary policy and the movement of investment funds down the risk curve from stocks and corporate bonds and into safer investments, this drives down short-term sovereign interest rates. The yield curve steepens and risk and liquidity premiums expand.
Those who do not receive the money and/or credit support required to meet their payments and debt service obligations, which is normally a large set of borrowers, will default and have to cease operations.
When credit availability is not adequate, unemployment rises and many of them, due to inadequate savings, will need financial support. Spending in the economy will fall. As a consequence, governments not only need to provide support to the financial system, governments need money to help businesses and individuals in greatest need.
Because incomes fall, tax revenue also declines. Because of the new exorbitant spending requirements and loss of tax revenues, governments’ budget deficits explode.
This normally means having to issue a lot of bonds to fund these deficits. Depending on the perceived quality of their currency (and their inflation rate, which is more of a problem for countries that borrow in a different currency), getting adequate funding to support these deficits may be a problem. This is true despite short-term government debt appearing more attractive as a source of safety and liquidity during periods of crisis.
Central banks, as the lender of last resort, enter the picture and are forced with the trade-off of creating more money to then buy their governments’ debts or allowing the private and public sector compete for a limited supply of money. If they choose the latter, it creates excessively tight financial conditions. (Financial conditions are broadly the effects of credit spreads, currency changes, equities, volatility, and credit on economic growth.)
Governments with pegged exchange rate systems or those with commodity-based monetary systems will be forced to have tighter monetary policies or have smaller budget deficits (i.e., tighter fiscal policy) than those with fiat monetary system with control over their exchange rates.
Central banks invariably want to print money regardless of whatever system they’re under.
Those on commodity-based systems (i.e., usually gold and less commonly silver) either alter the amount or pricing of the commodity they will exchange for each unit of currency or abandon these systems altogether.
This allows them to create more money. Those under fiat monetary systems will simply print more money.
Central banks use the newly created currency to purchase more government securities, and sometimes other non-government assets, such as corporate credit, equities, and other forms of less liquid assets. This is done to offset the effects of contracting credit.
In the data, the money growth to offset the contracting credit (and real economic activity) is seen as the central bank’s balance sheet getting larger. The Federal Reserve’s balance sheet will be expanding rapidly in response to the money creation that will need to occur as a result of the drops in income and economic output and impact on the country’s credit system from events in 2020.
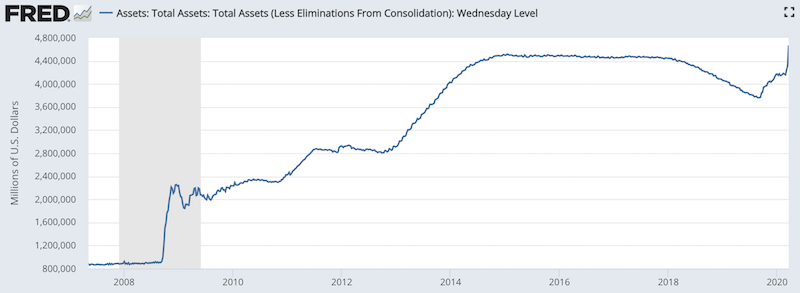
(Source: Board of Governors of the Federal Reserve System (US))
If the amount of money created is large enough to offset the funding demand, then it devalues the currency. It also lowers real (i.e., inflation-adjusted) interest rates and has the effect of driving market players from financial assets to assets that hedge inflation, such as gold. This occurs when investors want to move money outside their domestic currency and short-term sovereign debt is no longer considered a safe investment or its yield has become insufficient.
How depressions influence policymaking
Governments end up having large deficits and need more funding.
Because wealth and incomes are skewed heavily toward a smaller portion of the population, governments prefer to raise taxes on the wealthy. Those who earned their money during the good times – in particular, those who made money creating the debt in the financial sector and often short sellers who some believe profited at the expense of others – are resented.
Social tensions typically rise. Politically, there is often a trend from the right to the left because more government intervention is wanted (and often needed as a backstop).
To raise revenues, government typically raise income taxes on the high earners and/or use consumption taxes.
Inheritance and wealth taxes are sometimes used, but these tend to be ineffective in raising money. Much of wealth is illiquid and can’t be readily sold to convert into cash. Even for bonds, stocks, and other liquid investments, forcing people to sell assets to meet their tax payment obligations undermines a country’s capital stock.
Moreover, even with tax hikes on the wealthy, the increases in tax revenue are limited because incomes are reduced (often heavily) during this period and spending is cut back so consumption tax revenue declines.
On top of that, those who have the most wealth suffer large losses in various ways – namely, through losses in their asset portfolios, from their incomes, and from the additional taxes that take a larger percentage of their income.
The wealthy increasingly want to shift their wealth out of the country to be defensive, avoid taxes in other ways, or seek to move their money into other sources of safety that are not dependent on credit quality (e.g., gold and other types of alternative currencies). Politicians losing these big taxpayers also have interest in finding ways to avoid losing them.
Capital outflows help contribute to currency weakness, and weaker currency policies are also favored by governments. Higher unemployment increases protectionist sentiment, which slows economic activity.
Countries with negative balance of payments situations, also known as debtor countries (i.e., a country that owes more to other countries than others countries owe to it), are normally hurt the most from capital outflows.
Capital flight once again puts central banks in the position of having to choose between allowing governments, corporations, and individuals having to fight for the same limited supply of money or creating more money. Central banks want to print more money to avoid the conflicts over how expenses should be cut and how revenues should be raised.
Policymakers inevitably want to create money, as opposed to other two main choices concerning cutting spending and benefits and focusing on how to squeeze out more tax revenue.
While neither of these three options are good, creating money is the easiest and most acceptable. Money creation is the most discreet way of getting out of the problem and it tends to help asset prices rise, helps offset deflationary pressures, and is stimulative to economic activity.
The debt and other financial obligations denominated in the amount of money owed simply require the debtors to deliver this money. When there are no constraints on the amounts of money that can be created, it’s the most straightforward path.
The biggest risk is that such money creation eventually threatens the viability of the currency as a store of wealth. Money creation is bearish for the currency, holding all else equal.
Debtor countries with current account deficits are most susceptible to capital flight and currency weakness. Foreign investors in particular generally move their money out due to currency weakness and poor returns on their investments. This is less true for reserve currency countries that have debts heavily denominated in their own currencies, such as the United States. US Treasury debt is a reserve asset and helps boost demand for the currency.
Debt is a “short money” position. It is eventually “covered” when paid for with money. The squeeze ends when:
(i) Enough money is printed to alleviate it,
(ii) The debts are defaulted on (which means somebody else’s wealth disappears, so this is painful) and/or
(iii) The debt service requirements are cut back in some other way, such as debt forbearance
The risk at the latter stage of the depression
Toward the latter stages of the process, where policymakers have created enough money to negate the deflationary forces of contracting credit, the next risk is related to currency weakness.
As mentioned, printing money is bearish for a country’s currency, holding all else equal. The risk is that the increased supply of money will make short-term debt – even sovereign short-term debt, which is virtually risk-free – unattractive. It is particularly unattractive to foreign investors who care not about inflation-adjusted return like domestic investors, but rather what their return will be when converted into their own currency.
Currency weakness tends to cause capital flight and the buying of inflation-hedge assets, rather than policymakers’ intended effect of credit creation.
If interest rates are at zero – which they are or close to it when the primary form of monetary policy (adjustment of short-term interest rates) and secondary monetary policy (quantitative easing, or asset buying) are out of room – then if you’re a foreign investor you probably don’t like an asset giving you zero percent return.
If that currency declines, then your asset will provide you with a negative return. Accordingly, owning that debt probably doesn’t seem very attractive to you.
Moreover, for domestic investors, you care about your real (inflation-adjusted) return. If that debt is giving you zero percent and inflation expectations over your holding period are above zero, then your real return is negative.
So that makes other currencies more desirable to hold. If this happens and when it does, investors will want to sell off financial assets – particularly debt/credit assets – in order to raise cash. That cash will typically go into foreign currencies or inflation-hedge assets like gold.
Moreover, at this point, investors also want to borrow in their domestic currency. The central bank is then in a position where they will need to choose between creating more money, or allowing all economic participants to compete for the same pool of money, which would allow credit conditions to tighten and real interest rates to rise.
To curb this, policymakers will often institute capital controls to control the value of the currency, or even outlaw the ownership of gold.
In the United States, under Executive Order 6102, gold ownership was forbidden from 1933 to 1975 with minor exceptions (e.g., some collector coins, jewelry), though some relaxations came into place in 1964.
This order was put into effect due to the continued economic malaise associated with the US’s adherence to the gold standard that acted as a constraint on money creation.
Executive Order 6102 forced gold to be exchanged for paper currency at $20.67 per ounce (about $415 per ounce in today’s money). This allowed more currency to flow into the economy. Nearly one year later, gold was devalued under the Gold Reserve Act to $35 per ounce (about $700 per ounce in today’s money). Raising the $/gold conversion incentivized more people to exchange their gold for paper currency.
Sometimes governments will opt for controls on wages and price-fixing on certain goods. However, these policies rarely solve problems and usually create distortions (e.g., lack of supply relative to demand).
Final Thoughts: Rectifying the imbalance
A depression is a process that occurs when an economy has an unsustainably large debt burden and monetary policy is no longer effective in producing credit growth (as it is in recessions).
This is because interest rates are at or close to zero and the central bank is out of room in the traditional ways of stimulating the economy.
To favorably improve debt to income and net worth to income ratios, the value of the debt must be written down partially or completely (a deflationary force) and/or the central bank must create money (an inflationary force). Policymakers are then forced to get the balance right between the two, offsetting the deflationary debt restructurings with the inflationary money printing.
During this phase, because people need cash to meet their obligations, a large set of assets is for sale and there’s a shortage of buyers. This causes financial assets to become materially cheaper.
For most people in the markets at this time, their losses in wealth are large and rapid. Too many investors have a systematic bias toward positive economic growth. When the trigger comes, most investors are positioned for the economy to get better despite the fact that it gets materially worse.
Toward the end of the process, when the markets bottom, a much smaller number of investors are sanguine about the markets and economy – or have lost so much money that they can’t participate in the markets at the level they used – and don’t benefit as much from the rise back up.
The depression phase produces substantial hardships for workers and businesses. It can even bleed into more explosive conflict within or between countries, but it is how the free market mends itself back into a healthier state.
Debts can’t rise faster incomes – to be more accurate, debt service payments can’t rise faster than incomes – and incomes can’t fall below debt servicing requirements for long. The economy and markets eventually have to get into a better equilibrium to amend the imbalance.
The depression phase normally ends when there is an adequate amount of:
(i) debt restructurings and bankruptcies
(ii) cost-cutting and lower spending
(iii) monetizations of the debt
(iv) wealth transfers and distributions
Financial assets eventually become cheap to the point where lending and investing in equities becomes feasible again. Credit and liquidity premiums rise to make the return favorable relative to the risk. Moreover, nominal interest rates need to be held below nominal growth rates to ensure that economic growth can offset faster than the debt burden.
The fall in economic activity and credit creation normally occurs quickly. However, the recovery is typically slow.
The higher the level of debt monetization to get a bottom in the markets and economy relative to the level of debt restructurings and bankruptcies, the higher the relative debt base when the next expansion resumes. That typically makes the subsequent recovery relatively sluggish. It depends on how badly credit systems were hit and how long it takes for capital formation to become viable again.
Over the ensuing recovery, special care must be taken by central banks to keep nominal interest rates below nominal growth rates to reduce the debt burdens.
If short-term interest rates are zero, then the central bank must create money to buy financial assets to hold down longer-term interest rates. Or else they must create the money and, with or without the help of fiscal policymakers extending lending, credit guarantees, and other payments, distribute the money to raise nominal growth.
This process follows a logical cause-effect sequence of events, much as you’d expect in any process where people pursue their own self-interests and enjoy the rewards and suffer the consequences of those actions.