What Elections Don’t Change


Each election cycle, new policymakers are elected and re-elected. Occasionally, every 4-8 years we have a new President of the United States, who is the head of one-third of the US government.
US elections are important across several dimensions and have impacts on asset prices. The president has the power to shape foreign policy, appoint judges, appoint a cabinet of individuals who will oversee various departments and agencies, and has the power to do some things unilaterally (i.e., executive orders) within the scope of the law.
But there are also checks and balances on the system that constrain this power, through two chambers of Congress (the legislative branch) and the judiciary.
While there is only one president, and therefore it is naturally the most partisan branch of government, it’s rare when one party has a large majority in Congress. Campaigns are run efficiently enough such that these wide disparities in power across party lines are seen infrequently.
For most major legislation to get passed, it has to get by the House of Representatives (the lower chamber), the Senate (upper chamber), and signed into law by the president.
Some can be passed with simple majorities while some needs 60 out of 100 votes in the Senate. That generally requires compromise as it’s not common for there to be 60 politicians in a single party in the Senate.
When these types of super-majorities exist, plus a president ideologically in line with them, they tend not to last (e.g., 2008-2010 before midterm elections washed it out).
As a result, policy is constructed in the same way the judicial system creates case law – iteratively and incrementally.
The main point is, while elections have consequences, sweeping changes are rare.
Moreover, the dominant forces that are now shaping economic and market conditions will continue being the dominant forces, which we’ll cover below.
The Dominant Forces Looking Ahead
We see the following conditions are the primary drivers of future economic and market outcomes.
i) We’re in a world where monetary policy doesn’t work in the traditional ways due to short-term and long-term interest rates being pushed about as low as they can go at zero or just below. This is true in all the developed markets globally (the US, developed Europe, and Japan).
This means fiscal policy – supported in conjunction with monetary policy – will be the primary way for managing the economy. Some may call this “MMT” even though this is historically how these situations have been handled over centuries.
With fiscal policy having to take more of the burden, this means the process will become more political. The central bank, an independent institution (from the fiscal side), will need to grapple with the political process that forms fiscal policy.
The political decision-making process associated with this creates risk and unpredictability.
How will both sides work together to produce necessary policy measures when there are entrenched political differences?
While the number of Congress people in each party is close to equal in both chambers, where they are on that spectrum is wider than normal. This is a natural reflection of the “gaps” we’ve talked about in other articles and how that bleeds into social and political outcomes.
That makes compromise more difficult.
For the trader and investor, you also know that this is likely to create differences across countries in the ability and willingness to take action over time.
ii) We know there’s going to be a lot of liquidity in the years going forward.
Central bankers want to pursue reflationary policies to keep economies going in periods where debt is high relative to income and that process can’t be pushed much further (i.e., interest rates are negative, zero, or near-zero across the government lending curve).
Fiscal policymakers also want liquidity to get into the economy. It makes them look good when the economy and markets are stronger.
Developed markets also don’t have to contend with the acute trade-offs associated with their balance of payments, currency, and inflation as emerging markets do.
And because they are only in power for a certain number of years, elected officials put a lot of attention on what they need to do right now. The increasing indebtedness it causes is an afterthought. The pattern of increased spending and rising indebtedness is generally piled on the next regime or “generation”.
All this money creation leads to bigger piles of cash that lose purchasing power over time.
That means traders and investors have to think less in terms of the traditional ways.
It’s now less about interest rates going up or down and what that means for different asset classes, sectors, and individual securities and their interest rate sensitivity. Instead, it’s more about the level of spending across sectors and economies and what that benefits.
iii) All of this liquidity will continue to seek out places that are quality stores of wealth. This means securities, instruments, and other investments that can protect against the risks of assets that are impacted by lower levels of spending and income, as well as the devaluation of money that’s ongoing.
iv) While these types of conditions of low and zero short- and long-term interest rates are prevalent in the Western world, they are not as prevalent in the East.
We should expect capital to move from West to East over time.
In general we have three main spheres of investing globally:
- Standard reserve currency developed world countries (US, developed Europe, Japan) that are all locked in this low-yield scenario
- China and emerging Asia bloc
- Emerging market cyclicals
The impact of each of these forces
In no particular order, we’ll go through each force and how it’s impacting the economy and markets today and how they’re likely to going forward.
Money printing and ample liquidity
The income losses and credit and cash flow problems have created an ample amount of new money and credit in the system from central bank.
These piles of cash and credit created renewed demand for financial assets, boosting stock prices in particular. Some of it also went into spending and savings.
But creating money also devalues it.
What devaluations are good for at the asset class level
A currency depreciation is good for stocks, gold, and commodities as a whole. These assets are priced according to certain amount of money per share, ounce, bushel, barrel, or some other fixed unit.
As a result, if you depreciate the currency by creating more of it, part of the dynamic is not that the asset is going up. Instead, the value of money is going down.
This causes the price of whatever it is (stocks, gold, commodities) to go up in nominal terms as a type of contra-currency.
This is why in bad inflation or hyperinflation scenarios, people get long commodities and commodity producers as well as some stocks. (Though stocks eventually fail to keep up in a hyperinflation when the currency they’re denominated in is ruined).
A currency depreciation is bad for bonds. And naturally it’s bad for cash, as it loses its value.
A fixed income security is essentially a promise to pay a fixed amount of money back over time. If the money being paid back is in depreciated currency they become less attractive investments.
Policymakers generally also want cash and bonds to be unattractive when they want to get a reflation in activity. They push short-term interest rates down as far as they can go to first make cash and short-term debt unattractive.
When that’s run its course, then they go after longer-term yields through quantitative easing to make longer-duration debt unattractive as well.
When real interest rates go negative, it means if you hold an asset you no longer expect to get more purchasing power from it in the future. Accordingly, cash and bonds become not investments but rather something closer to funding vehicles.
It helps orchestrates incentives away from people saving their money and into spending. Also, it attempts to get people into the types of assets (like equities and real estate) that can help finance spending in the real economy.
This, of course, reaches a point of diminished returns because people still have the need to save money. And lenders still want to be cautious about who they give loans to and what kind of returns they’ll get from lending out that money.
So, after a point, governments must coordinate their monetary and fiscal policies to get effective results.
What this process does is it will usually induce more volatility in real interest rates being that nominal interest rates are effectively controlled by the government (i.e., zero yields on cash and most bonds).
Household cash accumulation
Households have saved a lot of the transfers they’ve received from the government. Many businesses borrowed toward the beginning of the crisis because of the availability of it even if it wasn’t needed.
In the developed world (US, developed Europe, Japan, and we’ll also include Canada and developed Oceania in this cohort), households have increased their cash accumulation by about $5.6 trillion.
But they haven’t used a lot of the funds.
Some of it’s been used in acquiring financial assets of stocks but also bonds that still had positive nominal yields as a source of safety and liquidity.
In late 2019, less than 50 percent of global sovereign bonds (by volume) yielded less than 1 percent.
By late 2020, 80 percent of global sovereign bonds yielded under 1 percent.
Percent of bonds yielding under 1 percent
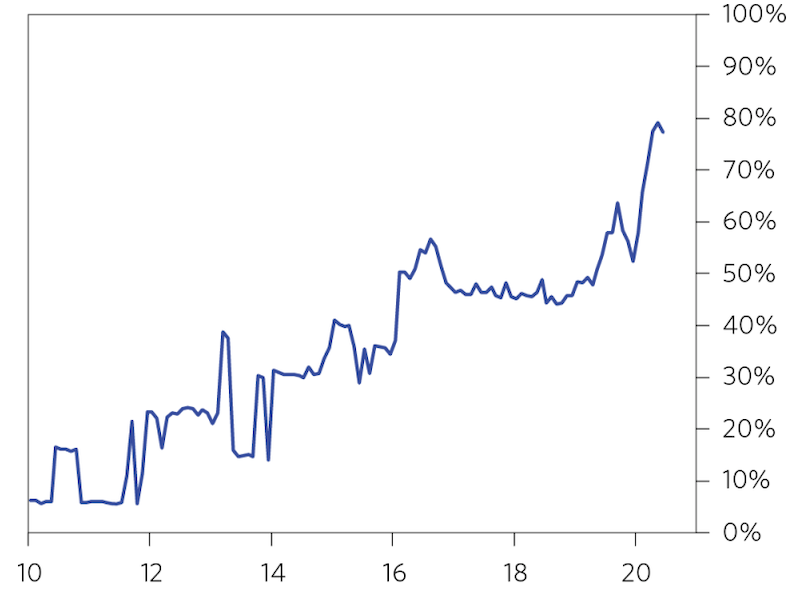
Considering stocks generally have around a 3 percent risk premium over 10-year government bonds, that means the forward returns of equities isn’t high either. Forward returns have compressed across practically all markets.
When cash and bonds don’t yield anything, that can compress stocks even lower relative to their historical norms.
One of the well-known market equilibriums entails that the yield of stocks must be greater than the yield on bonds, which must be greater than the yield on cash, and by the appropriate risk premiums
Ample liquidity also tends to create less volatility in financial markets. When volatility isn’t as big of a concern, yield becomes the more important factor. This leads to buying financial assets on leverage and lowering their returns further.
Monetary policy and fiscal policy coordination
Interest rates are negative, zero, or near-zero on both the short and long ends of the yield curve.
When this occurs, it means both the primary form of monetary policy (lowering and raising of short-term interest rates) and secondary form of monetary policy (purchases of financial assets) are both effectively out of room.
Accordingly, more countries are having to go to a third form of monetary policy where the central bank supports spending initiatives brought on by fiscal policy.
The central bank effectively has to monetize these fiscal deficits.
Monetizing can mean different things. It can mean, for example:
– retiring the debt created by these deficits (i.e., “printing” money and avoiding debt issuance altogether)
– the fiscal side getting a loan directly from the central bank
– the fiscal side issuing debt and the central bank buying it
There are different paths to accomplishing the central need to alleviate the economic pain of the virus against the longer term issues associated with bloated debt to income levels.
Government debt levels have ballooned higher in all of the major markets:
– US: Debt is 180 percent of GDP
– EU: Debt is 125 percent of GDP
– Japan: Debt is 300 percent of GDP
Central bank holdings of government debt
– US: 20 percent of GDP
– EU: 24 percent of GDP
– Japan: 100 percent of GDP
Assets that can serve as stores of wealth will continue to be in demand
All of the liquidity that’s been produced will continue to seek out assets that can be considered stores of wealth.
This will be done to protect against the risks of assets that are most impacted by:
a) the lower levels of income and spending
b) the devaluations of money that come from printing a lot of money
As a result, we see very different outcomes for different types of assets.
Everybody needs the basics no matter where they live – e.g., food, toothpaste, basic medicine, the need to supply their homes with water, heat, electricity.
That makes the case for consumer staples and utilities.
You also see this in the options market.
The implied volatilities for these sectors are much lower than what you see in the riskier cyclical companies (e.g., auto manufacturers, travel and leisure).
Buying the stock of a movie theater chain is not as much of a store of wealth as a company like Proctor & Gamble, which is focused on consumer necessities. Nobody needs to go to a theater to consume entertainment, but everybody needs to consume the basics to physically live.
The “innovators”
Companies involved in creating the important new technologies to drive productivity gains can also be considered stores of wealth.
That makes a case for buying “the innovators”. Which companies are driving the most innovation in society and new productivity gains?
This can be things like artificial intelligence chips, quantum computing, 5G technology, and information and data management.
There are also technological trends that are being over-extrapolated in terms of the value they’ll create.
Blockchain is an example. So are electric vehicles.
Even as normal vehicles and airplanes became innovative new means of transportation in the 20th century, automotive OEMs and airlines have returned about zero to shareholders on net over their time in existence (now more than a century).
They are capital-intensive, thin margin industries. A stock is a slice of ownership in a business. What you get as a shareholder is whatever is leftover after everyone else has been paid.
This is why auto OEMs and airlines traditionally trade at low multiples and have low valuations relative to their popularity in everyday life.
Sometimes a trend will emerge or there’s hype around certain companies that bids up their prices well in excess of their economics. Tesla (TSLA) is an example. But the economics of what they do is still on par with other auto OEMs.
Traditional auto OEMs will now increasingly launch their own electric car models at scale now that the economics are getting better as battery cost cheapen. And a company like Volkswagen can also fund operating losses on an EV division through its cash flow on its ICE vehicles.
A pure play electric car manufacturer can’t do that and has to raise capital. That’s why pure “alternative energy” auto companies like Tesla and Nikola are obsessed about their stock prices and engage in various tactics to inflate it. They need to be in order to raise capital and keep the project going.
Divergences on every level
There are big divergences between countries, asset classes, sectors, and companies within industries and verticals.
Even between individuals there have been big differences.
Someone who works on a computer or has their job tied to the digital economy has generally been more insulated from these influences or have even benefited.
Those who are involved in professions related to public gatherings or that require being physically present somewhere – e.g., painting homes, waiting tables – have been more at risk.
At practically every level you can think of in terms of how to splice up an economy or market, there are these divergent outcomes.
Example: Gold vs. Oil
The collapse in demand versus the expansion of liquidity has made a big difference in gold versus oil.
Gold benefits from an expansion of liquidity, effectively acting as the inverse of money. If you create money, it benefits gold in money terms because the value of money is going down.
Oil, especially spot oil, is a short-duration assets whose price is heavily influenced by current demand. Travel demand, in particular, is a big influence on the price of spot oil.
Gold, on the other hand, is a longer-duration wealth storage commodity. Little of it is used for near-term consumptions – i.e., converted into cash to buy goods and services.
It’s less of a traditional commodity dictated by production (supply) and consumption (demand). It’s closer to a currency whose value is in relation to fiat money.
Gold doesn’t have the same exposure to the level of demand in an economy as something with global industrial value as oil.
Stock market
The dispersion in sector performance in the stock market has also been large.
Technology sectors have performed well globally. They have less overhead compared to capital-intensive industries, so they have wider profit margins.
A knock to business can still mean they’re earning a respectable profit margin rather than swinging to a loss like many companies with little wiggle room. Many weren’t impacted at all by social distancing or even benefited from “stay at home” orders.
There are also less dependent on raising capital and have lower debt.
They can more easily get out of a crisis without the serious issues a company with thin margins and high debt might have.
On the other hand, the energy sector is down about 50 percent due to a big drop in global demand.
Likewise, banks are down around 20 percent due to credit losses and the element of margins being squeezed from longer term lending rates getting pressed down to the rates they borrow at.
Even though a lot of equity markets were flattish to slightly up in 2020 on aggregate, big differences went on underneath the hood.
Shifting capital flows between blocs
The low-rate and low-yield conditions we outlined above are prevalent in the West and Japan, but not to the same extent in China (the world’s second-largest economy) and the rest of the Asian bloc (including Hong Kong, Malaysia, Singapore, South Korea, Taiwan, and Thailand).
The share of economic output contributed by the US and developed Europe combined is about 30 percent of global GDP. The same is true for China and its above-mentioned neighbors.
However, when we look at the contribution to economic growth, China and the emerging Asia bloc are 3x higher than the US and developed Europe – 45 percent to 15 percent.
This is set to continue given the secular productivity trends.
Asian economies (excluding Japan) have more catching up to do with Western economies as they adopt digital technologies and increase their per-capita incomes. They also have larger and mostly younger populations than the US and Europe overall, which helps with future growth as their educated, working populations grow.
The East has largely done a better job of controlling the virus than the US and Europe while also limiting the loss of economic activity.
This has helped reduce the need for fiscal relief funded by central bank monetization.
Moreover, these countries are also savers and lenders to the rest of the world and run current account surpluses. This means they don’t rely on foreign capital to fund themselves, which limits the potential for balance of payments issues.
Conclusion
Elections are important. But they don’t fundamentally change the main drivers going on currently that impact markets and economies.
We have five main forces going on now and most will remain relevant years into the future:
i) Monetary policy is out of room in the traditional ways in developed markets, leaving more of the burden of economic support on fiscal policy.
ii) Financial markets being awash in liquidity.
iii) That liquidity is seeking out quality stores of wealth to protect against:
– the disruptions in income and spending related to higher than normal risks from the virus and the lagging confidence it will bring, and
– the devaluations in money that creating more of it brings
iv) More capital is shifting from Western to Eastern economies and markets to seek out higher nominal returns.
As a result of all this, we expect more portfolio flows to move from Western investments to Eastern/developing Asia investments, and more capital to continue chasing what are deemed to be quality stores of wealth.
This can include some stocks (e.g., consumer staples, some utilities, some technology companies on the frontier of productivity) as well as things like gold and some Asian currencies relative to the dollar, euro, and yen over longer time horizons.