Stagflation: How It Occurs And Building a ‘Stagflation Portfolio’


Eventual stagflation could be a risk for the economy and markets and one that’s currently vastly under-discounted.
We’re in a situation where the central bank has pushed a lot of liquidity into the markets and brought up the financial economy (i.e., prices of financial assets) while the real economy (i.e., aggregate transactions volume in goods and services) remains weak.
There are two broad ways it can play out:
i) Either asset prices have to “catch down” to activity in the real economy, or
ii) the real economy will have to reflate in nominal terms.
Regarding the first option, financial assets are simply securitizations of cash flows. If those cash flows don’t exist to a certain level, then the fundamental valuation is difficult or wholly impractical to justify.
On the second point, the real economy can also “catch up” to financial assets, but this would be likely to take the form of higher inflation rather than higher real growth.
Real economic growth is a mechanical function of productivity growth and increases in aggregate output, either through population growth and/or a greater skilled labor force.
Real growth isn’t likely to go up much in the US and throughout most of the developed world because of productivity in the 1.5-2.0 percent growth range (in year-over-year terms) with labor force growth going up by some 0.0-0.5 percent per year.
Nominal growth is the sum of real growth and inflation. To get nominal growth to match financial assets, it’s likely to come in the form of inflation. Higher inflation without much in the way of real growth is called stagflation – a portmanteau of stagnation and inflation.
The 1970s and early 1980s were the last time stagflation was a concern in the US.
Currently, there are a lot of deflationary pressures in the economy from the very high debt burdens, lower productivity, aging demographics, and technology’s influence in increasing the supply of certain goods and services, price transparency, and other efficiencies.
Stagflation could nonetheless also be a concern if a lot of the money and liquidity support being pumped in by the Federal Reserve (and other central banks throughout the developed world) gets into the real economy.
What are the limits of MMT – i.e., of joint fiscal and monetary policy?
The limit of MMT, or quasi-joint fiscal and monetary policy, is essentially in how long can you deliver income – via, e.g., payment transfers or a government jobs program from printed money.
What stops the ability to do this?
From a policymaking standpoint, you can’t simply print money ad infinitum and put it into viable projects for the economy because you’ll eventually run into a problem.
This will manifest in either:
a) a problem with inflation,
b) a problem with the currency (devaluation), or
c) a combination of both
For market participants, that’s what they have to watch out for.
There are also distributional effects across countries. The US is the world’s top reserve currency, so they can do more of it than others.
Countries in developed Europe and Japan can also pursue these policies but to a lesser magnitude than the US relative to the scope of having income gaps to fill.
Emerging markets are the most strained. Any emerging market central bank can buy its local currency bonds and anchor its yields at low levels.
But not many emerging markets can do that because their currencies don’t have as much demand. Lowering the yields on the debt (i.e., a future claim on the currency) reduces the demand for it, holding all else equal.
Accordingly, it’s the currency and fear of depreciation that is the fundamental constraint on quantitative easing in emerging markets.
Some countries will naturally hit the threshold sooner based on the size of the deficits, how much more catching up to do they have in terms of replacing income and spending, and based on how much demand there is for their currency.
Those that have less room are likely to see problems in terms of inflation.
The US, while in the privileged position of having the world’s top reserve currency, is also pushing in that direction. The global demand for the US dollar (about 60 percent of international debt and FX reserves), especially in relation to the US’s overall relative level of global activity (now down to around 20 percent), is often taken for granted.
Inflation and/or currency problems in some form is the likely means by which the “printing press” gets shutdown should it get to that point.
Trade-Offs
Policymakers will face difficult choices.
In emerging markets, you have to think through what the domestic pressures are relative to the balance of payments pressures.
Virtually all emerging markets are facing domestic dislocations. If they want to spend higher than their incomes (which in turn can’t go higher than their productivity over the long-term), then it’s a matter of where they’re going to get that money.
Can they create the money domestically or do they have to bring it in from foreign banks and investors?
They tend to be limited on both fronts, so emerging markets run into these constraints faster.
To an extent, they benefit from the reflationary tactics going on in the US and other developed markets. When the Fed and Treasury work together to add liquidity to the US economy, some of this liquidity also gets into emerging market assets as investors look to get higher yields in foreign markets that they can’t find domestically.
Emerging markets with more developed credit markets will be able to deal with the crisis more effectively than they have in the past.
There’s still nevertheless a big difference in degree between emerging markets and developed markets as a whole.
Brazil is more aggressive in terms of what they’re doing fiscally to replace lost income. Countries like Russia and Mexico are willing to take more of a hit to their incomes and spending. They’re going to have big recessions, and there are the matters of social fallout and conflict that ensues when these problems emerge.
But it’s a matter of the trade-offs associated with avoiding the currency, balance of payments, and inflation problems they’d be susceptible to if they were more aggressive in keeping incomes elevated through the fiscal and monetary policies.
Those who pursue more aggressive actions are more prone to taking a hit to their currencies (and/or greater currency volatility) relative to those who are less aggressive.
What happens if and when unacceptable outcomes start occurring from ‘MMT’?
For example, if goods and services inflation were to tick up to 4 percent in the US (above the Fed’s two percent target), can policymakers pull back just a bit to alleviate this issue?
Right now, central bankers aren’t very concerned about inflation. (For that matter, neither are traders or investors, which will get into more below.)
Traditionally central bankers have viewed inflation as primarily a cyclical phenomenon. Namely, less labor market slack was likely to produce inflation. Conceptually this is generally straightforward as a lower supply of something relative to its demand is likely to drive up prices.
Since they’ve appropriately adapted their positions to view the various disinflationary elements (the aforementioned high debt, low productivity, low labor force growth, technological forces) as more secularly influential on tamping down inflation.
Nonetheless, stagflation is one of the big risks that policymakers face, as well as market participants as they think about positioning their portfolios.
If unacceptable inflation doesn’t rear its head up, then you can focus heavily on getting growth back up through easy policy in the usual ways – i.e., keep interest rates low, buy financial assets, monetize fiscal deficits, maintain credit and liquidity support programs to the extent necessary.
Fed policymakers will also accept some level of weakness in the dollar. A lower currency is good for borrowers relative to creditors. This is especially true with external debt levels at over 40 percent of GDP.
But if inflation materially ticks up, then that can be a big inflection point for markets. At the highest level, it’s one of the main two forces driving markets (the other being growth).
If you look at the market pricing, it basically assumes that the Fed can practically do whatever it wants. And it basically has.
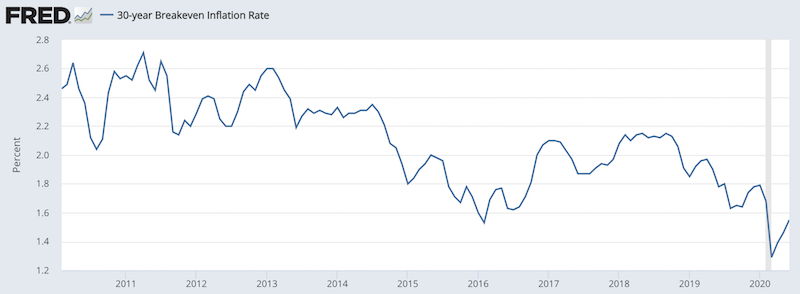
Stocks are high relative to expected earnings many years out. Inflation expectations, as implied through the TIPS market (i.e., inflation-linked Treasury bonds), are at their lowest levels ever.
The 30-year breakeven inflation rate is still well below two percent. In other words, market participants expect inflation to remain materially below the Fed’s target until mid-century:
The 10-year breakeven inflation rate is still below the lowest readings of the previous economic cycle that ran from March 2009 (bottom in markets)/June 2009 (real economy) to February 2020 (both markets and economy).
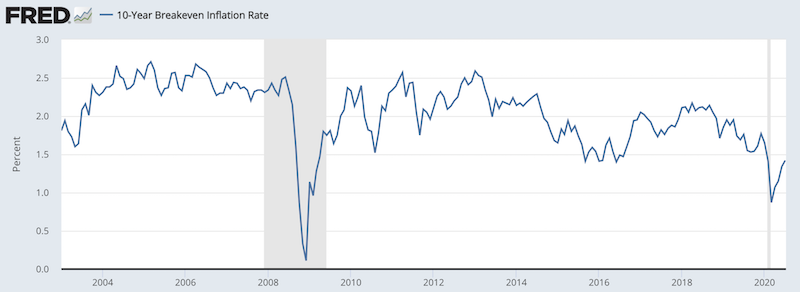
(Source: Federal Reserve Bank of St. Louis)
Despite the upside risks to inflation, these are pretty bearish expectations. The deflationary elements are indeed massive, but there’s a wide variety in potential outcomes and it’s a very long time horizon to forecast.
The market trusts that the Fed can get whatever it wants. So far, that’s pretty much happened in the form of bond rates having come down and mortgage rates have come down.
Other central banks are this way as well, such as Japan with its yield curve control holding 10-year rates at around zero and having short-term rates a bit below that.
The constraint on this is always the currency and inflation.
If inflationary picks up before monetary policymakers achieve their goals – such as:
– bringing unemployment numbers back below 5 percent and/or
– a resumption of a healthy positive growth rate with low, stable inflation
…then that’s going to tell the markets that central banks are indeed not “all powerful” or capable of getting exactly what they want.
So, traders will have to think ahead to the possibility of what an inflationary uptick means for markets before central bankers accomplish their desired goals.
That means not only matters like what happens to equities, but what entities are likely to benefit and suffer the most?
Tech and the long-duration assets that did well in a reflation may see an opposite reaction if the Fed is forced to tap the brakes on its liquidity programs. How will cyclicals (e.g., autos, industrials, steel) do relative to consumer staples?
How will commodities do?
Would this mean nominal bonds will sell off?
Are under-owned inflation-linked bonds are a better choice?
Will gold continue its strong run and march to new highs off the prospect of inflation and/or currency issues?
Individual policymakers are likely to do, or prefer to do, different things. Central banks have so-called “doves” and “hawks”.
The doves generally are okay with letting inflation run a little hot if it means getting more people into the labor force. Hawks are generally less tolerant of higher inflation, believing it’s too destabilizing to the entire system.
Everybody within the Fed and other central banks is more or less on the same page currently – namely, do what it takes to save the system.
However, if unemployment goes down to only eight percent and inflation hits four percent, then it’s a bigger problem.
This is how monetary policy was in 1970s where the unemployment and inflation trade-offs were very acute.
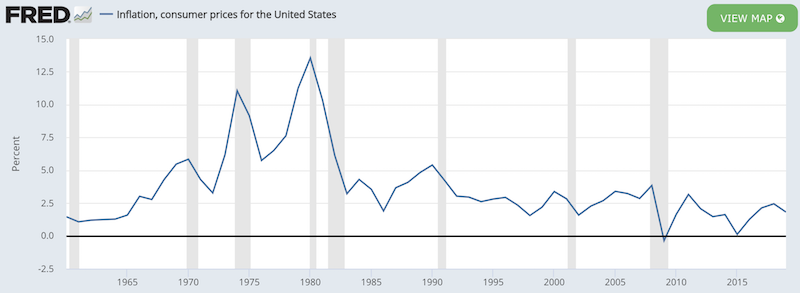
(Source: World Bank; St. Louis Federal Reserve)
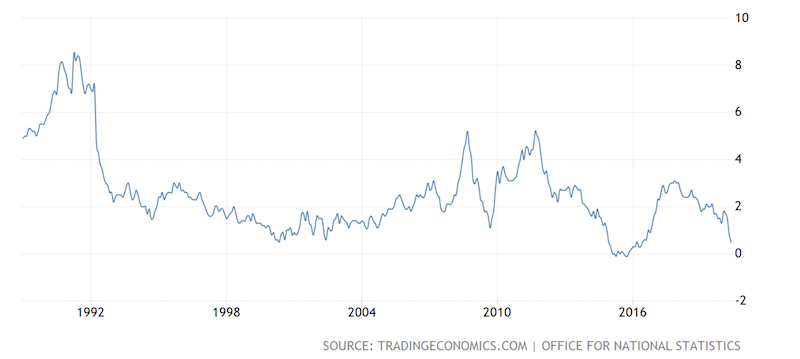
Or in the UK in the early 1990s when it held the pound out of line with its fundamentals by staying in the European Exchange Rate Mechanism (ERM) before dropping it in September 1992.
In retrospect, it’s easy to criticize central bankers for letting policy get “out of control” and allowing inflation to spiral upward. But the trade-off between weak economic activity and high inflation is not easy to make.
When Fed Chairman Paul Volcker in 1981 decided the US had had enough of the double-digit inflation rate, the central bank hiked real rates above inflation. That eventually cut off credit enough to kill the inflation but put the economy in a recession. The US has faced disinflationary trends in the 40 years since.
The current situation of the UK economy, in particular, is an interesting case. Being on its own independent free-floating currency unlike most of developed Europe, it’s had control over its own fiscal and monetary situation, and been aggressive with its policy response.
At the same time, the GBP doesn’t have the same reserve status as the dollar, or even the euro or yen. Measuring all global FX reserves, the GBP is 4-5 percent of them.
It’s somewhat of a reserve currency, but it’s likely to face the wall sooner on its money printing. Other central banks in the main three reserve currencies (USD, EUR, JPY) should find the UK’s case interesting in terms of the inflation risk.
China, which does not a reserve currency through the renminbi, but the world’s second-largest economy and one of the world’s main credit systems, still has room in its nominal yield curve to stimulate in the future. But China will be learning from the situations of others that have less stimulation capacity.
The dangers of extrapolating low and/or stable inflation
In several previous articles, we’ve talked about the dangers involved in extrapolating the past in trading. When the underlying conditions change such that the past is not a good model for the future, applying the past as a template for the future is a risky gambit.
Although we’ve likely reached the bottom in terms of the labor market struggles, unemployment is still likely to remain high for quite a while. That’ll depress demand and be a drag on growth. That’s inherently deflationary.
So, when talking about potential higher inflation and how the trend has been toward disinflation over the past four decades, it can be confusing to traders who have been used to these elements.
First, it’s important to remember that the nominal interest rates that the central bank sets directly through short-term rates, and the longer-term rates it can influence through purchases of assets, are a function of nominal growth rates.
If an economy has interest rates that are too high relative to the level of growth, that’s a drag on the economy. The debt compounds faster than the economy can grow and it eventually leads to debt servicing problems if not rectified.
So, central banks work to keep nominal interest rates below nominal growth rates to keep a positive spread.
The same is true with investing or trading your capital. You know you can get a certain return on your cash and you pay a certain amount if you borrow that money.
Then you look at what you’re likely to return. You look at that spread to determine what returns you’re likely going to achieve and estimate how much risk that will entail from volatility, leverage, and those factors.
When there are deflationary elements, that’s a drag on nominal interest rates. Because lower interest rates help the value of asset prices through the present value effect by which cash flows are discounted, lower inflation is generally a positive thing.
But when the same secular theme has been occurring for several decades, it’s easy to assume that it can continue even when that limit has much less room. Since 1981 in the US, we’ve gone from 20 percent interest rates across the curve to 0 percent interest rates almost uniformly across the curve.
When your hurdle rate on investment goes from 20 percent – there aren’t that many investments that will consistently give you more than 20 percent in year-on-year returns – to 0 percent (where many different investments become feasible), that’s a huge driver of positive returns.
Since 1981, a US 60/40 stocks/bonds portfolio has given about 10 percent annualized returns with just under 10 percent annualized volatility. Over 40 years, that’s a 45x return.
Its Sharpe ratio has been a very good 0.63. (Standard asset class Sharpe ratios over the long-run are 0.2 to 0.3.) Its worst year was a manageable minus-14 percent. In a disinflationary environment, stocks and bonds often do a good job of hedging against each other, frequently moving inversely to each other.
Portfolio Allocations
| Asset Class | Allocation |
|---|---|
| US Stock Market | 60.00% |
| 10-year Treasury | 40.00% |
Portfolio Returns
| Portfolio | Initial Balance | Final Balance | CAGR | Stdev | Best Year | Worst Year | Max. Drawdown | Sharpe Ratio |
|---|---|---|---|---|---|---|---|---|
| US 60/40 | $10,000 | $452,128 | 10.13% | 9.65% | 31.69% | -14.01% | -26.40% | 0.63 |
1981 to 2020 Performance of the US 60/40 Portfolio
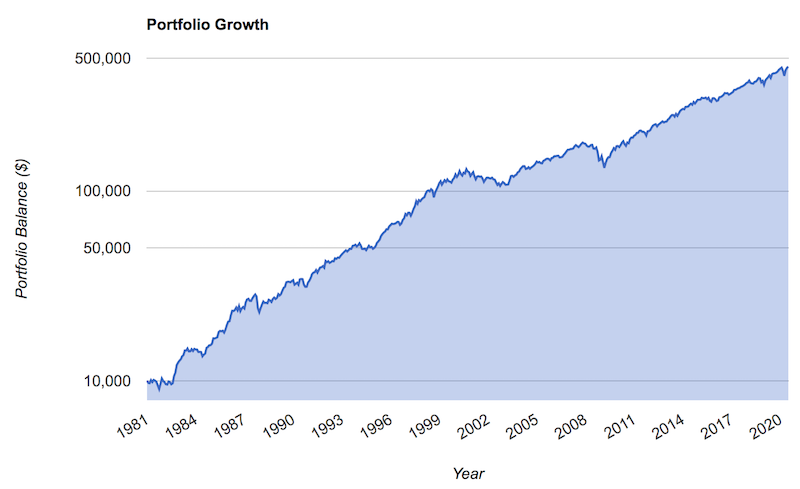
(Source: portfoliovisualizer.com)
Annual Returns, US 60/40 Portfolio, 1981 to 2020
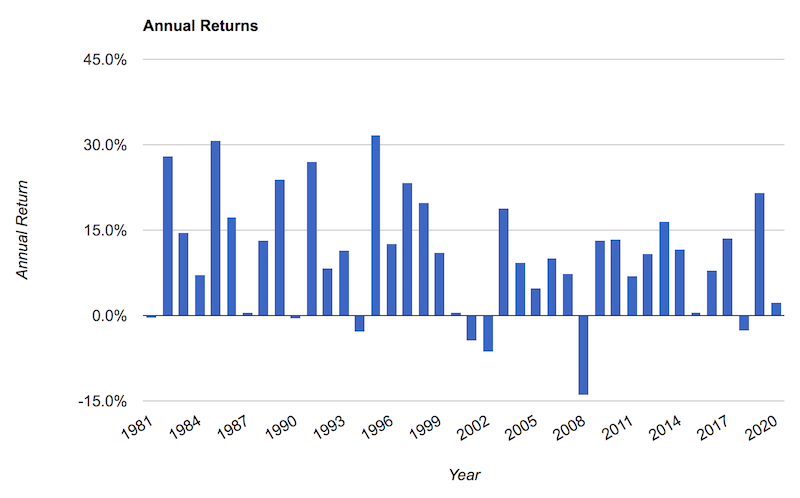
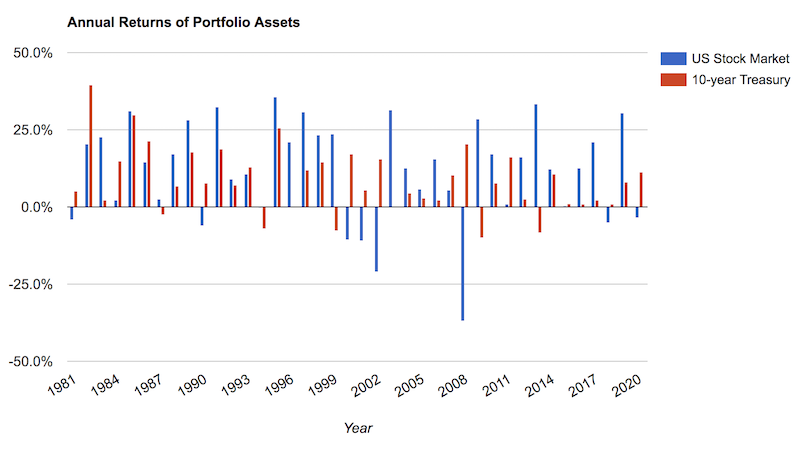
We can see in the chart below that in the bad years for the stock market – e.g., 1981, 1990, 2000-02, 2008, 2020 – bonds did a good job of offsetting their losses.
It’s easy to forget that disinflationary tailwinds were behind this type of performance. The issue for market participants is they might not recognize when this changes, and what to do about it.
Looking backwards, the big spike in rates to control inflation in 1981 gave way to a larger debt to income ratio (lower interest rates encourage credit creation).
There was also the element of globalization that allowed production to be off-shored to wherever goods could be most efficiently produced in cheaper emerging and frontier markets. This reduced labor costs.
In the 1990s there was a boom in technology that was deflationary.
More debts from lower interest rates fueled more deflation, as these debts are a claim on someone else’s future income. So, instead of getting to spend that money to influence prices of goods, services, financial assets, commodities, and so on, it went toward debt servicing.
Some of these influences have turned or are approaching their limitations.
For example, globalization has likely peaked or at least plateaued. More of the world is going into a period where self-sufficiency and having resilient supply chains is being prized in lieu of efficiency.
Like the 1930s, where there are already many parallels, there’s the risk of tariffs. That’s already started and could become a bigger part.
So, the disinflationary impact of globalization is at risk.
Central bankers have a statutory mandate to keep output high within the context of price stability. With the Phillips curve relationship describing the trade-off between labor and inflation (i.e., economic capacity utilization relative to potential), central bankers view inflation heavily as a cyclical matter.
If we think about the last decade-plus where the economy improved from the financial crisis, there really wasn’t much inflation in all developed markets.
Even as the unemployment rate (red line in graph below) dipped down close to or below estimates of the long-run unemployment rate (blue line) from mid-2016 onward, inflation didn’t pick up much (green line, right scale).
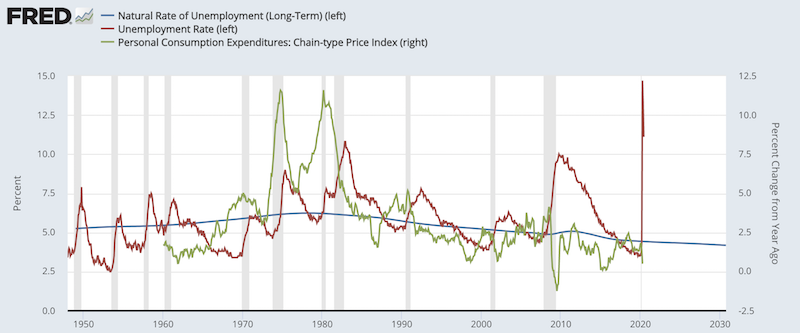
(Sources: BEA, BLS, CBO)
It wasn’t so much the cycle that was driving it. That’s a force, but it was also being offset by large secular forces: globalization, debt, aging demographics increasing dependency ratios (i.e., income relative to liabilities), and technology.
The potential inflationary shift
MMT, or joint fiscal and monetary policy, helps create money to meet demand. But money, like credit, is just a tool that gives spending power. Money doesn’t actually create the supply of the goods and services.
If you have the same demand but less supply, that’s inflationary holding all else equal.
If you do too much of that policy where you create demand by lifting up the supply of money and credit, but it comes without a corresponding supply boost and creation of things demanded, you could potentially see that shift.
After the financial crisis in 2008, there was some sentiment that the amount of quantitative easing would lead to inflation. That didn’t turn out to be the case.
Financial asset inflation was very real, but not much of that went out into the real economy.
It helped those who owned assets. Those who have less wealth and own fewer assets didn’t benefit near as much. This drove higher wealth gaps, which in turn has spilled over into other types of conflict (social, political).
Other forces, like globalization, hollowed out the job in many parts of the country and also left more individuals behind, fueling populism and more social rifts, which are only amplified in a downturn.
Differentiating QE from MMT and its impact on prices
QE is mostly about creating money to replace credit. This helps one offset the other to maintain spending power. Supply usually doesn’t drop much in a credit crunch, so it’s not too much of an issue either on recovery or the inflationary element a supply collapse would have.
When there’s a collapse in credit, that’s a deflationary impulse. The money simply offsets it and fulfills the same purpose.
While many may think a big surge in money creation is inflationary, what’s really happening is negating the deflation from falling credit.
If they balance out or there’s not much more money created relative to the amount of credit that contracted, it won’t make a difference to the price level in the real economy.
When nominal interest rates are pushed below nominal growth rates across the curve that helps bring back that positive spread and help deleverage the economy, at least relative to debt servicing requirements.
QE in 2008 helped the economy from getting worse and the economy recovered. But growth was low as the economy started from a high debt base and was very sensitive to interest rates that would require them to be low for a long time.
While the QE dynamic is money replacing credit, the current joint fiscal and monetary framework we’re in now involves money replacing income.
Unlike QE’s role in simply replacing basic spending power, the issue in this case is that the job – i.e., the source of the productivity – isn’t getting replaced with money replacing income. That contracts the supply side.
The money is there but it’s not matching supply. Money going up but supply in goods and services going down carries a different inflationary dynamic.
This doesn’t necessarily mean it will be inflationary as the elements that weighed on inflation all those years are still very real, but it’s more of a risk when you’re using money to simply make up income rather than make up credit like in a classic credit bust (e.g., 2008).
Given the situation, it’s a risk that’s worth taking. People need income and weren’t getting their jobs back for an extended period.
Does the cause of inflation matter to financial markets?
There are two components to inflation:
– the supply side (often termed cost-push inflation)
– the demand side (often termed demand-pull inflation)
Lower supply and higher demand are inflationary. Higher supply and lower demand are disinflationary.
Inflation typically is demand-side, where the demand for labor increases in excess of its supply, rarely because supply goes down. That’s what people typically refer to when talking about a “hot economy” that central bankers usually cool off late in a business cycle by hiking interest rates.
But does it matter what kind of inflation it is?
Inflation in financial assets is actually more dangerous than inflation in goods and services because the financial asset inflation seems like a good thing and isn’t prevented. But in reality it’s like any other form of indebtedness.
Investment booms financed by debt that go along with low levels of inflation typically occur before busts. This was true in most of the world during the 1920s, Japan in the late 1980s, and in much of the world in the mid-2000s.
Cyclical inflation in the real economy is easier to deal with by raising rates or pulling back on other liquidity programs.
Monetary inflation when you’re in the process of monetizing your budget deficit or filling in lost income from lost jobs – i.e., before it’s reconciled – is a bad predicament for policymakers to be in.
People will want to get out of the bonds and currency. This puts a strain on the system due to pressure on interest rates to rise.
That means more money printing to buy up the bonds to keep rates low, which can undermine confidence in the currency further. This is a common theme that restricts emerging markets.
This is a more immediate risk to other parts of the world than it is to the US immediately – emerging markets (non-reserve currencies) –> non-US developed markets –> US (top reserve currency)
There’s still a lot of savings in the dollar for US policymakers to continue to push the envelope without developing the inflationary issue or currency problems as some other markets will.
For example, you could probably see something like gold appreciate more in EM currencies while these policies are being applied, followed by non-US developed market currencies, followed by the US.
But it also depends on the policy mix.
Some countries, as mentioned earlier, are more keen on avoiding balance of payments and currency issues, allowing real interest rates to stay high, and letting it flow through lower incomes.
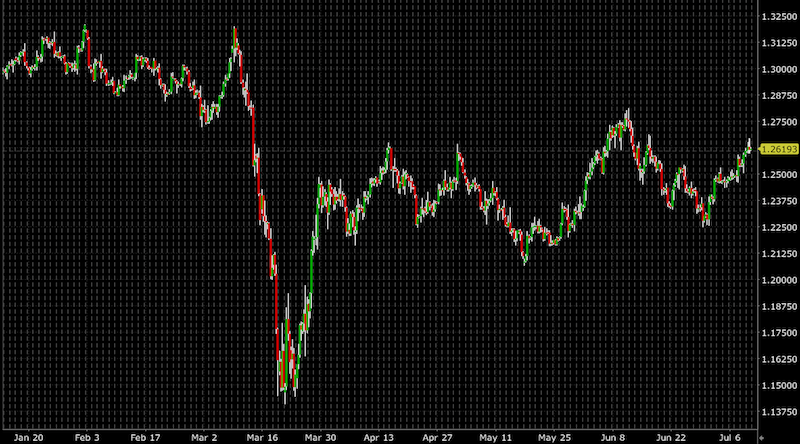
Non-US developed markets like the UK will hit the wall sooner on these policies than the US given less global savings in the British pound.
GBP/USD Jan 1, 2020 to July 10, 2020
Reserve currency status
We’ve also covered this is in previous articles, but having a strong reserve currency is one of the great privileges in being able to pursue these policies.
When your finances get worse with high amounts of liabilities relative to incomes and those liabilities increasingly come due, that stresses the reserve status.
It’ll cause the dollar to decline relative to gold over the long-run as it’s an alternative that people fall back on historically when fiat currencies don’t work or retain their value as well.
Losing that massively hampers the ability in how far policymakers can go to manage the economy where they’ll more easily encounter currency and inflation issues before they can accomplish their goals.
What can traders and investors do to prepare their portfolios?
There’s a very wide range in outcomes if policymakers can’t get what they want and help engineer a soft landing for the economy.
It could range from anything from a deflationary depression to stagflation or even an inflationary depression.
You can’t time anything perfectly or know exactly what’s going to happen, but you can always prepare.
There’s also political risk. As this is being written before the November 2020 US Presidential election, there’s a situation where, for example, Joe Biden (a Democrat) could win yet Republicans hang onto the Senate. That could hold up progress on fiscal policy with Congress and the Executive branch at odds on what to do.
There’s the risk of not doing enough and ending up with deflationary consequences due to political risk. When joint fiscal and monetary cooperation is necessary you could see a stall if the political system is dysfunction.
This isn’t a good thing to have when you have high unemployment and collectively over-leveraged corporate balance sheets. The government will have a continuing hand in helping move the economy and markets along. For the markets to perform well, the government’s going to have to be a big player in them directly or indirectly.
There could be a situation where Trump wins again and it’s a continuation of the fiscal spending policies with the Fed more or less monetizing them.
If inflation picks up before the growth problems have been resolved, you could get into a stagflation type of environment where foreign investors lose confidence in the dollar.
Stress testing
Stress testing is important. If a trader stress tests their portfolio through the deflationary outcomes and through the 1970s type of situations, does that provide acceptable outcomes?
A 60/40 stocks and bonds portfolio did okay during the 1970s in nominal terms (roughly 1972 from going off the gold standard to the 1981 peak in interest rates).
Portfolio Allocations
| Asset Class | Allocation |
|---|---|
| US Stock Market | 60.00% |
| 10-year Treasury | 40.00% |
Portfolio Returns
| Portfolio | Initial Balance | Final Balance | CAGR | Stdev | Best Year | Worst Year | Max. Drawdown | Sharpe Ratio | ||
|---|---|---|---|---|---|---|---|---|---|---|
| US 60/40 | $10,000 | $18,403 | 6.29% | 11.39% | 24.90% | -15.07% | -28.54% | -0.09 |
But notice that the Sharpe ratio is negative. In other words, the 60/40 portfolio actually underperformed cash for a decade straight.
It held up in nominal terms reasonably well. If you invested in 10-year US Treasury bonds during that period, you got whatever that yield was. Stocks returned positively in nominal terms absorbing a lot of the inflation.
The portfolio still returned a respectable 6.3 percent annualized over a decade. But this was below the inflation rate for the period.
US 60/40 Portfolio Growth, 1972 to 1981 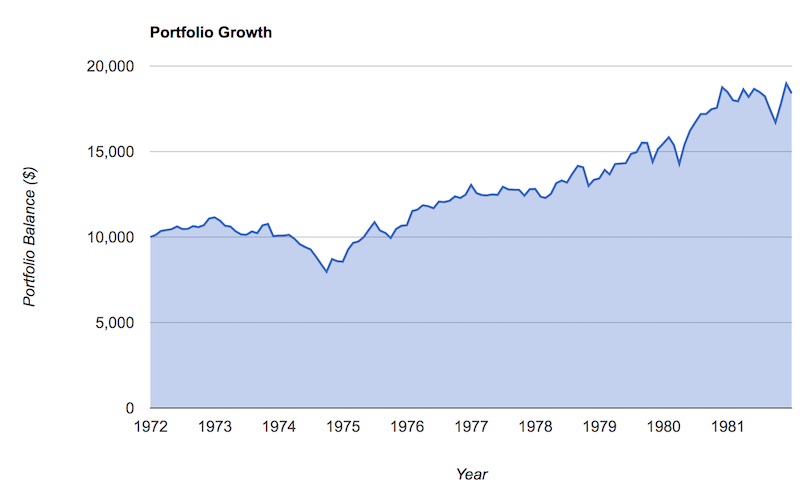
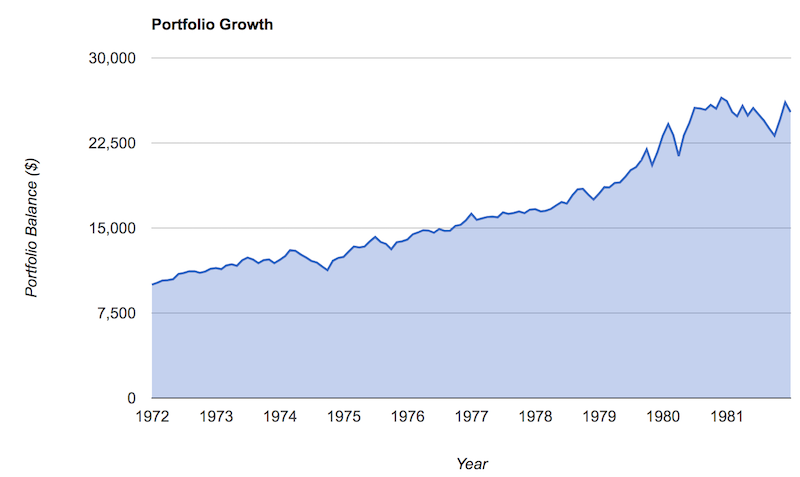
But it wouldn’t have outperformed a portfolio that was a bit more balanced on the stock and bond allocation and included 10-15 percent in gold.
Portfolio Allocations
| Asset Class | Allocation |
|---|---|
| US Stock Market | 35.00% |
| 10-year Treasury | 50.00% |
| Gold | 15.00% |
Portfolio Returns
| Portfolio | Initial Balance | Final Balance | CAGR | Stdev | Best Year | Worst Year | Max. Drawdown | Sharpe Ratio | ||
|---|---|---|---|---|---|---|---|---|---|---|
| 35/50/15 | $10,000 | $25,228 | 9.70% | 9.78% | 28.38% | -3.70% | -13.57% | 0.20 |
The Sharpe ratio is a more acceptable 0.20, in positive territory by benefiting from the inflation hedge asset in gold.
Also notice that metrics across the board are better with more optimal balance (more return per unit of risk, lower overall risk, better “worst year” performance, lower max drawdown).
You need to be able to accept a wide variety of outcomes going forward when the path is much less clear.
Balance is always important, but it’s even more important than normal.
The 60/40 portfolio isn’t likely to perform as well with that 40 percent in bonds not going to yield you anything. Some developed market nominal government bonds are fine in a portfolio for a source of safety, liquidity, and diversification. But they are practically worthless for income generation purposes.
Other ‘stagflation assets’
– Inflation-linked bonds (such as TIPS or index-linked gilts (ILGs)) could be worth owning and are under-owned more broadly. They help give you the inflation rate.
– Commodities outside gold are useful to own in a smaller quantity (5 to 10 percent). They do well in a particular environment. A diversified index like the AIGCI (Bloomberg diversified commodity basket) is available to trade at some broker-dealers.
– Some nominal bonds with yields. These include countries like China and most emerging markets. If you still get global deflation, then having these types of assets will both generate yield and can produce capital gains. Some investors get local-currency emerging market bond exposure through ETFs like EMLC. These are priced in those currencies, so there is some benefit to currency diversification as well.
Diversification improves your return per each unit of risk more than anything else you can reliably do.
Asset classes that are likely to struggle
– Nominal bonds in developed markets. With very little yield, no yield, or even negative yield – i.e., you pay to park your money in the government (or sometimes corporation) issuing them – these will generate practically no income.
They can go up in price a little bit and there can be a little extra benefit. But when central banks won’t allow much deflation, their returns are bad in both nominal terms and especially real returns.
Nominal bonds are basically a funding vehicle than an investment vehicle.
If policymakers see deflation, they can use the cheap borrowing rates and borrow in their currency – to the extent that they can – to invest in productive improvements in the economy. They can buy growth directly and get a positive ROI if they can effectively borrow for free or nearly free if they can avoid inflation and currency issues.
– Many stocks are likely to struggle. Companies that are economically sensitive are not likely to generate high real returns as a whole. These include cyclicals and industrials. Staples will always get bought because what they sell is necessary to physically live wherever you go. The genuinely innovative tech companies will remain good bets.
– 60/40 and 50/50 portfolios as a whole
These types of portfolios were never well-balanced to begin with because stocks are more volatile than bonds.
The 60/40 is really 88/12 if you do the risk decomposition. The 50/50 is more like 77/23.
Then you have the element of nominal bonds no longer being a reliable source of income or capital gains. That leaves more of the burden to produce returns on the stocks portion. And as bond rates get closer to cash rates, that pushes stocks toward that no-yield vicinity as well.
Simplified stagflation investing strategy
When it comes to investing for stagflation, it basically boils down to where is your wealth going to be destroyed? You want to avoid those.
Inflation eats up returns, so fixed-rate investment assets are not good. This means cash and it means nominal rate bonds. Even when inflation is on target – about two percent annualized – that means nominal bond yields that are anywhere from minus-1 percent to up to two percent destroy wealth.
So you probably want to get out of those because central banks have bought up so much of the market that they’ve become funding vehicles rather than investments – i.e., something you can get a positive real return on.
Once you’ve avoided the places that are likely going to destroy wealth, it moves into the framework of what are your stores of value?
Stores of value or alternatives include:
- certain types of equities (e.g., consumer staples, certain innovators that don’t depend on the macro environment)
- certain types of alternative currencies (e.g., gold, precious metals)
- real assets (e.g., commodities, collectibles, land)
- private businesses with positive cash flow
- different countries and currencies
- different investment strategies, such as ARP or VRP
Certain types of assets that aren’t as dependent on the credit cycle can benefit from a stagflation environment.
For example, consumer staples that sell stuff that people always need can be stores of value. Everybody needs to eat, needs basic medicine, and so forth.
What are the things that are always going to be in demand? Try to own them if they’re at reasonable prices, such that you can derive a quality yield from them.
So, those types of companies aren’t at risk of having their earnings hampered in a downturn relative to cyclical companies, such as auto or big equipment manufacturers.
Gold is a type of contra-currency that acts as the inverse of money if currency depreciation becomes an issue.
Real assets such as certain types of collectibles and land tend to do well if inflation runs above trend. Things like real estate also tend to be financed with fixed rate financing.
Inflation is good for fixed rate borrowers. If you borrowed at three percent (a typical mortgage rate in the US) and inflation runs above that three percent, you’re essentially getting paid to borrow in real terms.
And though traders and investors tend to view the investing world through a Western-centric lens, different countries and currencies have a different set of conditions.
While the West is facing intractable issues with very low real yields, that doesn’t characterize many countries in southeast Asia (China and others).
They have a normal short-term interest rate, normal bond rate, and normal earnings yields on equities. They didn’t blow out their fiscal balance sheets as they did in the US and other Western countries as a response to the virus.
They also have higher productivity growth rates and the normal policy levers to work with. Their GDP per capitas will come closer over time. So there’s likely to be a long-term currency tailwind. This could especially be true if money printing and debt issuance increasingly pressure exchange rates.
Investment and trading strategies also don’t need to just be long traditional asset classes. Having alternative risk premia (ARP) in one’s portfolio, including volatility and VRP overlay strategies can be valuable.
Conclusion
We’re in a new monetary paradigm where the adjustment of short-term interest rates and quantitative easing no longer work. This has pushed us to a new joint fiscal and monetary method of getting money and credit to where it needs to go.
We could have very large outcomes in the future path of the economy, anywhere from additional deflationary outcomes to something like stagflation or even paths like ugly growth and higher inflation that stuns what policymakers can do. Emerging markets are especially vulnerable.
Geopolitically, the world is going from interconnectedness and interdependence to one that goes more toward self-sufficiency. This could also provide traders and investors that diversify broadly to see lower correlation across global assets.
In this new monetary paradigm you can expect monetary policy and fiscal policy to be more extreme than normal, with its breaking point coming in terms of unacceptably high inflation and devaluation of the currency.
Accordingly, it’s important to have assets in your portfolio that can do well when stocks perform poorly as an asset. Over the past several decades, you could rely on safe nominal bonds to provide something of an offset. That’s largely no longer true.
But certain nominal bonds in emerging markets still have positive yields that could benefit if deflation is still the outcome. In China, in particular, nominal bonds tend to do well when stock prices fall, holding up the relationship that many in developed markets have become accustomed to over the past several decades. Emerging market bonds tend to be under-tapped by global investors.
Inflation-linked bonds, gold, and other precious metals are alternative wealth store-holds and likely to be better than nominal bonds. Consumer staples and other forms of defensive stocks who have stable earnings over time are likely to be more reliable.
Land is a classic tangible inflation-hedge asset. But it also depends on its utility. Malls, for example, are in secular decline. Student housing is generally viewed as a solid investment or even a hedge against recessions (when the economy is bad, more people go back to school), but there are risks with those types of real estate investments as well.
On the other hand, warehouse distribution centers near big population centers used for e-commerce are in secular ascent. Farmland and timberland tend to be less economically sensitive and sought after by some institutional investors for their diversification benefits.
Digital assets are a mixed bag. An online business providing steady income is clearly an asset. On the other hand, digital currencies and cryptocurrencies are predominantly speculative assets that have governance and regulatory risks, and for most it’s not clear how they generate productivity to give them long-lasting value when they lack the main two features of a currency (a means of exchange and a store of wealth).
Adding in some commodities as well could be useful. Stocks that are likely to always retain their earnings, like consumer staples, can take over more of a role from nominal bonds and act as a type of growing bond alternative.