Trading and Investing in the 2020s (Part I)


Trading and investing in the 2020s will require a different kind of template than the one that worked in the 2010s.
The set of conditions and forces that drove strong double-digit equity returns during the 2010s (at least in the US and developed markets) are no longer in place.
In other articles, we’ve covered the basic concepts of what moves markets and the forces that are continually driving economies and markets.
2009 to the present
The tale of the past decade-plus was a mix of the following factors:
1. The pushing of interest rates to zero or below zero in nearly all developed market economies.
2. Over $15 trillion worth of asset buying by central banks to push capital costs down further. Pushing down short-term interest rates down alone was insufficient.
3. The weak real-economy response to monetary stimulus and slow (but longer-than-normal) expansion, and the intensified response to a small dose of monetary tightening due to continued elevated debt levels (Q4 2018).
With asset prices high, interest rates very low, and toward the latter stages of the typical business cycle, we are in a unique situation in the markets.
For more than a decade, developed market equities have set new highs and we believe that this type of continued outperformance should not be extrapolated going forward. If anything, the opposite is more likely.
From our basic equilibrium template for studying the markets, we have the basic framework:
The price of any financial asset is simply the amount of money and credit spent on it divided by the quantity. If you can get at who the buyers and sellers are, how big they are, and what they’re motivated to do, you can more accurately predict where prices are likely to go.
These interactions are driven by three main things:
– the business cycle primarily driven by central banks
– debts in relation to incomes, and
– risk premiums among assets based on their risk and liquidity characteristics
Geopolitics and politics also play a role, and is arguably more important than normal because of the polarity between the two main political factions, which produces a larger than normal distribution of expected future outcomes.
The business cycle
The operating capacity of an economy can be neither too high nor too low.
The business cycle is primarily driven by the central bank, particularly through the adjustment of short-term interest rates (often called a cash rate or deposit rate).
If inflation is too low, this is taken as an indication that there is excess labor slack and the central bank will be inclined to ease policy. They normally do so by lowering short-term interest rates because it’s the most predictable way of conducting monetary policy.
When labor markets become tight and there is evidence that spare workers have been pulled off the sidelines, they have greater bargaining power over wages. This can help bring about more inflation.
When pricing pressures become too onerous, the central bank is likely to respond by hiking interest rates. This increases capital costs throughout the economy, which helps to “cool down” inflationary pressures. Money and credit don’t flow as freely and prices don’t usually rise as much. Higher interest rates cut down on credit creation and result in higher debt servicing, which diverts money away from spending and investing.
Toward the latter stages of the business cycle, getting the balance right between maximum output and keeping inflation within acceptable parameters becomes increasingly difficult.
This is typically why we have recessions, especially in reserve currency countries where the forces that often derail emerging market growth cycles – e.g., commodity supply shocks, natural disasters, inability to pay foreign-denominated debt – are less influential.
Income growth and debt growth must remain in line with each other
Debt – or debt servicing, to be more accurate – cannot rise faster than income indefinitely.
Productivity is what matters most in the long-run, and is the general process by which we learn how to do things more efficiently that drive living standards forward.
But economic cycles and movements in asset prices are heavily driven by the expansion and contraction of credit.
Productivity is not a big driver of financial asset volatility, at least not in relation to the influence of credit.
Productivity drives forward increases in incomes over time, but is not a material driver of economic cycles. Recessions rarely happen because people become less productive relative to some previous point in the past.
If credit didn’t exist, economic growth would ultimately boil down to productivity and growth in the workforce. Credit is a tool to help us spend above our means and achieve returns on investment beyond what we’d be able to otherwise.
But credit creates debt, which is a promise to deliver money at some point in the future. Debt is one person’s asset and another person’s liability. Given human nature is what it is, focusing more on immediate gratification rather than long-term results, the use of credit eventually gets economies into trouble. As people’s incomes rise, they become more creditworthy, which increases the value of collateral (e.g., financial and real assets), which makes them even more creditworthy, and so on.
The pattern of borrowing, spending more than you make, and then having to spend less in the future quickly begins to resemble a cycle. This is just as true for a national economy as it is for an individual.
When debt is too high relative to income, the potential for further credit growth to stimulate economies become less effective. Because interest rates are zero, near-zero, or negative in all developed market economies, this is an indication that the capacity to stimulate credit creation through the lowering of interest rates is reaching its limitations.
Notice in the US how, since 1981, each cyclical peak and cyclical trough in interest rates has been lower than the past. The current post-2008 in similar to the one we saw following the 1929 debt crisis.
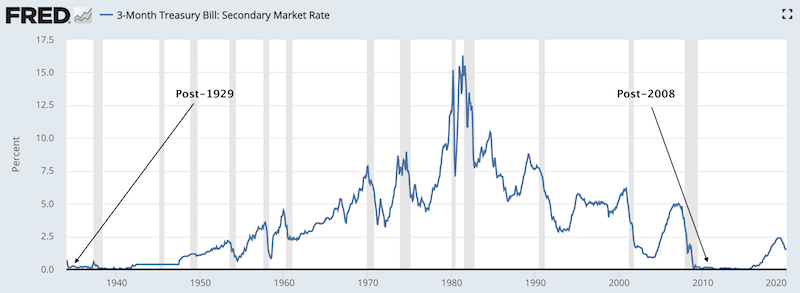
(Source: Board of Governors of the Federal Reserve System (US))
The clear downward trend in US interest rates over the past 40 years means that taking the economy as a whole, debts have risen relative to incomes. The implication is that when central bankers raise rates in an increasingly indebted environment, it has no issue slowing down the economy relative to previous cycles. This is because it increases debt servicing disproportionately to income. More money goes toward debt servicing and away from consumption and investment.
Moreover, easing becomes less effective in stimulating quality credit creation – i.e., the return achieved on each unit of credit issued.
Equilibrium interest rates therefore become lower. If nominal interest rates are not kept believe nominal growth rates, then the debt servicing requirements will eventually swamp the cash flows and the economy will turn down.
Sometimes policymakers run out of room because they can’t push interest rates any lower and must turn to alternative policy frameworks like asset buying (i.e., quantitative easing).
Risk and liquidity premiums
The return on cash must remain lower than the yield on bonds, which must remain lower than the yield on stocks, and by the appropriate risk premiums.
People who have quality uses for cash will use it and borrow it to achieve a higher return elsewhere.
In economies primarily driven through free enterprise and normal market signals, cash rates must yield lower than the return of product and service output (which makes up economic growth), otherwise they’re going to run into problems related to insufficient money and credit creation.
For this reason, it is the duty of the central bank to ensure that nominal interest rates – which they have heavy control over – remain below nominal growth rates to ensure the money and credit creation process in an economy remains healthy.
To keep risk appetite healthy over the long-term, compressions or inversions in these risk premiums – e.g., long-term bonds yielding less than cash – are permissible for short periods of time. This is to avoid risk-taking from getting out of control.
Naturally, investors and all economic participants need to develop a healthy fear of taking risk and understand that borrowing and investing indiscriminately is not a perpetually winning strategy.
This is why the Sharpe ratios of individual asset classes typically hover between 0.2-0.3 over long periods of time. This is a healthy ratio between excess returns relative to excess risks. The 1.3 Sharpe ratio of US stocks this cycle, from March 2009 to the present, is not sustainable.
As a fourth influence that doesn’t cleanly fit into any of the three, there is the effect of politics and geopolitics.
This is the process by which leaders are selected and how these equilibria are influenced on the basis of the decisions that they make.
How these forces and equilibria interact with each other goes on to affect the markets and economy.
From a trading and investing perspective, you can either:
a) Look at where we are within this framework to make tactical asset allocation decisions in the markets.
b) Or you can structure your portfolio strategically to balance your risk on the basis that the future is unknowable. Different countries and different parts of the world are typically in different parts of these cycles.
While it would be prudent for traders and investors of all stripes to heed caution when trying to make tactical asset allocation decisions in the market, you can, for example, know that classically the best time to buy stocks, for example, is when:
a) Liquidity and risk premiums are large. That is, earnings relative to the value of the index is high relative to the yield on cash and bonds and,
b) there is a large gap in output (e.g., high unemployment rates).
Policymakers manage these equilibriums through two primary levers:
a) monetary policy and
b) fiscal policy
Because of the policy response to conditions since the financial crisis, we are approaching constraints by which traditional tools are stimulative to the economy.
Based on the current mix in the main three reserve currency countries/regions (US, developed Europe, and Japan), we have low output gaps, very low interest rates, and very low forward returns in asset prices. This has stretched all the standard policy frameworks by which stimulus can traditionally be applied.
Going through each point:
1. Central banks have pushed rates very low and engaged in financial asset buying (also known as quantitative easing) to push traditional monetary policy toward its limitations.
2. This stimulus has pushed up the prices of all financial assets. While looking in the rear-view mirror the returns of financial assets look great, this also means they are more expensive and future returns will be much lower going forward.
Moreover, at the corporate level, this has helped fund a large dose of share buybacks, and consolidation activity through mergers and acquisitions.
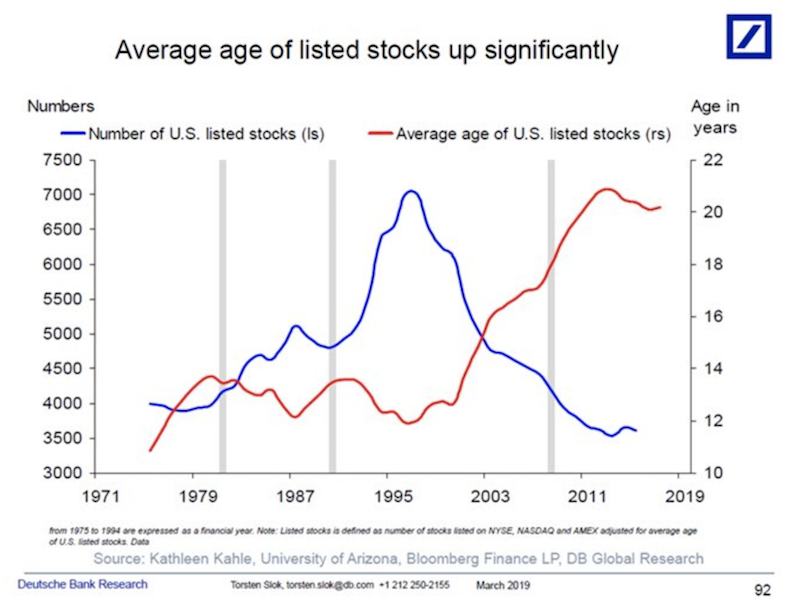
Private asset classes, such private equity and venture capital have also had a big wave of cash coming into the system and has driven these investments to very high levels. Because of the wave of M&A and quality access to funding in the private markets, many of these companies have felt no need to become public and the number of public companies has steadily decreased since the 1990s. It has also boosted the age of the average US exchange listed stock.
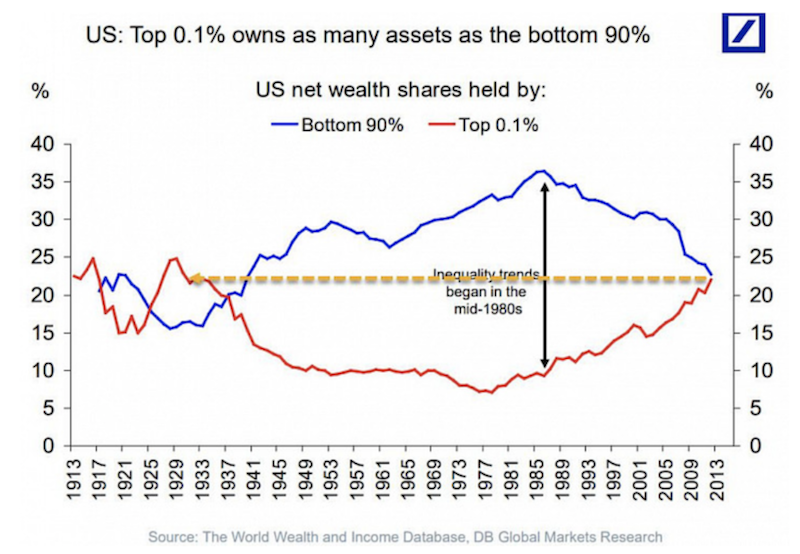
3. These policies were necessary to rectify the debt imbalances that built up leading into the 2008 financial crisis. However, one side effect has been the creation of large income and wealth gaps. These are the largest since the 1930s following the Great Depression. A similar policy response of zero interest rates and asset buying followed the 1929 crash because of the same debt dynamic.
Because those who owned assets benefited and those who did not own assets didn’t, these gaps widened.
Only a portion of the money created by central banks actually found its way into the real economy.
While high asset prices carry with it benefits for the real economy – e.g., more valuable collateral, lower borrowing costs – a lot of this new wealth has remained locked up at the top.
People and companies who are very creditworthy don’t have much issue getting capital at attractive prices. On the other hand, those who aren’t creditworthy are largely left behind and can’t despite the low/zero/negative interest rate policies provided by central banks.
Moreover, the dynamic of labor arbitrage, with offshoring and automation, has displaced lower-skilled labor and/or constricted the type of wages they can command in the labor market.
Even projects like Uber have made traditional labor cheaper. Instead of needing full-time cab drivers, people can join a ride-sharing network and rent out spare seats in their own car whenever they’d like. Cheap capital has made these companies viable, at least temporarily, because the hurdle rates to investment are so low and the availability of cheap capital is so plentiful. This means more companies can play the market share game and push earnings and operational cash flow to the back-burner for a very long time instead of becoming viable companies.
In other words, capital has disproportionately benefited over labor.
Deregulation and corporate tax cuts in the US have made companies worth more overall because they can do business more easily and retain more of any profits that they earn.
Because the environment has been broadly favorable to corporations, this has pushed corporate margins higher.
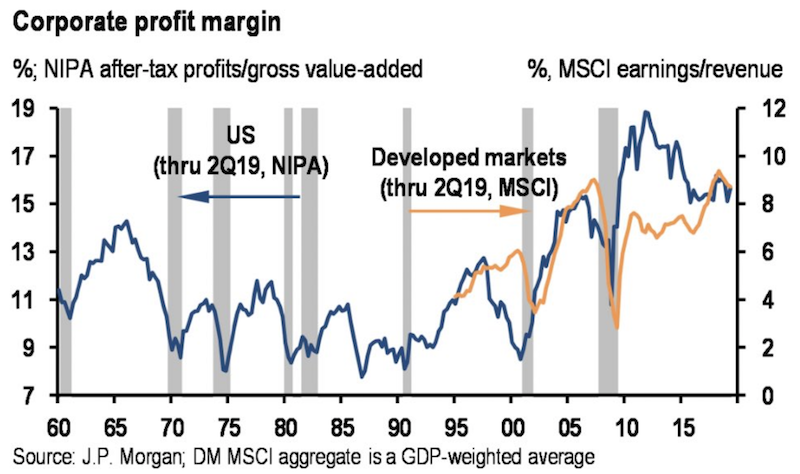
And margins have likely been pushed to a level that is not sustainable over the long-term. That is bad going forward for stocks because not only is the monetary policy tailwind going to be less effective, but margins are likely to compress as well. At the least, the rate of margin growth will be difficult to sustain. This means stock prices will become more dependent on sales growth. And high sales growth isn’t likely without higher income growth.
The pro-corporate backdrop has also led to social and political backlash in favor of more calls for pro-worker actions, such as increasing the minimum wage, a greater role for unionized labor, and higher taxes on wealth in various forms (wealthy individuals, corporations).
This has led to populism in its numerous flavors, such as the rise of Donald Trump, Bernie Sanders, Jeremy Corbyn, and the Five-Star Movement in Italy.
Looking Forward
Using the past to predict the future is dangerous when conditions shift to make the past a poor guide of how the future will look.
Looking ahead, we see the following forces at work:
1. Central banks will have issues stimulating as primary monetary policy (interest rates) and secondary monetary policy (asset buying) are no longer very effective in boosting the economy.
Because of the policy blunder in Q4 2018 that cause a ~20 percent stock market drawdown, central banks no longer have a tightening bias. The Federal Reserve failed to recognize the high amount of debt relative to incomes and the greater than normal sensitivity of asset prices to interest rates.
In terms of history, 2007 was similar to 1929. There was a large amount of debt that was coming due and not enough income to service it.
Defaults picked up and people needed cash to cover their liabilities. This means they needed to sell their assets to raise enough liquidity. This made people and companies less creditworthy, which pulled back credit creation further as lenders became more cautious, in a vicious cycle that wiped out a lot of wealth.
Because the problem was so poorly identified in 1929 because policymakers didn’t recognize the dynamic, as it was so different from the recessions that had occurred during their lifetimes, stocks lost 89 percent peak to trough.
In 2007-2008, even though the problem was also not identified properly and the Fed was late to react, when they did understand the gravity of the situation, they moved more swiftly.
In 1929, it took almost three years before stocks bottomed after the October crash.
In 2008, even though the top in the US stock market was in October 2007, the big surgical down move was not until September 2008 when the failure or near failure of large banking and other financial institutions became a reality. It took six months before the Fed got a floor under the asset and credit markets in March 2009 upon the adoption of its quantitative easing program.
Then, a long period of low interest rates followed to help work off the debt in relation to income.
During the Great Depression, this was the 1929 to 1937 period. When they tried to raise rates even slightly in 1937, stocks lost about half their value.
Likewise, from 2008 to 2017, we also had a period of very low interest rates. In 2017, they were able to raise a little bit before a major hiccup at the beginning of 2018. They tried raising again before the 20 percent meltdown in Q4 before they realized they had to go on hold again and adopt an easing bias.
Because central banks’ risks are asymmetrically skewed to the downside, they are no longer looking to tighten policy. Inflation is not a problem. And because of the lingering high debt relative to income they know the brakes are going to work if they need to use them.
Interest rates will not be normalized. Traders know this. They also see very poor returns in cash and bonds, so have piled into stocks lacking any normal liquid alternative. This has bid up their prices and lowered their future returns.
Because of this, we can expect central banks to engage in policies like yield curve targeting, which the Bank of Japan has already rolled out.
This works to keep the yield curve upward sloping to maintain positive lending spreads. When rates are very low or negative, doing so is difficult. When spreads aren’t appropriately maintained, this endangers the money and credit creation process the economy is dependent on to keep growing.
The US was in this type of system of capping the cost of capital during World War II to keep the costs of funding the war manageable.
Because Japan’s real estate bubble burst in 1989, eighteen years before the US and developed Europe found themselves in the same situation, Japan is often looked at as a paradigm for where developed markets are heading more broadly. This includes aging demographics that challenge pension, healthcare, and other unfunded obligations, increasing dependency ratios and widening fiscal deficits that prevent the raising of interest rates. They need to remain low to keep everything going.
2. This process is helping to elongate the expansion in a way that is historically unique. Most cycles come to their conclusion because the central bank hikes interest rates to reign in inflationary pressure.
This cycle is not likely to end because of the over-tightening of central banks because of the lack of inflation from the influences of high debt relative to income, demographics, and technological innovations that keep pricings in check, as well as globalization and automation that keep upward pressures on the price of labor moderate as well.
If inflation does pick up, it will likely be long off in the future once inflation trends above a target that the central bank is no longer comfortable with.
The cycle is more than a decade old, but the pace of growth has been very weak, and central banks are not likely to have the tools they need to fend off a recession where 500bps of easing is typically needed.
3. Will fiscal policy take the place of monetary policy as the main source of stimulus?
Monetary policy can only do so much. And while fiscal policymakers also have their own deficits to deal with, some parts of the developed world have room to stimulate.
Fiscal surplus countries – e.g., Germany, Netherlands, Switzerland, Norway – could chip in to avoid having so much of the stimulus responsibility from falling on central banks. Those four countries represent about $110 billion worth of spending potential if they were to get back in balance. This is worth about 80bps of total euro area GDP. This would raise global real rates by about 12bps in terms of its proportion to total global GDP, which is a bit above $90 trillion.
Moreover, increased fiscal and monetary coordination would be helpful.
And it can also be done in a way that preserves central bank independence that’s intended to act in the best interests of the economy and not cave to short-term political goals of elected officials.
Japan, again being the paradigm, has done this is some function.
This includes spending supports, such as monetizing fiscal deficits directly or either putting money directly in the hands of spenders and savers and tying it to spending incentives (often known as “helicopter money”).
This can come from a left-leaning policy framework – e.g., more spending on social programs or infrastructure spending – or from a right-leaning approach, such as lower taxes or higher military spending.
While there has been talk among policymakers within G-7 central banks, and other organizations like the IMF, for more fiscal spending support, there has not been much in the way of action.
The process is also political and the environment is far more polarized than normal, making compromise less likely. So, the likelihood of thoughtful coordination seems less likely. The range of possible outcomes, and therefore the effects on the economy and markets, is wider than normal.
4. Because of the wealth gap or greater divide between “workers” and “capitalists” the likelihood for continued social and political conflict is high.
This means a greater than normal range of policy outcomes that can impact growth and influence financial asset prices.
Accordingly, the impact of politics and the choices they campaign on (and make, if elected) will have a larger influence on markets than in the past, and also in relative terms compared to the traditional business cycle drivers.
5. Prior policy moves that benefited “capital” and “capitalists” (e.g., corporations, wealthy individuals) are unlikely to continue on indefinitely. In fact, there’s a chance they could be reversed.
If and when they do are political matters. But because of the disparities between “capital” and “labor”, the pressure for political solutions to these matters will continue. (And if and when policy is introduced that actually does ameliorate wealth inequality in a positive and not excessively redistributionist manner is another matter as well.)
6. Because real (i.e., inflation-adjusted) yields are negative on cash and bonds and risk and liquidity premiums on risk assets like stocks, private equity, and real estate are also compressed, there is much less capacity for central bankers to stimulate asset prices by any large amount (nothing like the past) to stimulate the economy.
7. Because asset returns moving forward will be low and much weaker than what we’re accustomed to, this is likely to result in weaker income growth.
US stocks since the beginning of this bull cycle in March 2009 have returned 17 percent annualized, including dividends, and delivered more than a 5x return since the 666 bottom in SPX on March 2009. Based on where we are currently, US stocks are expected to return less than one-third of that annualized return looking ahead.
This has implications for being able to service numerous IOUs in the future, such as pension obligations, healthcare obligations, and other entitlements. These are many multiples of the headline national debt figure – over 12x depending on the discount rate used.
While this is not a problem currently, these liabilities will continually get higher, especially as the demographic situation gets worse.
More people, particularly retirees, will expect to get paid without producing anything while workers who pay into the system will expect a large dose of spending power from these programs at some point in the future. And what workers contribute – and the return on this contribution – won’t be sufficient to grow the pie to the extent needed. Not everyone can be satisfied.
This isn’t likely to result in a 1929 or 2008 scenario where a large mass of debt obligations come due and can’t be paid.
Instead, it’s likely to represent a gradual and continual squeeze on growth. Policymakers will have no other choice but to “print money” in order to satisfy all these claims. But while such actions are inevitable, they are analogous to a Ponzi scheme because they’re simply exchanging one liability for another.
Conclusion
Because of the current circumstances surrounding developed market economies – primary monetary policy (i.e., interest rates) out of gas or close to out of gas, and secondary monetary policy (i.e., asset buying) in the same boat – it is dangerous for investors to believe that a continuation of current conditions and current market returns are sustainable.
However, we don’t know how and when things will play out and therefore position to best remain immune from betting on this.
We don’t know how politics will influence outcomes on the economy and in asset markets, particularly with a wider distribution of possible outcomes. Who will be elected, what policies will they pursue, what will be the legislative outcomes, and how will these impact the economy, markets, and different constituents within them?
If developed markets are close to being exhausted in terms of high investment returns going forward, then what markets, opportunities, and trading and investment strategies make sense?
We will cover these matters in further detail in Part II.