Is The Stock Market Overvalued?


This article was published on June 17, 2020
The fundamental value of a financial asset is the amount of cash that can be extracted from it discounted back to the present. When you buy a financial asset you’re putting up a lump sum payment for a series of future cash flows. So, any question of ‘is the stock market overvalued?’ has to come from that angle.
Valuation is still very different from considerations of market direction in the short-run. The price of a financial asset is the amount of capital spent on it divided by its quantity. That’s a different matter from notional equilibrium value, which is also subjective.
If we’re going to get into the trading, or the market timing and buying and selling element of trading the stock market, then biggest determinant of its direction and movement is when the expectation of that income stream changes. Markets are discounting mechanisms. They always bake in a certain conception of the future based on the weighted-average opinion of each participant in any given market.
The largest bouts of volatility in the market occur when this picture is disrupted. 2008 was a good example.
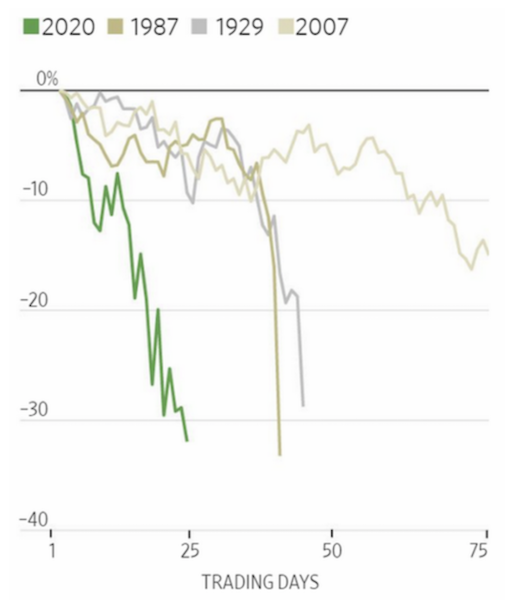
(Source: Wall St Journal)
The number of countries in recession globally is the highest it’s ever been, using data going back to 1870.
Share of Countries in Recession
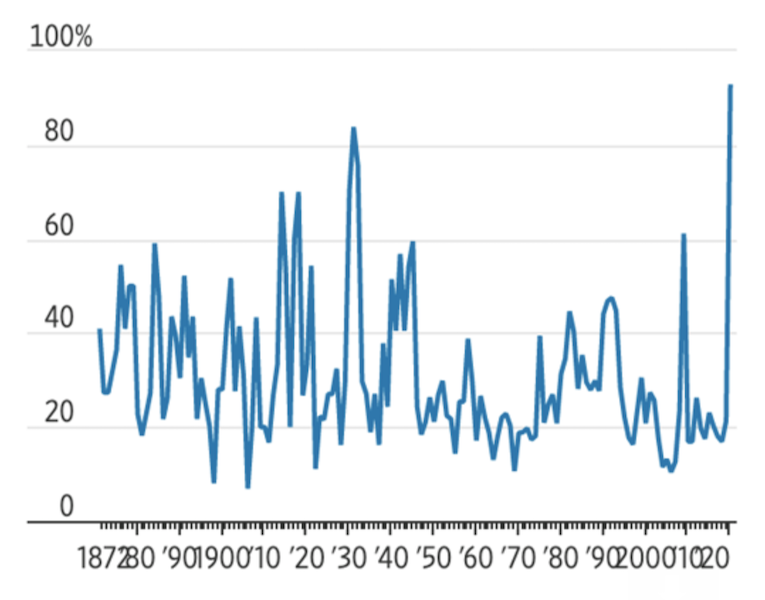
(Source: World Bank)
Is the stock market overvalued: intrinsic value approach
With some basic assumptions, we can build out an idea of intrinsic value. We need to know a few things:
Inputs
– What are current earnings of the index?
– How fast will they grow in the future?
– What rate will we discount these earnings back to the present? In other words, what is your required return per year?
Outputs
As for an output, we can frame a couple different ways:
– A terminal value – i.e., past a certain year, we stop discounting cash flows and apply a shortcut to get at the remainder of the business’s estimated value. The idea behind is that earnings far out in the future, e.g., beyond 10 or more years, are less important than earnings generated closer to the present and thus comprise a lesser fraction of the calculation.
– Assess what the cumulative discounted earnings are after a certain period of time (e.g., 25 years)
Based on the second option, we can see how much of our principal we would effectively make back by the number of years in the future. That’s how we’ll do it for this exercise.
It should become clearer once examples are shown. But the general idea is that once you put up a lump sum amount for an asset, you expect that to generate you income down the road.
For example, if you by a business for $1 million and believe it can generate you $100k worth of income per year, and it grows its earnings by 10 percent per year (which is also your required return expectation to keep the math simple), you will make your principal back in earnings in 10 years on a discounted basis.
Assumptions
So we’ll sensitive the valuation range based on the starting point for earnings.
We’ll do:
a) No drop in earnings (170 annual starting point for SPX)
b) 20 percent drop (136)
c) 40 percent drop (102)
As for growth, we know that the earnings of an asset can’t exceed its growth over the long-run.
In the US, productivity growth is about two percent annually or a bit less. Productivity growth is the process by which we learn more, invent more, and do things more efficiently over time. At the same time, it’s not the most volatile component. So, it’s not a big driver of market cycles, which are primarily driven by the expansion and contraction of credit.
Inflation in goods and services output is another component of growth and runs around two percent or a bit less in the US and most of the developed world.
Real GDP is a mechanical function of productivity growth plus growth in the labor force (or number of hours worked, however you want to frame it).
The labor force is mostly stagnant in the US. It has not grown much since the year 2000 as the US population ages out. Year-over-year increases in the prime-age (25 to 54) employment pool have been just 0.2 percent annualized since 2001.
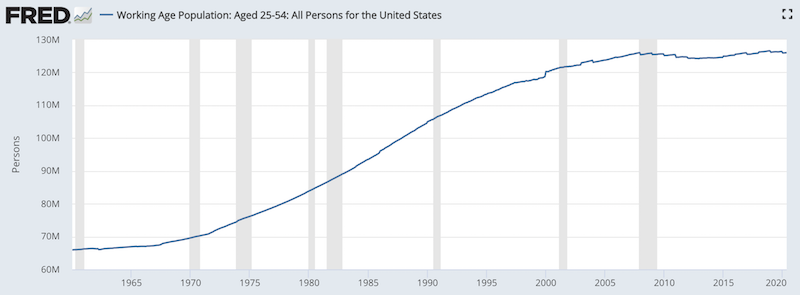
(Source: Organization for Economic Co-operation and Development)
Nominal GDP growth is equal to real GDP growth plus inflation.
Adding the two, one could expect around 4 percent growth in earnings per year.
Some additional growth could be found by firms targeting faster-growing emerging markets.
Or through financial engineering, such as a company leveraging its capital structure with cheap debt (i.e., that produces more cash through productive investments) or through mergers, acquisitions, corporate spin-offs, and other corporate processes and special events that can help unlock value.
When the interest rate on cash is low relative to the return on equity, that encourages a lot of buying of financial assets on leverage. That boosts asset prices but often sows the seeds of its own demise with that build-up of leverage and consequent risk.
Lower interest rates in an economy also help asset prices through the present value effect. It pushes more liquidity into the financial system, which gets into assets.
However, in the US, developed Europe, and Japan – the main three reserve currencies – you can’t get the interest rate structure down much because there’s a limit to how low interest rates can go. They can only go so negative before lending no longer makes sense. So, that’s no longer much of a tailwind.
Quantitative easing is also increasingly out of room. That means turning to alternative forms of monetary policy, which can impact asset prices directly or indirectly.
With that said, let’s get into our examples.
In each case, we are assuming a 4 percent nominal growth rate and a 6 percent discount rate.
A discount rate is an expected return on investment. That basically says – what’s the intrinsic value of the index if I need a 6 percent annual return? The higher the discount rate – i.e., the higher the return needed – the lower the price you’ll need to buy in at.
No drop in earnings
We assume 4 percent year-on-year growth going forward and a 6 percent discount rate.
The left-hand side of the chart tracks yearly discounted earnings. The right-hand side of the chart tracks the cumulative discounted earnings, which tabulates the value of the SPX index when all those cash flows are added up over time.
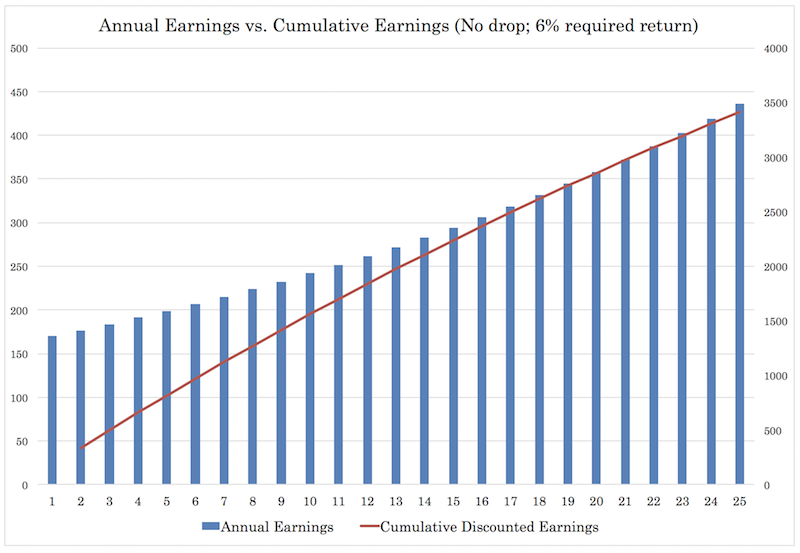
(Source: author’s calculations)
The series of annual earnings (blue bars) has a slight exponential curve to it because it is a compounding force.
You’ll see that the red line representing discounted earnings has more of a side-opening parabolic shape. This is because the required return (discount rate) is higher than the rate of growth. This means earnings become discounted at a higher rate than they’re being generated, reducing the year-on-year increase in the present value of future cash flows.
We can also see by year 22, that the discounted earnings run over 3,000 (the value of the index), which is tracked on the right side of the chart.
In other words, if the value of the index is currently around 3,000, then after 22 years the earnings you generate from your investment on a discounted cash flow basis would match your principal investment.
Is this too long? Then you might say the “stock market is overvalued” based on your assumptions and personal needs. If it sounds reasonable, then you might say it’s fairly valued.
It’s really no different than figuring out cash flow for real estate or any other investment.
20 percent drop in earnings
With a 20 percent drop in earnings, your discounted earnings add up to around 2,700 at the end of the 25-year period.
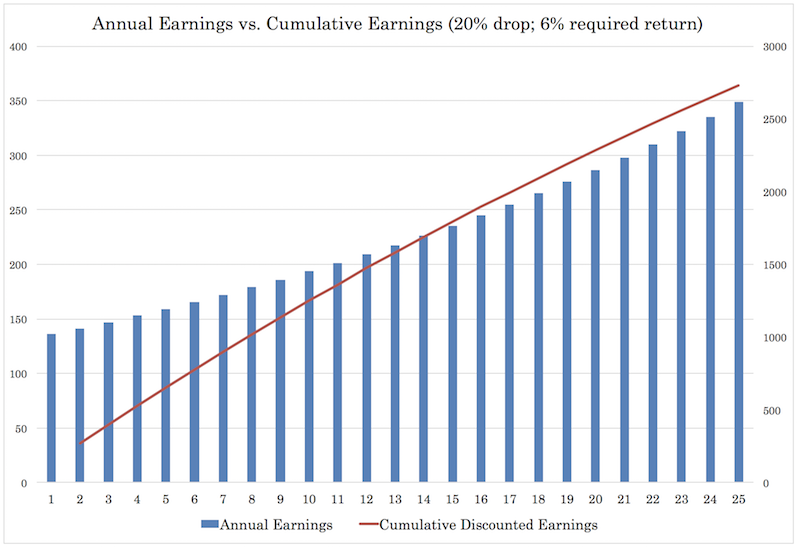
Again this assumes that earnings drop 20 percent and start growing again by 4 percent year-over-year from that point forward.
Most investors are more optimistic than this. Under this scenario, discounted earnings run above the 2,000 mark by year 19.
40 percent drop in earnings
If earnings fall by 40 percent with a slow recovery, it would take until year 25 before discounted earnings went above the 2,000 mark and approached the March bottom in the market at a bit under 2,200.
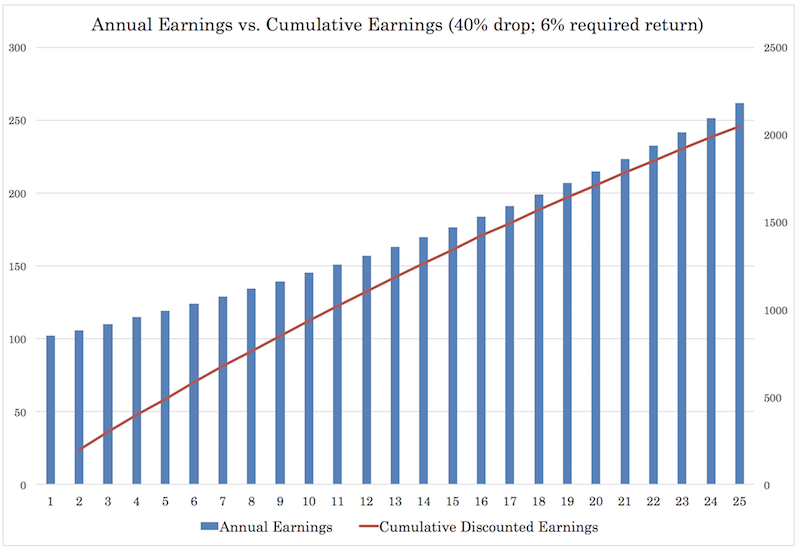
The takeaway is that if you expect a big drop in earnings and those don’t recover right away – stocks are a bit frothy.
How to bet on stocks in a convex way
If you want to bet on stocks but are justifiably leery about their downside risks, there are always call options in lieu of cash equities.
One strategy is buying out-of-the-money (OTM) call options. If you get the move higher, you can make multiples of your initial investment. If you’re wrong, then you don’t lose much.
This type of trade structure is often called convex because of the asymmetrically favorable reward to risk.
Many traders will also liquidate options before they go in-the-money (ITM) to avoid losing the convexity of the trade. The more ITM an option gets, the more it begins to act like the underlying security.
Example
If SPX is trading at 2200, one could buy call options that are 10-20 percent OTM with a “reasonable” expiry. (You don’t want the maturity to be too short otherwise it’s a speculative trade. If it’s too far out, then your convexity is diminished, as it’s less responsive to price changes.) Three to six months out is generally a good range.
A reasonable maturity in this case might be 2500 calls. Whole numbers for options maturities tend to be more liquid and provide tighter spreads, reducing your trade costs.
Depending on the volatility, movement, and the speed of any price move, you could make many multiples of the premium you spent buying them.
If the index increases to 2500-2600, to keep that same level of convexity, you could then buy 3000 calls with a 3- to 6-month maturity. If the index breaches 3000, you could liquidate the 3000 calls and buy 3500s, and so on.
It’s a recent strategy we recently employed on ES (e-mini S&P 500 futures) to bet on upside movement in the stock market while protecting the downside due to greater than normal ongoing risks.
Options do nonetheless have a timing element associated with them, which adds a dimension of risk. For hedging purposes, this also causes them to underperform for long-term strategies.
Do the types of stocks or indexes you invest in matter?
As written in a different article, having a bunch of stocks in your portfolio doesn’t provide much diversification past a point.
For example, the math is such that if you have four equal-returning, equal-risk assets weighted equally in terms of position sizing, you will increase the reward-to-risk ratio of that portfolio by a factor of 2 (over holding just one asset). If you have nine truly differentiated returns streams, you increase the ratio by a factor of 3 (square root relationship). There are of course limits to this as there are only so many different asset classes and sources of truly differentiated investments available.
All assets have an environmental bias. Stocks represent individual companies, but they’re all largely driven by the same thing. They do best in a period when growth is above expectation and inflation is low to moderate, and worst during periods of recession.
The way the average investor can do well in the market is by having strategic diversification, whether it’s respect to how they design their stock portfolio or how they diversify among different asset classes more broadly.
The stocks or securities you invest in can matter a lot. But it’s hard to pick the winners and losers. The range of unknowns is large relative to the things that are known relative to what’s discounted in the price.
For example, it’s well-known that Liverpool and Manchester City are better soccer/football teams than Newcastle and West Ham, but that’s already reflected within their prices on the betting markets. That information is not a unique insight looking at their odds in the betting futures markets and within individual betting matchups.
On an expected value basis – i.e., the probability of being right multiplied by the reward of being right minus the probability of being wrong multiplied by the punishment of being wrong – bets on each come out about even.
In other words, because the current price of something reflects everything that is currently known among the pool of investors in the market, your starting point is that most everything is about as equally good or bad of a bet in terms of return relative to its risk.
This is not an argument for the “efficient market hypothesis”. While markets may get out of whack for liquidity reasons, the general idea is that it’s not at all easy to spot a mis-pricing in the market. If it was, everybody would be a great trader. But adding alpha to the markets is a zero-sum game. In trading, we know a small percentage of the participants make most of the gains while the vast majority lose.
Ultimately it boils down to having an informational, analytical, and/or technological advantage, proper risk management, a repeatable process built around a deep understanding of cause-effect relationships and what’s true to add value to the market over the long-run.
That’s hard for most to do, so the difference between investing in “value” or “growth”, “large cap” or “small cap”, and so on, is not much.
Recently, some have looked at tech’s outperformance versus SPX for the year (around 13 to 14 percent) and wondered whether tech is simply more immune to big economic setbacks, better as a whole to invest in, or even a “safe haven”.
If we look at the correlation between the SPY (ETF representing the S&P 500) and QQQ (ETF representing the NASDAQ), the long-run correlation has been +0.82. There’s not much difference over the long-run.
If we look at a rolling 12-mo correlation of SPY and QQQ, it broke down a bit in 2017.
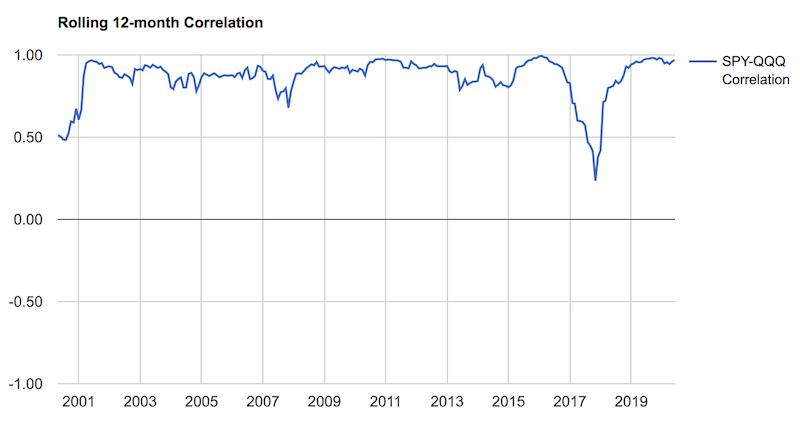
(Source: Portfolio Visualizer)
Bond yields were pushed up after Trump’s election based on expectations of less regulation and lower individual and corporate tax rates, which would boost growth a bit and increase nominal yields (good for stocks, bad for bonds).
This was a little bit of a headwind to value (spread between borrowing rate/cost of capital and ROIC is smaller), but wasn’t that important for tech/growth where the discounted expectations are based on a longer time horizon. SPY was up some 21 percent that year, QQQ 32-33 percent.
But the correlation is relatively tight over time. The difference in a portfolio between dedicating one’s stock allocation to one or the other or by combining the two in some combination for diversification purposes isn’t much.
If we want to look at a more granular level with a rolling 20-day correlation of SPY and QQQ to capture the day to day blips that most investors overemphasize, it still doesn’t make much difference.
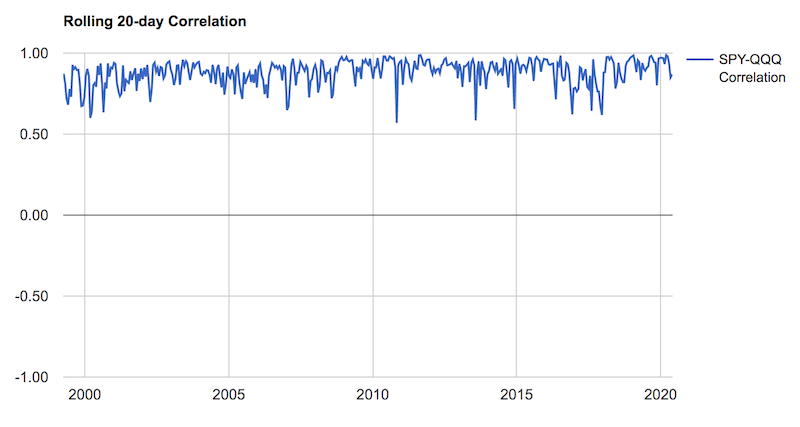
What the correlation coefficient (or percentage) is isn’t important, as these correlations aren’t stable over time. Therefore, they aren’t of use during the asset weighting process in portfolio design. The general idea is that stocks tend to do well in a particular environment (positive, steady growth) and poorly in others (when growth falls relative to expectation). This makes them relatively similar at a macro level.
Final Thoughts
Those betting on stocks should remain well-diversified throughout their portfolio or could consider turning their bets into convex trade structures that keeps the upside while limiting the downside.
There’s a lot of money coming into financial markets because the Federal Reserve and other central banks that have latitude in what they can do to save their economies. Emerging market central banks largely are more limited because there’s a lack of demand for their currency globally.
Many companies are too expensive relative to the level of earnings they generate or are likely to generate on a discounted basis. Most assets are currently overvalued.
I think more managers will be pressured into pushing more into private markets (e.g., venture capital, private equity, real estate, specialty lending) and alternative non-traditional assets (e.g., timberland, farm land, precious metals, rare-earth elements) where there’s more differentiation and unique opportunities.
The investment management business is no longer that different from other kinds of businesses. And other types of businesses can no longer be distinguished from the investment management business. Formerly, investment managers specialized in something, like equities or fixed income.
While specialization will always be around in some form, the landscape is shifting toward those who can engineer efficient portfolios. In general, we are increasingly in a period where the idea is to make money regardless of where the source of return comes from.
Those who can construct the best portfolios are best suited to maximizing their return relative to their risk and coming out ahead of other managers. Those portfolios can include standard forms of securities like stocks and bonds, and lots of other forms of instruments like securitized assets, derivatives, stakes in private businesses, and so on. We are in a period in which a sophisticated understanding of financial engineering is important.
Cash is no longer much of an investment in any of the main reserve currencies with zero or negative interest rates. The same is now also true for bonds. They are now closer to a funding vehicle than an investment with positive real return properties (and in some cases, don’t provide even positive nominal returns). Outside the general prudence of having a liquidity buffer, diversification, and their role in having a better balanced portfolio, cash and bonds are not what they used to be.