What To Do About Zero Percent Bond Yields?


This article was published on August 4, 2020
If you’re a saver or a bond investor, the new reality is that bonds in nearly all developed markets yield around zero percent.
They yield a little bit more than zero (but not much) in some developed countries depending on their duration (e.g., US, Australia).
But they are zero (e.g., Japan, UK) or negative (e.g., Germany, Switzerland) everywhere else.
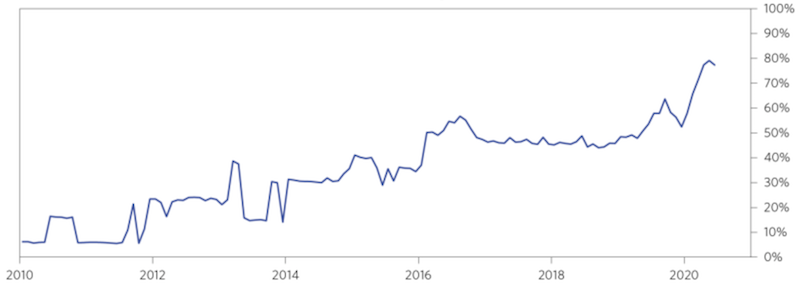
Eighty percent of all local currency government debt yields less than 1 percent globally.
Percent of global nominal bonds yielding less than 1 percent
Traditionally, savers are used to making money on their cash through interest on bank deposits, putting it in short-term debt, or certificates of deposit. That’s all but over in both nominal and real terms.
Likewise, bond investors are used to making money through positive yields and coupon payments at regular, predictable intervals. A bond is simply a promise to deliver money over time.
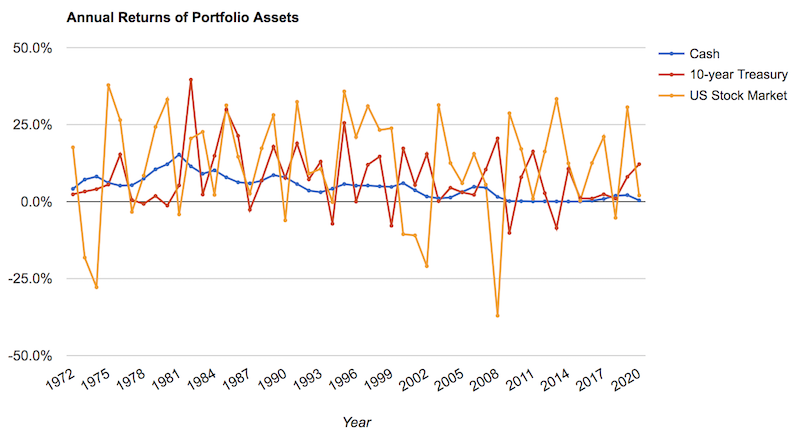
Since 1972, US investors have gotten about 4.7 percent annualized return on their cash savings. In real terms, that’s positive, as inflation in the US has averaged around 4 percent annually. The high inflation of the 1970s and early 1980s skews the average higher (it’s averaged around two percent over the past 30 years).
Ten-year Treasury bonds have given a 7.25 percent annualized return, or a bit over 3 percent in real terms.
As this article is being written, 10-years yield about 0.5 percent. If inflation averages two percent, that means real return is around minus-1.5 percent.
That’s a 4.5-5 percent delta in real returns relative to (recent) historical norms. That’s a lot of yield to give up annually.
Stocks have averaged about a 10.4 percent return.
A portfolio that splits assets about equally between cash, bonds, and stocks has returned around 7.9 percent.
Annualized volatility of that portfolio has been about 38 percent of the stock market. Its maximum drawdown was just under 13 percent (compared to 51 percent for a stocks-only portfolio).
Because of the positive yields of cash and bonds and their lack of correlation to risk assets, this type of portfolio has provided more return per each unit of risk.
Cash’s value doesn’t move around much. Ten-year bonds move around a bit, but less than stocks.
Portfolio Allocations
| Asset Class | Allocation |
|---|---|
| Cash | 34.00% |
| 10-year US Treasuries | 33.00% |
| US Stock Market | 33.00% |
Portfolio Returns
| Portfolio | Initial Balance | Final Balance | CAGR | Stdev | Best Year | Worst Year | Max. Drawdown | Sharpe Ratio | ||
|---|---|---|---|---|---|---|---|---|---|---|
| Above | $10,000 | $394,094 | 7.86% | 5.86% | 23.72% | -5.08% | -12.62% | 0.54 |
Portfolio Assets
| Asset Class Name | CAGR | Stdev | Best Year | Worst Year | Max. Drawdown |
|---|
| Cash | 4.71% | 1.01% | 15.29% | 0.03% | 0.00% | |||
| 10-year Treasury | 7.25% | 8.04% | 39.57% | -10.17% | -15.76% | |||
| US Stock Market | 10.36% | 15.58% | 37.82% | -37.04% | -50.89% |
It should also be noted that the forward returns of stocks will not be anything like that 10 to 11 percent figure going forward.
That return figure had many things going for it that aren’t repeatable:
– A large interest rate tailwind (rates are now zero and will be pinned there for a very long time)
– Certain labor force trends (e.g., more women entering the labor force)
– Practices that have expanded corporate margins that have run their course (e.g., locating production where it’s most cost-efficient)
– Higher inflation
If the inflation is stripped out to yield real returns, stocks have returned about 7 percent due to higher productivity, larger labor force growth, margin expansion, and interest rate declines improving the present values of cash flows.
None of those four forces are much of a tailwind. Some are lower or likely to reverse. Asset values cannot outgrow their earnings over the long-run. Taking the US economy at large, with 1.5-2.0 percent long-run growth, and inflation expected to be target at around 2 percent, and no interest rate tailwind, you can expect equities to earn around that amount over the long-run as well.
When cash yields are zero and bonds yield around zero, that causes all sorts of market participants to go chasing after what does have a yield.
A lot of it ends up in the stock market. Though stocks don’t have an explicit yield, it’s not a mystery what they’re likely to yield, which is about the rate of economic growth. That’s what stocks are essentially a securitization of (i.e., future income).
If 10-year US Treasuries yield around 0.5 percent and the long-run risk premium of stocks over 10-years is about 3 percent, then 3.5 percent yields for stocks going forward (over many years, as stocks are volatile) probably won’t be far off.
When alternatives yield zero, that causes assets up the risk ladder to bend down to those kinds of yields as well. They too get bid up, reducing their future returns.
So while most investors and traders have grown accustomed to price-earnings (P/E) ratios in the 10x to 20x range during their lifetimes, those traditional markers of value don’t mean much currently.
If stocks yield 3.5 percent, the earnings ratio is simply the inverse of that – i.e., one divided by 3.5 percent expressed as a decimal, 1 / 0.035 = ~29x P/E.
If stocks continue to get bid up in excess of the rate at which earnings are growing, then the P/E ratio rises in a steepening, non-linear way.
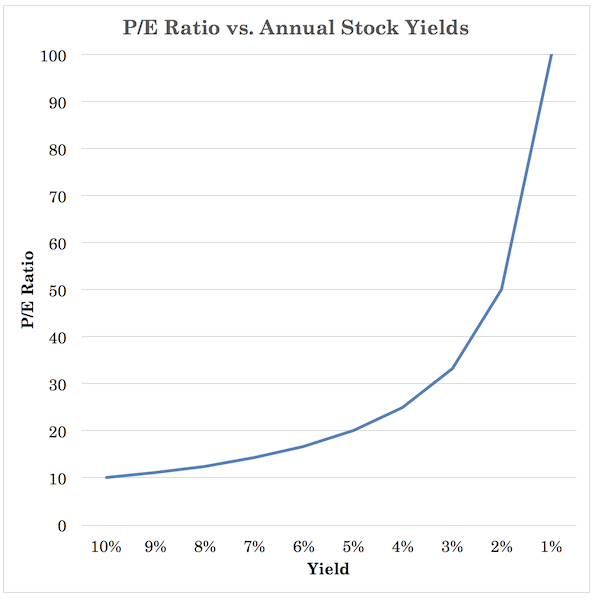
If stocks yield 10 percent going forward, the P/E ratio is 10x (1 / 0.10). Should yields go down to 9 percent, the P/E ratio goes up to just 11x (1 / 0.11).
However, if stocks go from a 3 percent yield to a 2 percent yield, the P/E ratio goes from 33x to 50x. And two percent forward yields aren’t out of the question during bubbles when they inflate index values (e.g., Japan 1989, US tech 1999-2000). Or in cases where cash and bonds yield nothing, or worse than nothing in the form of negative yields.
If bond yields were to fall down to minus-1 percent (they’ve come close in Switzerland and Germany), then two percent stock yields (i.e., 50x P/E ratio) aren’t that farfetched. It’s still a pretty standard three percent risk premium.
In relative terms that wouldn’t be that expensive. But it would certainly be expensive relative to the risk taken on to achieve such a modest yield. Long-only value investors don’t have a lot to get excited about in the public markets.
The reality of zero percent bond yields
Zero percent bond yields are a reality that has be dealt with in the best way possible like any reality.
There are four big influences and implications that zero percent bond yields have:
a) What it means for cash and bonds as individual asset classes
b) What it means for other asset classes because of the discount rate effect
c) What it means for diversification, correlation, and how to build a balanced portfolio
d) What it means for economies
Cash and bonds as an asset class
To understand risk and reward, you can plot out different realistic scenarios.
That can help you determine how good or how bad things can get. Better yet, if you can assign realistic probabilities to each scenario, that can help determine expected value and the quality of individual decisions.
If long-duration nominal bond yields in the US were to fall to zero, that would give you about a 7 percent annualized yield over the next three years.
If nominal bond yields were to rise to the long-term average real yield in the US using the current breakeven inflation rate, that would result in losses of about 19 percent annualized over the next three years.
Using those parameters, your reward to being long nominal US government bonds is only about one-third relative to your risk.
You can also expand those conditions.
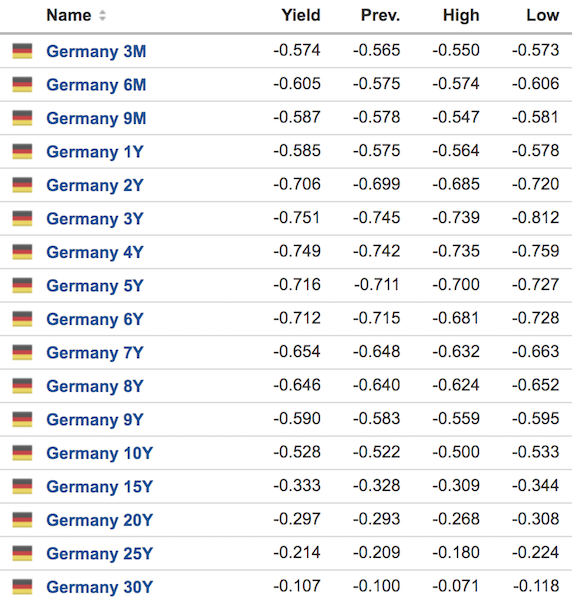
For example, US bond yields could go down to around minus-1 percent. This would be the lowest in the world, just under current German and Swiss yields, which hang around minus-50bps or a bit less.
Germany
Switzerland
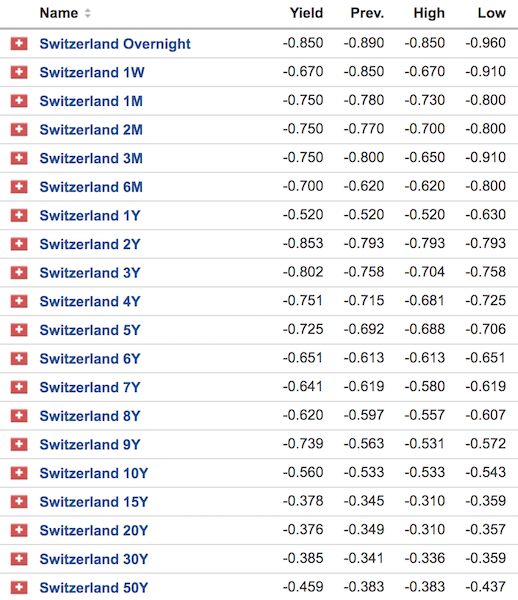
(Source: investing.com)
(Note that it’s unfair to compare bond yields in different currencies because of interest rate parity, as explained more in this article. Currencies with lower interest rates are expected to trade at a higher exchange rate in the future. To determine things apples to apples, they would technically have to be put into constant currency terms. But in local currency terms, it’s accurate to say that German and Swiss yields are lower than those of the US.)
After a point, it’s hard to go too much more into negative territory on bond yields as it’ll lead to cash hoarding.
Policymakers are also reluctant to engineer yields that low because of what it means for bank profitability.
The willingness to lend dries up if there isn’t a positive spread between borrowing and lending rates. (This is part of why an inverted yield curve is often considered a “recession signal”.)
There are a mix of potential results in terms of economic outcomes, how policymakers choose to respond, and how that impacts investor preferences.
Nonetheless, if you use minus-1 percent yields as the best case for bonds in terms of what that would do to positive price moves, that would cause bonds to yield around +17 percent over the next three years annualized.
If we expand out the “bear case” to mean a yield that emulates the long-term real yield plus a breakeven inflation rate of four percent, that gives an annualized yield of minus-31 percent. This is unlikely, but it’s a matter of the probabilities.
Comparing these two bull and bear cases, it gives 2x more downside than upside for bond bulls.
With bond yields so low, you can still make money if the deflationary elements win out. But the risk/reward is out of whack.
The discount rate effect on other assets
With yields at zero, you lose the ability for the discount rate to fall to any appreciable extent. Accordingly, lost is the capability to cushion against a decline in the cash flows of other assets (i.e., to support asset prices).
Traditionally, when cash and bond yields were positive and the economy entered a contraction, cash flows would fall, but the central banks would step in by pushing interest rates down and lift asset prices back up.
It also means historical returns driven by the 15-20 percent declines in yields is also gone, as can be viewed in the chart below (Q2 1981 peak). Investors that have enjoyed that effect over the past 40 years no longer have that going for them.
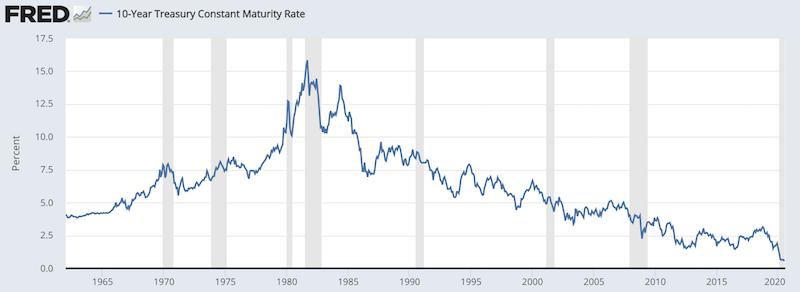
(Source: Board of Governors of the Federal Reserve System (US))
Diversification and balance
Over the past 40 years, when cash flows fall during recession and stocks lose value, bonds can provide an offset as yields fall.
So a balanced portfolio of stocks and bonds has done very well over this timeframe. Even a 60/40 portfolio has done well, though the balance is out of whack with stocks being more volatile than bonds (making it really an 88/12 type of portfolio weighting it by risk).
| Portfolio | Initial Balance | Final Balance | CAGR | Stdev | Best Year | Worst Year | Max. Drawdown | Sharpe Ratio | ||
|---|---|---|---|---|---|---|---|---|---|---|
| US 60/40 | $10,000 | $864,950 | 9.61% | 9.94% | 31.69% | -15.07% | -28.54% | 0.51 |
US 60/40 Annual Returns
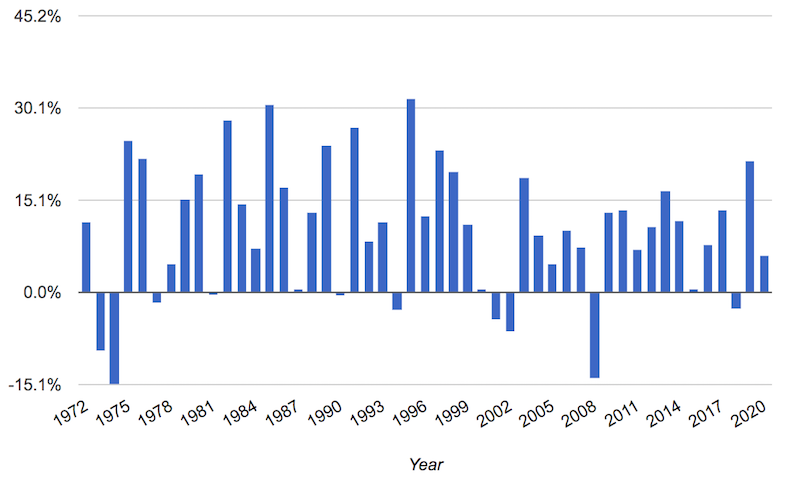
The rally in bonds can no longer cushion much of a fall in equities during big drops in economic activity.
Zero yields and their impact on economies
In previous downturns, central banks would cut short-term interest rates by around 500bps on average. This lowered borrowing costs throughout the economy, lowered nominal interest rates below nominal growth rates, and got the economy growing again.
When they ran out of room on short-term rates because they hit zero percent or a bit below, they would buy longer-duration assets (mostly their own sovereign bonds) to get longer-term rates lower.
That has also been depleted, so the two main forms of monetary policy are no longer effective in almost all of the developed world.
That means the policy response is no longer strictly the interest rate channel or the credit channel, but on to a type of joint fiscal and monetary policy coordination.
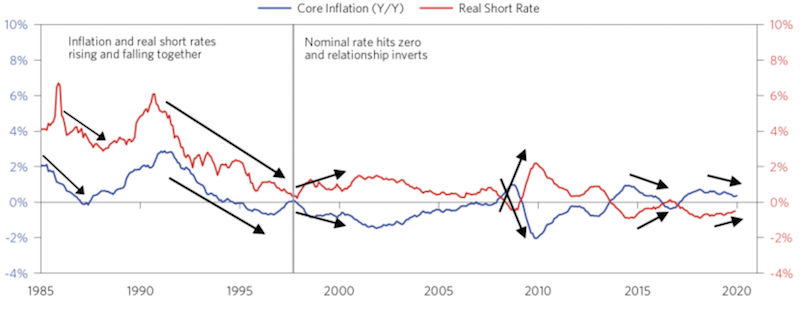
The zero rate “lower bound” also creates a linkage between inflation and real yields. The nominal yield (i.e., as in the interest rate on a bond) is equal to the real yield plus inflation.
Y = R + i
Where:
Y = nominal yield
R = real yield
i = inflation
If Y is anchored at zero, then if inflation decreases during a downturn, then real yields get pushed up while the economy is contracting.
This is bad because it hampers the economy. The discount rate on cash flows is higher as cash flows fall, which reduces asset prices. (The financial economy feeds in the money and credit to create goods and services in the real economy.)
And unlike nominal yields, which are more or less capped out somewhere below zero, there is no fundamental lower limit to either real yields or breakeven inflation.
Inflation can pick up in the real economy while nominal bond yields can still stay relatively put (if they’re being bought at an appropriate level), leading real yields to fall.
Japan has experienced the issue of inflation falling while at the zero lower bound. This caused real interest rates to go higher per the relationship shown above. This produced a tightening in conditions while the economy was already weak. Its economic growth has languished ever since the popping of its bubble in late-1989.
Previously inflation and real rates rose and fell together. Since hitting zero percent, they’ve inverted.
Japan
Putting it all together
Piecing all of these factors together, this has had a large impact on shaping the investing climate going forward.
Overall, it’s probably the most important factor driving markets today. (Interest rates are the bedrock of all financial asset classes.)
Some of the best rallies in bonds have been from going from the 3 percent levels we saw as recently as 2018 to today’s level of practically zero.
Bonds provided a highly useful offset to adverse moves in stocks portfolios.
Now that’s changing and bonds don’t look as good when they’re practically useless for income generation purposes and have a finite amount of room to go when nominal yields can’t be lowered much more.
While there’s still some level of diversification advantage to owning a little bit of cash and nominal bonds, the allocation (with where things are now relative to where they were) should realistically come down.
What also makes this scenario unique is that short-term interest rates are not only zero, but it’s during a period where long-term interest rates are very close to zero as well.
In the graph below, the blue line represents the spread (left axis); the red line represents the nominal level of the 10-year bond (right axis).
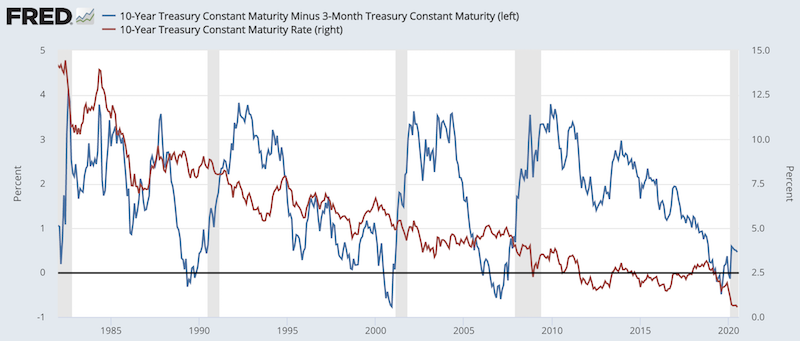
(Sources: Board of Governors, St. Louis Fed)
Even though we saw zero interest rates in the 1930s and again in 2008, we still had a 10-year bond rate of 3-4 percent in each case.
If short-term rates are zero and longer-term rates are three percent, your spread is still a positive +3 percent where that spread can be captured.
That’s really what the equation boils down to. Cash rates might be zero, but as long as you have positive spreads elsewhere, it’s not a problem in terms of traditional investing.
For example, if cash yields zero and stocks yield five percent, then it’s not much different than borrowing cash at five percent and investing it at ten percent. The spread is the same in each case.
Now we’re at a point where cash rates are zero and the yield curve is quite flat. Stocks don’t yield much more relative to the risk.
If the bond yield becomes negative, then there’s an arbitrage back to cash (i.e., “hoarding”).
That’s also bad for the economy because cash is traditionally taken by those with productive uses for it who turn it into goods and services that people use to make their lives better, pay worker salaries, and so forth.
So, in terms of the diversification aspect and in terms of how to build balance, you can do more with bonds when they yield positively and you have a steeper yield curve.
When both of those elements are gone, you have a more limited need for bonds.
And that’s why there’s an important need to broach conversations as it pertains to bonds and their value in a portfolio.
Each person’s situation is different. It doesn’t necessarily mean the right tactic would be to “get of bonds entirely” or “get out of bonds if yields go lower”.
But it’s important to develop a strategy or plan that fits the needs of what one is trying to achieve.
Real vs. nominal returns
Asset prices in each asset class reflect expectations of very low real returns (i.e., inflation-adjusted returns) over a very long time.
That doesn’t necessarily mean that high nominal returns will be out of the question. To get asset prices to deliver on their forward expectations that have been discounted in, you will need a higher level of nominal GDP or they’ll eventually have to re-rate downward if nominal GDP remains low.
In other words, the economy will either need to “catch up” to asset prices, or asset prices will need to “catch down” to the economy.
Since you’re not likely to get much in the way of higher real GDP – i.e., a mechanical function of productivity growth and growth in the labor force – higher nominal GDP is likely going to have to come in the form of higher inflation. (Nominal GDP is the sum of real GDP plus inflation.)
And getting that outcome is highly uncertain given the deflationary forces are numerous (e.g., high debt, aging demographics, offshoring production, technology advances increasing price transparency across the economy).
Even though it’s not an official policy in the US, nominal bond yields are likely to stay around zero.
Other countries, like Japan, use yield curve control (YCC) as an official policy measure to step into bond markets when its 10-year bond goes much higher or lower than zero percent. In other words, it control two points of its yield curve, short-term cash rates (as is the standard) and a longer-term sovereign yield that serves as a common lending benchmark throughout the economy.
What are analogous periods to the one we’re in now?
It helps to study history to know how things have happened in the past and how they might apply in the future by focusing on the cause-and-effect relationships.
The 1940s are analogous to the period we’re currently in, in terms of nominal yields being relatively fixated.
There could be a form of yield curve control (also known as yield curve caps) in the US. This occurred during the 1942 to 1947 period to help fund World War II and avoid a significant bloat in debt servicing.
Back then, like now, the adjustment of interest rates didn’t work to help the economy, either with respect to short-term interest rates or long-term rates.
So, the fiscal arm of the government had to step in and spend what it needed to, with the monetary arm effectively monetizing that spending.
Because nominal yields were anchored back then, you had a big move in real yields.
There weren’t inflation-indexed bonds back then, per se, but you would have seen large movements in real interest rates due to an explicit fixing of nominal yields.
Relative value trade opportunity
Given the pinning of nominal yields around zero (in a de facto sense) and likely larger than normal moves in real yields, one could develop a trade idea out of this.
Namely, one could be short nominal bond volatility and long inflation-index bond volatility.
To short volatility, one could sell a straddle (i.e., short a call and short a put at roughly equal expiries) on the relevant underlying product(s). For example, options on US Treasuries futures could be one such product.
To go long volatility, one could buy a straddle (i.e., buy a call and buy a put at roughly equal expiries) on the relevant underlying product(s). For example, options on Treasury Inflation Protected Securities (TIPS) ETFs could make sense. (TIPS don’t have a futures market.)
Nothing should be taken as explicit “advice” as things are always changing. But this is something we’re currently doing in our portfolio as a relative value trade to give an idea of turning “theory” and observations into practical application.
Today’s policy mix
Though this policy mix of zero short-term rates zero/close to zero long-term rates is unusual, it’s happened in other periods. It’s also been the norm in Japan for decades at this point.
Recently, we’ve seen real yields make new all-time lows in the US while nominal yields have remained stuck.
That’s a function of the current fiscal policy measures starting to take effect. More of it could lead to an even larger move that feeds into our trade idea above.
Cash flow focused equity investing
In previous articles we’ve covered how investing, and predicting the next market moves for traders and market timers, is moving more into what you’d call a “store of wealth” perspective.
In other environments – for example, if the central bank is tightening – then the focus is mainly thinking about what are the most interest-sensitive financial assets and having certain strategies.
For example, in a classic monetary tightening that we saw in 2018, this could mean moving out of longer duration assets (that will get hit by tighter monetary policy) and moving into shorter duration assets that will be less affected.
Now, with zero interest rates and that previous type of thinking changing with regard to relative sensitivity to nominal interest rates, it’s shifting more into what are good stores of wealth.
You know companies that provide the basic goods that are necessary to physically live – e.g., food, beverage, basic medicine – are probably going to grow their earnings on aggregate over the long-term.
Something like a movie theater chain or a cruise ship operator is more economically sensitive. Those types of businesses are of lower quality as stores of wealth. People don’t physically have to go to the movies or take cruise ship vacations.
Cash flow driver + discount rate driver
With a financial asset like a stock, in terms of fundamental valuation concerns, there are two main drivers:
i) Cash flow
ii) Discount rate
So, what drives the company’s earnings and how is it affected by movements in the discount rate (which affects its cost of capital)?
Thinking of it in those terms, it opens up a new avenue for portfolio structuring.
You can think of consumer staples as a type of bond alternative that can hold up well in any environment, from deflationary recession to stagflation.
Because these are still equities, and their prices are a function of discounting a theoretically perpetual stream of cash flows (giving the assets a long duration), you’ll still have structurally higher volatility than most forms of bonds, which have a fixed expiration date.
But their earnings are likely to grow in a relatively consistent manner over time. They won’t be as economically sensitive.
Offsetting cash flows
Another factor is offsetting cash flows.
In other words, can you find different assets whose cash flows offset each other?
For example, for a pure-play oil producer, it makes money when it sells the oil that it takes out of the ground. If the price of oil contracts in a big way, then that’s bad for the company’s cash flow.
However, that can benefit other companies who buy oil, have relatively fixed needs of it, and accordingly see their cash flows rise when oil prices drop.
This could include trucking companies, airlines, or even air medical transport companies.
Longer term influences
Over the long-run, the cash flows matter most. The discount rate is an important factor in the short- and medium-term.
Stocks don’t move around a lot on a daily, weekly, monthly, or yearly level because the cash flows changed all that much.
When US stocks rose about 30 percent in 2019, it wasn’t because the economy grew by 30 percent.
It was largely a function of the discount rate with the Federal Reserve and other developed market central banks moving from a tightening in monetary policy (which had caused asset prices to decline in the latter half of 2018) to an easing in monetary policy.
For the concerns of a longer term investor, you can think of stable cash flow producing companies, or perhaps companies whose cash flows may offset each other to have well-rounded diversification, as a way to structure a portfolio that’s likely to grow its earnings over the long-run regardless of the economic environment.
With the movement in the discount rate over time, you’ll still have the volatility. But over a long enough holding period you know that’s likely going to net out.
Accordingly, you’ll have a portfolio that’s quite likely to be higher over time even in an environment where forward returns are low across the board as they are now.
Cyclicality vs. Non-cyclicality
To structure this type of portfolio, it’s useful to think in terms of what has cyclical exposure and what doesn’t.
For example, real estate is highly cyclical. Some think of real estate as something that will always have demand and it may be less sensitive to the economy.
But real estate is typically purchased with a lot of debt given the sheer cost of some projects and because it’s simply advisable not to outlay large amounts of cash in many circumstances.
That makes it more sensitive than normal to movements in interest rates.
Also, the use of land and property often changes over time. For example, malls 20 to 30 years ago may have been thought of quality stores of wealth as financial investments because people needed to physically be somewhere to buy things.
Now, e-commerce is gaining traction and malls are seeing fewer sales on a relative percentage basis. That will grow as time goes on. Many businesses are going exclusively online.
On the other hand, a piece of real estate outfitted as an e-commerce distribution center near a large population center could be something closer to a quality store of wealth or a growth asset over time.
What types of spending will occur in any environment in any country?
You can identify what kinds of spending practically need to occur and what kind of companies and assets that spending will benefit.
In the personal consumption expenditures (released by the Bureau of Economic Analysis (BEA) in the US), there are dozens of different spending categories and nitty-gritty sub-categories that one can browse.
You can also look across countries.
If you can identify types of spending that are going to occur regardless, you don’t have to worry as much about relying on an offset from the discount rate (which, as covered above, is out of gas and doesn’t work in the normal ways).
For example, autos are highly economically sensitive. When that type of spending declines, they need an offset in the discount rate to bring their share price back into equilibrium.
If spending on food is going to stay steady or increase throughout bad economic times, then you don’t need to rely on that discount rate offset and you have a safer portfolio.
That’s one way of engineering a portfolio to better deal with the new reality of zero percent bond yields and cash yields that can’t be pushed down much further.
Geographic diversification
Traders and investors tend to prefer their own domestic stock markets. They are typically heavily in one currency, in one asset class, and in one direction (long).
Since the beginning of the 21st century, geographic diversification hasn’t been super important because most geographies have been highly correlated.
This is because capital flows have been heavily free and unencumbered; trade has been globalized; production has gone to wherever it’s been most efficient to locate it for the most part, and similar trends.
Going forward, you’re likely to see higher levels of differentiation across countries.
Correlations are likely to fall with trends such as more trade independence, potential capital flow disruptions, separate technological developments, and the general burgeoning competition between the US and China as the two main powers who will inevitably continue to butt up against each other as part of a broader power struggle.
So, the odds of a lot of zero-sum competition and there being “winners” and “losers” in this type of conflict is higher.
When thinking about how to balance a portfolio, you don’t want to bet too much in terms of trying to choose the winner.
Broadly speaking, as we wrote up in a different article, you have three main global spheres:
i) You have the developed markets with their very low forward real returns (US, EU, and Japan)
ii) You have China, which has its own monetary and credit system
iii) And you have the cyclical emerging markets
At this point, because of the conflict between the US and China that’s playing out in classical ways (i.e., trade, then capital, then geopolitical in most other ways), you probably don’t want to bet too much on any given market.
Getting balance among different monetary and credit systems and different risk premiums is important in having balance going forward.
For example, zero percent bond yields might be true in the developed world, but 2-5 percent bond yields are still available in many emerging market countries, including China.
Getting access to those risk premiums, different geographies, and different currencies is a source of yield, diversification, and balance.
And because geographic diversification hasn’t been that important for the past 20+ years because of the trends that have increased correlation (and are likely to recede to a degree), its importance isn’t high on most investor’s priorities.
Trade wars, capital wars… even worse?
Though the “trade war” headlines aren’t what they were in 2017 and 2018, when they were a material influence on price movements, the US-China conflict will be top of mind for many market participants looking forward.
In markets, the range of unknowns is always greater than the range of knowns relative to what’s discounted into markets.
Nobody knows yet how the US-China conflict will play out.
The trade wars and capital wars that began the 1930s ended up devolving into a hot war toward the end of it and into the next decade.
The US-Soviet Union conflict ended without that. Though the US challenged communist interests overseas in two major wars in Korea and Vietnam, the Soviet empire eventually collapsed due to the inefficiency of its system.
Despite the Soviets having equivalent nuclear capacity to the US, it was never much of a challenger economically.
With China, the situation is different. While their economic system is different from the US, it’s not like old-school Chinese communism. It’s a type of top-down capitalist system.
China has the population and the productivity potential to supplant the US as the world’s top economy eventually. China is still playing catch up. US GDP per capita is around $65,000; China’s is about $10,000. Eventually they will be closer in line and it’s not going to come in the form of US incomes going down.
Regarding both the US and China, there’s a move from interdependence to independence between the two. This will be true regardless of the US political situation. It’s a real competition, not a partisan-driven goose chase.
It’s too close to call who will end up the “winner” (i.e., economically, militarily, geopolitical influence, reserve currency, technological supremacy) by, for example, mid-century.
In some respects, China might be better off; in other respects, the US might be better off.
We don’t know what that outcome is going to be, which adds to the importance of being neutral and not having heavy exposure to it from an economic perspective.
Plus, having some exposure to emerging Asia is of interest to developed market investors given the situations in their own countries – e.g., high debt, high internal conflict, high international conflict, and general difficult situations to have high levels of real returns.
When your starting point is that you “don’t know” you probably want to balance out your risks.
This goes for any portfolio. The discounted expectations are already baked into all asset prices and picking the winners and losers relative to that is not easy to do when so much is unknown relative to what’s known. Having diversification is the easiest thing one can do to improve return per each unit of risk.