How to Predict the Housing Market


Real estate is usually the largest single asset that most people will purchase during their lifetimes.
It’s also a huge asset class. In the US alone, residential real estate is nearly a $40 trillion asset class (about $120,000 per person).
So there’s a lot of interest in being able to develop a view of how to predict the housing market.
Over the long-run, residential housing approximates the rate of inflation. But because of the leverage in the sector, there are swings around it. Sometimes the rate of return can be much better and sometimes much worse.
Inflation (red) vs. Case-Shiller US National Home Price Index (blue)
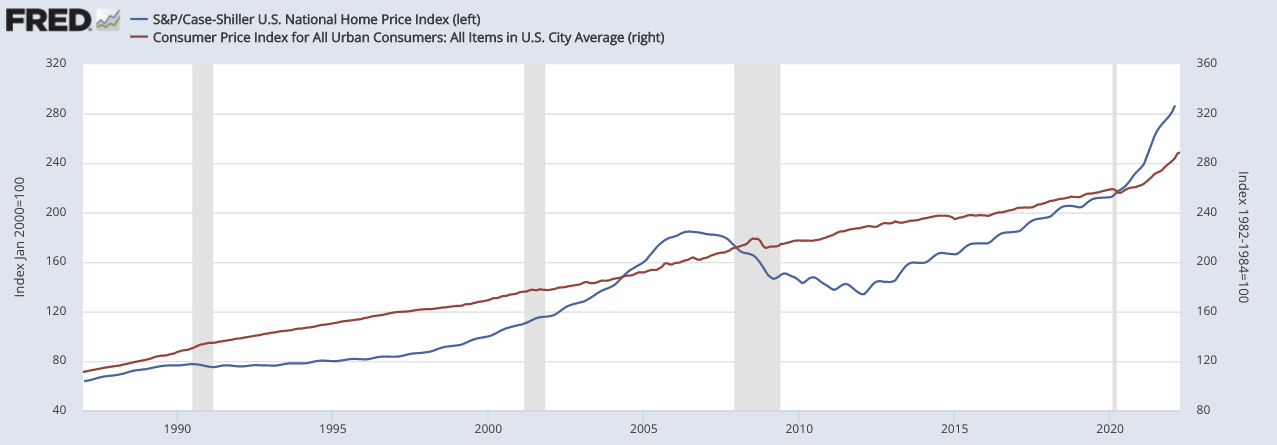
(Sources: S&P Dow Jones Indices LLC; US Bureau of Labor Statistics)
In all markets, there are lagging indicators and leading indicators.
Lagging indicators include:
- Employment / Unemployment Rate
- Home Prices Index
- Corporate Profits and
- Labor Cost per Unit of Output
- New Home Sales
- Existing Home Sales
Leading indicators includes:
- Mortgage Rates
- Building Permits
- Housing Starts
- Stock Indices (e.g., XHB homebuilders ETF)
- Lot Sales
- Builders’ Confidence
- National Association of Home Builders – Prospective Buyer Traffic
Let’s look at them one by one.
Lagging indicators
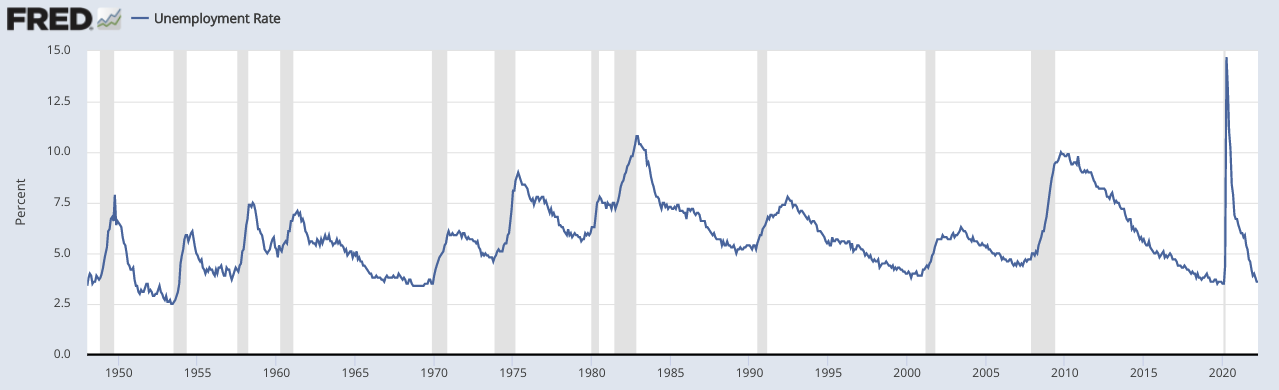
Employment
The unemployment rate is a lagging indicator that is closely watched by analysts. A low unemployment rate indicates that there are more people with money to spend, which in turn boosts demand for housing.
However, in a normal recession, its credit that falls first, followed by a cutback in the labor supply.
Notice how unemployment rates tend to peak during the early part of expansions, not at the onset of a recession.
Home prices index
Home prices index (HPI) measures changes in home prices across a geographical region or market.
HPI, however, reflects what has already happened in the past.
Corporate profits
Corporate profits are a broad measure of the profitability of businesses in an economy.
It is closely watched by real estate analysts as it is an indicator of business activity and demand for office and commercial space.
A decline in corporate profits usually leads to a decrease in demand for office and commercial space, which then affects the prices of these properties.
However, corporate profits are released with a lag.
For example, if a company is reporting earnings in late April, it was for the January to March period.
Labor cost per unit of output
Labor cost per unit of output is a measure of how much businesses are spending on labor relative to the output they produce.
Analysts look at it to indicate how much businesses are willing to expand their operations.
If labor costs are rising faster than output, it can signal that businesses are cutting back on expansion plans, which can lead to a decrease in demand for commercial and office space.
But labor, as mentioned, is commonly a lagging indicator. It is one of the last things to go. Labor markets are typically quite tight at the onset of recessions.
New home sales
New home sales is the number of newly constructed homes sold and closed during a given period.
This is one of the most closely watched real estate indicators because it is an indicator of demand for housing (and consequently prices).
Some would argue that new home sales is more of a leading indicator.
They might say it reflects future demand for housing and can signal how strong the market will be in the months ahead.
However, new home sales reflects sales that have already been completed. It does not predict future sales as well as true leading indicators.
Existing home sales
Existing home sales reflect closings, with contracts typically signed a month or two earlier.
So, for example, May existing home sales figures reflect deals signed in April or March.
Leading indicators
Mortgage Rates
Mortgage rates are one of the most important leading indicators in real estate. Because houses are so expensive – usually several multiples of one’s annual income – the majority of a house is usually bought on credit.
Mortgage rates in the US are heavily determined by the yield on US Treasury bonds. The 10-year in one of the most well-tracked rate benchmarks in the world.
Inflation factors into mortgage rates. Higher inflation and inflation expectations means higher mortgage rates, holding all else equal.
The demand for mortgages is to get a mortgage is another important factor.
Higher demand for mortgages will cause rates to go up.
Conversely, when there’s less demand to get a mortgage, fewer people are buying homes and this puts downward pressure on prices.
So how do you think about mortgage rates in the context of trying to predict the housing market?
It’s like any other asset class. Holding all else equal, lower mortgage rates mean higher prices while higher mortgage rates mean lower prices.
Building permits
Building permits is a popular leading indicator for the housing market.
It is a measure of how many new homes are being built and can signal how strong future demand for housing will be.
Housing starts
Macroeconomic data on housing starts can give you some idea of where the market is going.
Housing starts is a measure of how many new homes are being built.
It is closely watched by analysts because it can signal how much future demand for housing there will be.
Stock indices
Stock indices, such as the XHB homebuilders ETF, are also closely watched by analysts.
They provide a broad view of how the stock market is performing overall and within certain sectors. It can give a forward-looking indication of how confident traders, investors, and other market participants are in the economy.
If the stock prices of homebuilders are falling, it can signal that investors are becoming less confident in that sector of the economy and are cutting back on their investment in the housing market.
Lot sales
Lot sales is not something in which there’s popular existing macroeconomic data.
But lot sales can tell you something about a market because they represent land to be built on in the future.
Therefore, lots are a forward-looking thing that can give you insight on what developers think about a certain area.
If lot sales slow, you can probably expect the rest of the market to start slowing as well.
Builders’ confidence
Builders’ confidence is another important factor to consider.
The National Association of Home Builders’ Housing Market Index is a good measure of builder confidence.
If builders are confident, they’re more likely to start new projects.
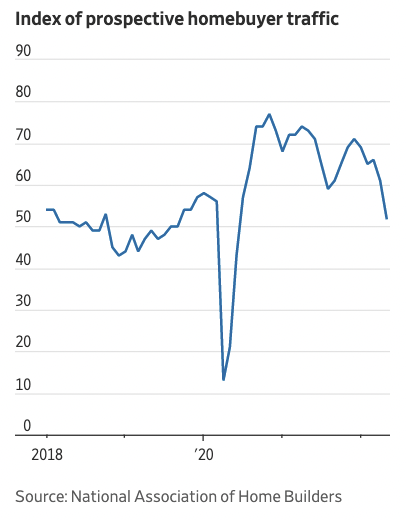
National Association of Home Builders – Prospective Buyer Traffic
The NAHB prospective buyer traffic is a measure of demand based on survey’s of homebuilders.
The index is a seasonally adjusted, weighted average of single-family builder responses to four key questions: traffic of prospective buyers, foot traffic of prospective buyers, internet lead traffic and sales contracts signed.
In order to be included in the NAHB prospective buyer traffic index, builders must be members of the National Association of Home Builders. The data is released on a monthly basis.
When it falls, there is less interest in buying and vice versa.
Home Pricing Factors
There are a variety of factors that can lead to fluctuations in home prices.
Supply and Demand
The fundamental drivers of housing prices are supply and demand.
When demand exceeds supply, prices generally rise; conversely, when supply outpaces demand, prices typically fall.
The balance between supply and demand is influenced by various factors, such as population growth, migration, and economic conditions.
Market cycles
The housing market, like any other market, goes through cycles of growth and contraction.
During periods of economic expansion, home prices may rise due to increased demand, while during economic contractions or recessions, demand may decrease, leading to falling home prices.
Liquidity
The housing market is characterized by a lack of liquidity.
This means that homes are not bought and sold as frequently as other financial assets, like stocks or bonds.
This can lead to a situation where buyers and sellers have difficulty agreeing on a fair price, causing transaction volumes to fall.
Sellers generally don’t like to take a hit if it means selling at a lower price relative to where they were at previous dates. So the incentivize is to not sell, leading to much lower activity where “bid” and “ask” prices don’t match.
Moreover, owners are reluctant to move if it means needing to take on a more expensive mortgage.
If there is a significant imbalance between buyers and sellers, this can cause home prices to fall as sellers may be forced to lower their asking prices to attract buyers or complete a sale.
The lack of liquidity can also lead to a more prolonged price adjustment process, as it might take longer for the market to reach a new equilibrium.
Interest Rates
Fluctuations in interest rates can have a significant impact on housing prices.
Lower interest rates make borrowing more affordable, thereby increasing demand for homes and pushing prices upward.
On the other hand, higher interest rates can reduce demand for homes, leading to a decrease in prices.
Economic Factors
The overall health of the economy plays a crucial role in housing prices.
A strong economy with robust job growth can increase demand for housing, while an economic downturn or high unemployment rates can lead to reduced demand and falling prices.
Government Policies
Fiscal and monetary policies can also affect housing prices.
Tax incentives, subsidies, and mortgage regulations can either encourage or discourage homebuyers, thereby impacting the market dynamics.
For instance, if the government tightens mortgage lending standards or raises interest rates, it can lead to decreased demand for homes, resulting in falling home prices.
Local Market Conditions
Housing markets are inherently local, and various factors can influence the desirability of a specific area.
These factors include the quality of local schools, infrastructure, and amenities, as well as crime rates and future development plans.
Events such as natural disasters, public health crises, or geopolitical events can impact the housing market and lead to a decline in home prices.
Speculation
Housing markets can also be influenced by speculative behavior, with investors buying and selling properties in anticipation of future price movements.
This can lead to price volatility and may contribute to housing bubbles and subsequent falls.
In Sum
Prices are influenced by a range of economic, local, and external factors, which can cause them to fluctuate over time. Moreover, the lack of liquidity in the market can contribute to transaction volume declines and price adjustments.
It can also vary heavily across markets.
For example, the US housing market is mostly comprised of longer-term, fixed-rate mortgages whereas other developed markets have a greater proportion of shorter-term, variable-rate mortgages.
As a result, in the US, the price adjustments are much slower.
For example, after the 2008 financial crisis, while most liquid markets bottomed by late-2008 and early-2009, the housing market didn’t bottom until 2012.
According to Goldman Sachs research, each 1 percent rise in mortgage rates leads to a 6 percent decline in residential fixed investment after 3-4 quarters and a 2.5 percent drop in house prices after 10 quarters.
The timing of the impact isn’t uniform across the world due to their differences, which can speed or slow the impact. Countries with higher shares of fixed-rate mortgages, for example, tend to experience delayed rate impacts.
Conclusion
In short, there’s no one perfect way to predict the future of the housing market.
But by considering a variety of factors, you can get a pretty good idea of where the market is headed.
There are a number of indicators that analysts watch when trying to predict the housing market.
Lagging indicators, such as employment and home prices index, can give an indication of how the market has been performing.
Leading indicators, such as mortgage rates and building permits, can signal how strong future demand for housing will be.
Interest rates play a big role in affordability as they flow into mortgage rates and can therefore affect demand.
Stock indices, such as the XHB homebuilders ETF, provide a broad view of how the stock market is performing and can give an indication of how confident traders and investors are in the economy.
By watching all of these indicators, analysts can get a good idea of how the housing market is performing and how it is likely to perform in the future.
However, no single indicator is perfect and there is always some level of unknown when predicting the market.