How Does the Stock Market Affect the Economy?


The stock market is an important part of the overall functioning of the economic system. The stock market – and capital markets more generally – affect the real economy as they provide the money and credit that the real economy uses to make goods and services.
The financial economy leads the real economy. The stock market discounts future expectations. Therefore, rising stock and capital markets have a feed-through effect into the real economy in a positive way while declining stock and capital markets have the opposite effect.
More money and credit produce rising net worths, incomes, and asset values. Companies then use this capital to make investments that produce more in return relative to the cost of the capital (e.g., cash, debt, equity).
When this is true, the upswing is positive. It perpetuates the process as borrowers become more creditworthy.
Creditworthiness relates to:
i) income and projected cash flow available to service debt and other obligations
ii) existing reserves/savings and net worth (assets minus liabilities) that can be used as available collateral
iii) one’s own capacity to lend capital (bank and non-bank institutions)
All of these factors rise together and are self-reinforcing.
Borrowers will feel wealthier even though inevitably a point is reached where the rises in debt and obligations do not rise at least as fast as the investments’ underlying cash flows.
This is where things can change from a healthy bull market to a bubble phase that can eventually endanger the real economy. All the while the bubble phase is going on, it’s typically confused with a productivity-driven boom.
While bubbles seem obvious in retrospect they are not always obvious when they’re occurring. They typically start as an extrapolation of the conditions that were previously sustainable.
For example, is Tesla a bubble?
Its proponents will tell you that electric vehicles are a big emerging technology, it’s a leader in that space, and the company will innovate new products and services that will enable it to justify and grow into that valuation (i.e., the underlying cash flows can support the valuation).
Others will tell you that as a smaller, capital-intensive car manufacturer, its valuation is way out of whack and that it loses money after accounting for ZEV credit sales.
High stock prices seem good. But when they’re unjustified – they don’t make economic earnings to validate those valuations – stock bubbles are like any other of indebtedness.
A bond or stock is a claim on somebody else’s income. In order to get the stream of income you expect from it, the entity (government or corporation) needs to produce those earnings. If that doesn’t transpire, then the asset value needs to come down. And in some cases it’s not really an asset at all.
Debt growth that exceeds income growth is a period that feels good, so people continue to buy assets at high prices on leverage. But it builds risk and sows the seeds of the next downturn.
For example, assume someone makes $50k per year.
Let’s say they could borrow up to $10k per year, which means they could spend $60k per year for several years even though their annual income is only $50k.
This increased capacity for borrowing allows for higher spending. One person’s spending is another person’s income.
A person’s spending can lead to higher income, higher asset valuations, and/or higher savings. Accordingly, this gives them even more collateral to borrow against.
This causes people to borrow more and more, and this process quickly begins to look like a cycle.
In the up part of the cycle, when people borrow, they’re not only borrowing from a lender, they’re borrowing from a point in the future in which they’ll need to pay back that money.
Eventually, borrowers have to spend less, invest less, and/or save less for themselves because that money has to be paid back to the creditor.
But so long as that borrowing helps produce economic growth, throws off more cash than the capital it consumes – more income in excess of the servicing – the debt is “good” as opposed to “bad”.
In the upswing in the debt cycle, obligations – i.e., debt and cash-flow driven liabilities, which are promises to deliver money – rise relative to the money supply, economic growth, and all forms of available liquidity to service the debt.
Debt servicing can come from incomes, new borrowing, savings/reserves, and asset sales.
Central banks will adjust short-term interest rates and/or long-term interest rates (through QE or reverse QE) to slow down or help pick up the rate of credit creation.
This is the regular business cycle that most of us are used to and experience multiple times over the course of our lifetimes.
During this time, inflationary pressures are generally picking up and nominal economic growth is right around its upper capacity.
This is generally a period that’s good for the economy. But it’s increasingly less good for the markets because policymakers have to think about tightening money and credit.
Rising cash rates and nominal bond rates compete with equities for capital at the same time liquidity is being pulled back. At a point, this hits stocks first and later the economy.
The three normal forces interlinking the real economy and financial economy
Normally, there are three big forces and equilibriums that drive the real economy and stock and capital markets.
Others forces are important as well, such as the political, geopolitical, and social and internal forces, but we won’t focus on those here.
But briefly, the “big three” linking the real economy and financial economy are:
i) Economic capacity utilization can be neither too high nor too low (i.e., the inflation and growth trade-off).
ii) Debt growth cannot exceed income growth.
iii) The yield of stocks must be greater than the yield on bonds, which must be greater than the yield on cash, and by the appropriate risk premiums.
Economic capacity
The economy is made up of three basic things:
- Labor
- Capital (money and credit), and
- Commodities and raw materials
When economic capacity is low, that means unemployment is generally high, money and credit isn’t getting to where it needs to go, and there’s an underutilization of commodities and raw materials that go into creating finished goods.
That means central banks have large incentives to ease monetary policy in some form to get them going again.
When the unemployment rate is low, asset markets are expensive relative to traditional measures or in a bubble, and the cost of commodities and raw materials is relatively high, then central banks are more likely to want to slow down the economy by tightening monetary policy.
Classically, asset prices fall before the economy, and the economy dips before the unemployment rate rises.
(In some cases, it’s different, like in the 2020 recession. Income literally just fell, so the dip in the economy and rise in unemployment happened at the same time. When a recession works through credit as it normally does, unemployment rises later.)
In the chart below, note the peaks in unemployment typically after the end of the recession (gray bars), but a peak at the very beginning of the 2020 recession. It’s a result of the difference between a drop in economic output working through a contraction in private sector credit creation versus what was a steep fall in income.
US Unemployment Rate
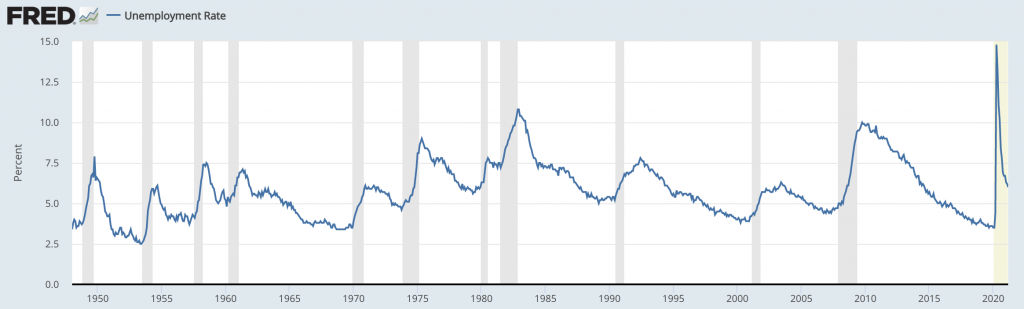
(Source: U.S. Bureau of Labor Statistics)
In terms of the recovery, markets bottom before the economy just like they top before the economy. This gap is generally 3-7 months.
For example, during the 2007-09 financial crisis, the markets bottomed in March 2009 while the economy bottomed around June 2009. (The National Bureau of Economic Research (NBER) officially denotes the start and end dates.)
Debt growth vs. Income growth
Debt growth cannot exceed income growth indefinitely. More precisely, debt servicing cannot indefinitely exceed the aggregate funds available (e.g., income, reserves/savings, new borrowing, asset sales) to pay it.
Normally, to fight a recession, the central bank lowers interest rates to change the incentives between borrowing and lending.
When do we know when this process is stretched? Namely, when do we know when we’re at a tipping point where debt growth is reaching its constraints?
When interest rates hit zero or a bit below.
Getting the lending-borrowing process into motion is difficult to do when the idea of negative interest comes into play. Lenders still need to make good loans where they need profit to work with. If they can’t lend profitably, they won’t do it, so the public sector must take over more of that role.
This has also been true historically. While some might not like increased government involvement in the role of the economy and the distribution of capital, this is simply the mechanics of it.
We are there in the developed world in both short-term and long-term interest rates.
Some countries are well into negative territory on most of their mid- and longer-duration issuance even after a moderate rise in yields (e.g., Germany, Switzerland).
They are approaching clearly defined limits in terms of how low nominal interest rates can go. Real interest rates are nonetheless a different story, as there’s no technical limit to how high inflation can go, and therefore no limit to how low negative real interest rates can get.
Sovereign bonds in developed markets have flipped from a traditional investment to a source of funding, as they destroy wealth in real terms.
People can go up the risk ladder to bonds of higher duration or into corporate credit and take on material credit risk, but bond investing is now quite difficult to generate real wealth in.
When we get to this point, monetary policy must be unified with fiscal policy.
In the financial media, this is sometimes promoted as “Modern Monetary Theory” (MMT). Though in terms of “modern” the situation that developed markets are in has happened many times over thousands of years.
Linkage between fiscal and monetary policies is how it’s worked throughout history when monetary policy ceases to be effective independently.
Fiscal authorities must target the money and monetary authorities must create the money. It is most effective when there are strong incentives to spend it, which is somebody else’s income, and getting that loop to feed on itself.
The general idea is that when private sector incentives cease working effectively, then the public sector takes more of a role in the distribution of capital in an economy. This might be called “state capitalism”.
It brings opportunity. But it also brings risk, especially when political polarity is historically high.
Ultimately it comes down to the quality of the decision-making as the running of the economy falls more on the burden of politicians.
Cash vs. Bonds vs. Stocks
A positive sloping capital market line is positive for the economy. It ensures risk and reward are in logical standing.
Return vs. Risk for Various Asset Classes
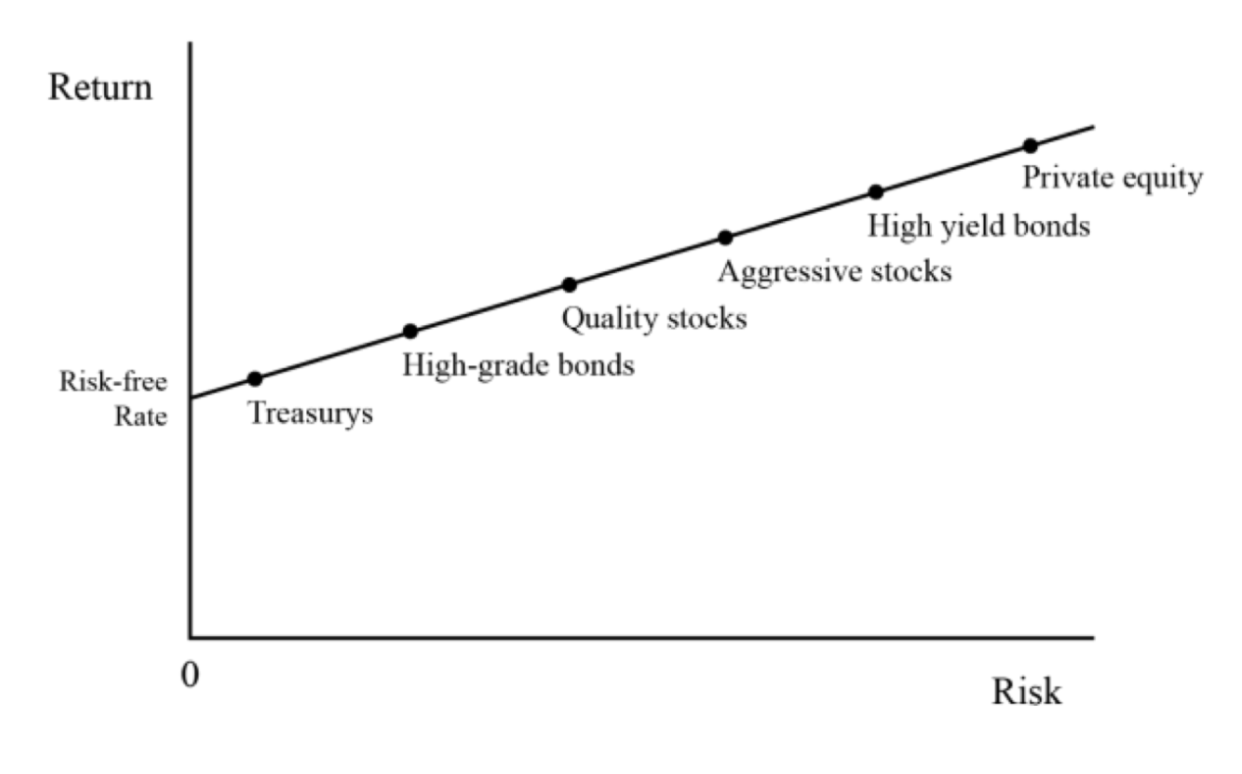
When cash begins to yield above bonds and becomes comparable to stocks, more people will move into cash and away from lending, stock investing, and other risk-taking behavior.
Stocks must yield above bonds, which must yield above cash and by the appropriate risk premiums.
We always know what the rate on cash and various forms of bonds are. They are advertised in whatever one’s currency is.
You can view these rates at any time along the curve either in real-time on a trading terminal (e.g., Bloomberg) or end-of-day rates on the official Treasury.gov site.
When the capital market line has kinks in it that cause a downslope in parts of it, this is what’s commonly called a yield curve inversion when mentioned in the financial media (usually between cash or short-terms bonds and a longer-term bond).
Economies don’t work well when the yield on cash is higher than that of other financial instruments. People borrow cash to make productive investments that create value. When there isn’t that spread for enough borrowers, then it will slow the rate of credit creation and investment until it’s rectified.
At the same time, yield curve inversion can be healthy for short periods to avoid excessive speculation. If people knew that cash could always be borrowed and put into stocks or other risk assets and it would always work, bubbles would be easy to form.
Cash is taken as short-term government debt, usually taken as the 3-month rate, but generally any yield under 6 months.
Bonds generally refer to a medium-duration maturity of safe government debt. The 10-year is the most popular benchmark.
It’s common because it essentially entails what kind of investment return could you lock in over the next decade.
There is price risk in that it’s always marked to market and 10 years is a reasonably long duration with price swings noticeable at the daily level. But if held to maturity, you know what kind of yield you’ll get with no material credit risk.
Fixed income is also a very broad asset class (credit is about 3x deeper as a market than stocks), so one can compare yields across various durations and credit qualities.
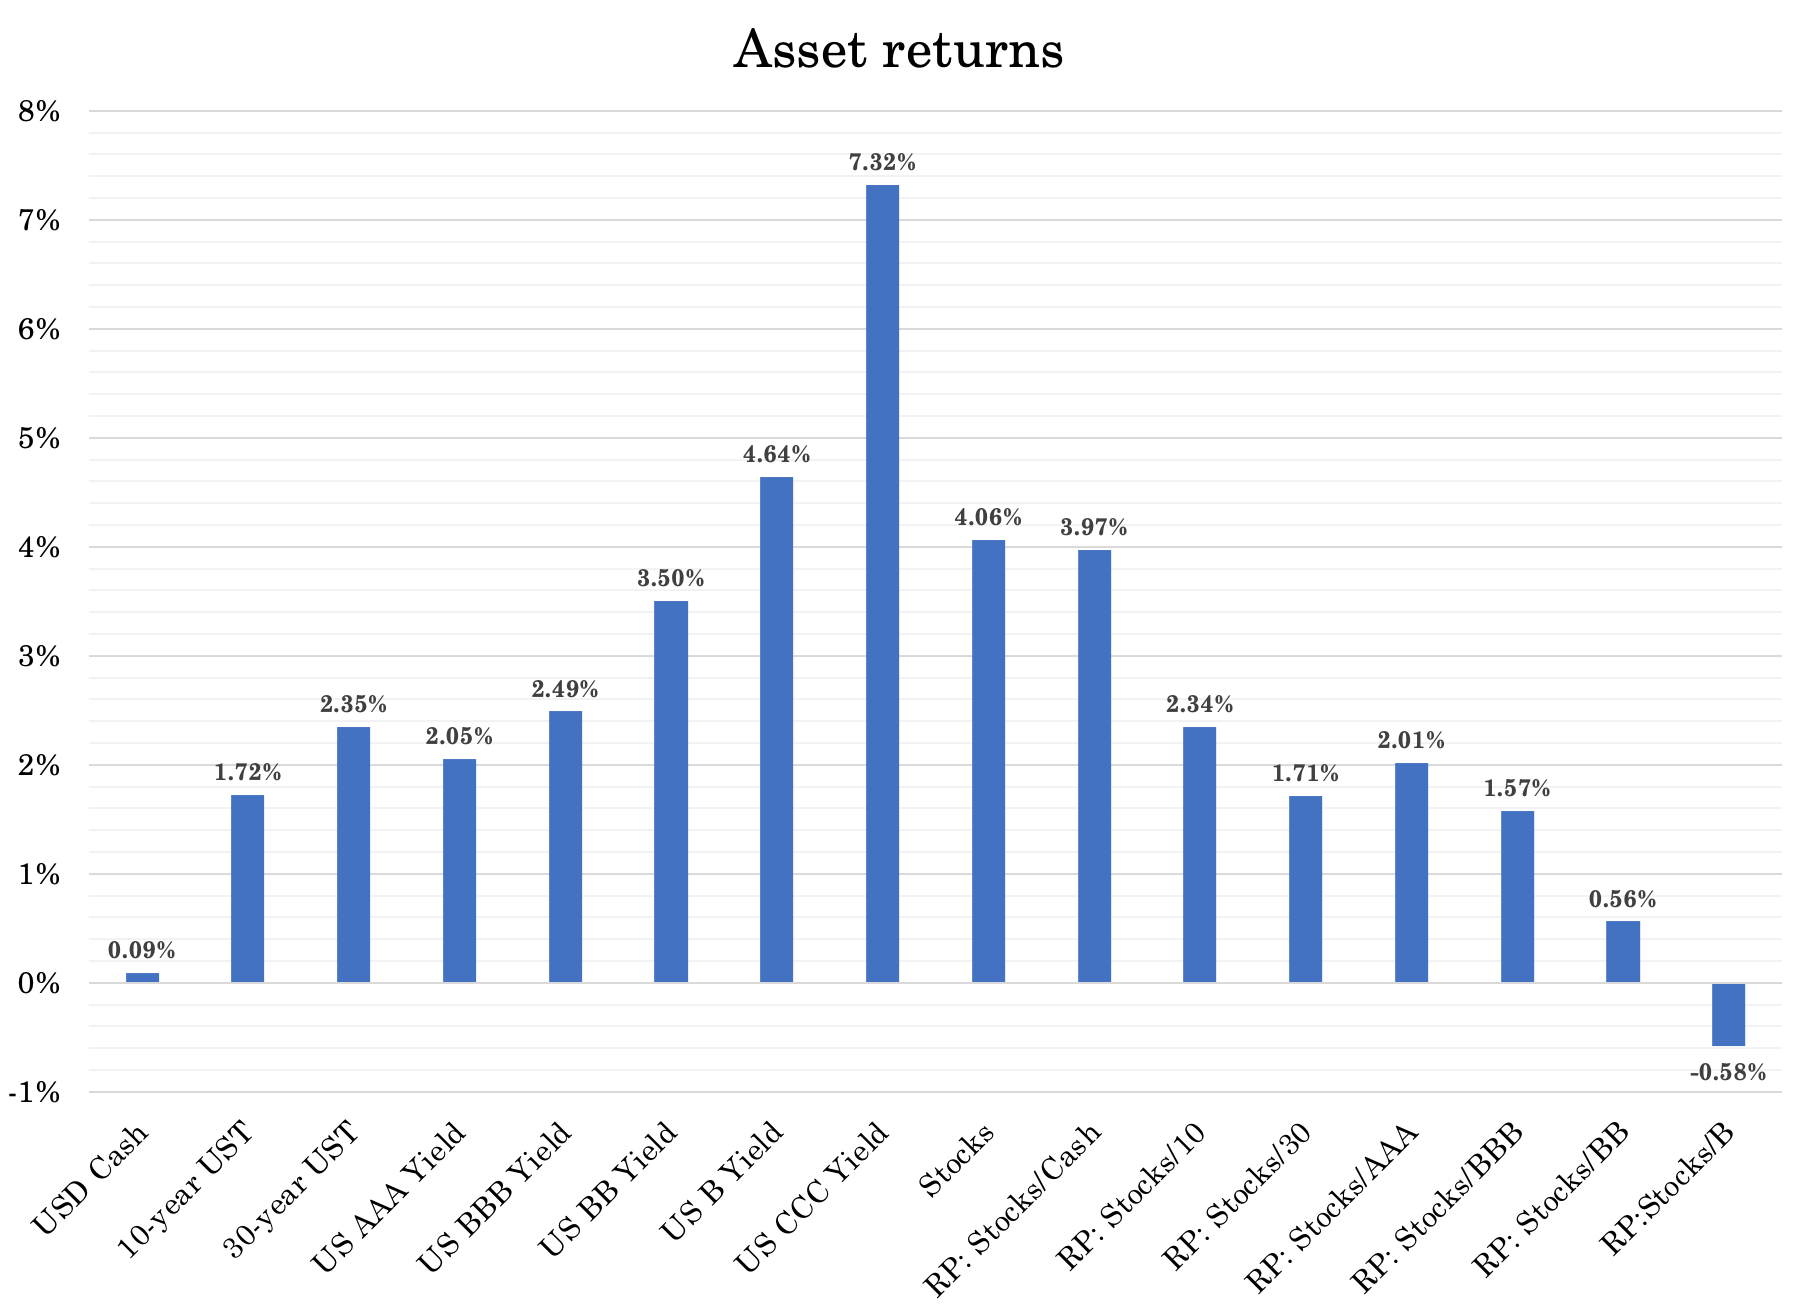
US Expected Asset Returns and Risk Premiums (“RP”) between Asset Classes
Stocks are harder to determine because they don’t have an advertised yield (earnings divided by price).
The yield on stocks is a combination of:
a) the discount rate (a function of the rate on cash or a representative safe fixed income instrument), and
b) the risk premium
The price of a stock is a function of its present value of future cash flows. The sum of the discount rate and the risk premium represents the expected return.
If stocks are about double the volatility of the 10-year Treasury, then investors want extra return to compensate them for taking on this higher risk.
Sharpe ratios for asset classes are typically around 0.3 over the long-run. This is the ratio of the excess returns over excess risks.
Seven to eight percentage points multiplied by this 0.3 means investors expect to be compensated an extra 2.1 to 2.4 percentage points.
If a 10-year bond is yielding, say, two percent, that means stocks could yield around 4 percent. This is about what we have projected above.
This seems very low. And it is when looking backward, but those higher returns of the past have pushed forward returns down.
Central banks can potentially use their tools to try to inflate asset prices in nominal terms by continuing to run loose monetary policy. But they are unlikely to be good in real terms.
Namely, people are unlikely to get a lot of extra real spending power from having a mix of stocks, bonds, and cash, particularly the latter two.
There are higher yields elsewhere, which is why many are going into other asset classes and into different places.
More people are buying cryptocurrencies as a store of value.
Many are seeking out cash flowing assets, which can be really attractive with a zero percent funding rate (the rate on cash).
What’s most important isn’t the nominal rate of return, but the spread between what you earn on your assets and what you pay on your liabilities, and ensuring that your liabilities are sensible in relation to your equity.
Even if your return on equities is just five percent, for example, but your funding rate is zero, that’s no different than getting 10 percent and paying five percent. The spread is the same.
Going into other emerging markets can be attractive, providing more normal rates on cash, bonds, and stocks (e.g., southeast Asia).
But it involves a mixture of political risk, institutional risk, foreign exchange risk, liquidity risk, and so on.
While a 0 percent return on cash, 0-3 percent return on bonds, and 4-5 percent return on stocks might seem low, it is a function of low productivity rates in the Western world and stagnant growth in the working population.
And these low rates of return in all the basic asset classes will stay low for a long time.
Central bankers will attempt to ease these problems in the best way they can.
Most economic downturns are related to debt and liquidity problems. Historically, these issues are rectified, in one way or another, by getting more money and credit into the system.
Going back more than 200 years of financial history, you can see that governments rectified debt and market problems, they always eased. And this occurred irrespective of what type of monetary system they were on – commodity-based, commodity-linked, or fiat.
Devaluing money is typically the easier choice relative to having a severe credit crunch. For example, when you depreciate your currency, domestic wages still remain the same. But they increase the prices for imports and decrease the value of goods and services for exports in relative terms.
It can also incentivize other countries, especially export-oriented ones, to devalue their currencies in kind to avoid being competitively disadvantaged.
Currency devaluations also have the influence of stimulating nominal activity and reflation assets like stocks, commodities, and alternative currencies that act as the inverse of money (e.g., gold).
These do well in nominal currency terms because assets are priced in a certain amount of money per share, barrel, ounce, bushel, or other unit of account.
However, a depreciation can be especially risky when that currency isn’t in great demand globally or a lot of money has been borrowed in a foreign currency, like they commonly do in emerging markets.
If a currency is depreciated by creating more of it, part of this dynamic is not that the asset is going up.
Rather the value of money is going down. This causes the price to go up in nominal terms essentially as a type of contra-currency.
A currency depreciation is bad for bonds (and cash naturally, as it loses its value).
Nominal bond instruments involve providing a certain amount of money paid back over time. If it’s in depreciated currency they become less attractive investments, especially to international investors.
Policymakers typically also prefer cash and bonds to be unattractive as they want to get a reflation in capital markets activity to get a reflation in the real economy. It helps push people into spending on goods and services and into the types of assets that can help finance spending, like credit and stocks.
Hitting down against the zero interest rate barrier has never been a hard floor even if it seemed like a constraint and a novel problem when it happened.
This was the case in the 1929-1932 period in the US during the Great Depression and the 2008-09 period after the financial crisis. Buying assets to lower long-term rates became the new policy.
Even if nominal interest rates can only go to around zero, real interest rates can go as negative they need.
Therefore, it’s quite likely that nominal interest throughout the developed world – for a long time – will stay relatively anchored close to zero.
More of the focus will be on fiscal policy and money and capital flows will likely cause more volatility in real interest rates instead.
That, in turn, could produce more volatility in FX markets when the differences in economies can’t be expressed through nominal interest rates.
Constraints
The constraint to all of this is inflation. It’s not a problem at first because filling in the losses with new money and credit is simply negating deflation.
Spending is what drives prices. Holding the quantity constant, if there’s a reduction in credit and there’s not enough money and credit to offset that drop, prices will actually fall.
The problem with overly easy monetary policy to stimulate economies is that the value of money can end up so low that people lose confidence in it.
Emerging market countries run into this problem first. They have limited demand for their debt.
The USD is the world’s top reserve currency by a significant margin. It is over 50 percent of global payments, debt, and FX reserves, even though the US now accounts for only 20 percent of global economic activity and China has a larger international trade presence (even though only about two percent of its transactions and done in RMB).
So printing money is less of a problem for the USD and secondarily the EUR and others that are somewhat reserve currencies, like the JPY, GBP, and so on.
But it can be a large issue in countries that pursue aggressive easing policies that have limited savings in their currencies.
When there isn’t much demand for their debt internationally, they have limited capacity to print.
The US can pursue the most aggressive easing measures, followed by the EU, then JPY and GBP to keep their asset prices high.
China can take care of its own financial and economic system. They did a better job of controlling the virus and tend to be more proactive (rather than reactive) about their debt problems.
Stock Market vs. Economy
The same basic dynamic between the stock market and economy is still there.
What’s good for the stock market is generally good for the economy with a lag. Likewise, what’s bad for the stock market is generally bad for the economy with a lag.
But the environment is different in terms of how this is accomplished.
Regular monetary policy that is under the control of the central bank is fairly indirect. It adjusts short-term interest rates and, if necessary, buys or sells financial assets to help adjust long-term yields.
That then has its effects on lending and capital market outcomes and flows through the economy.
In a normal recession, you have to cut short-term interest rates about five percent. But you can’t cut the interest rates.
Instead of changing the economics of borrowing and lending through interest rate-driven monetary policy and/or QE, which is run by FOMC, it falls increasingly in the hands of the Congress and President.
They can then dictate how much money they want/need to spend and intentionally direct that where they want.
That can be a big advantage. In a standard interest rate-driven policy, you can’t direct funds to where it most needs to go.
In reality, the interest rate and QE policies that dictated the period following 2008 mostly benefited those who were poised to take advantage of them – i.e., those who owned financial assets.
Those who didn’t own assets didn’t benefit and created large wealth gaps, which spilled into social and political friction.
But if those funds aren’t well-directed it’s a big risk. It can create currency depreciation if it doesn’t create productive outcomes.
So the room for bad outcomes is higher as well.
How traders can benefit
Even though all traditional assets are low-returning, it can create great opportunity if there’s the ability to buy a cash flow asset financed by a super-low yielding funding source like cash or bonds.
Within the stock market, some assets (e.g., tech sector with long durations) will be supported by very low yields. Longer-duration assets are inherently better suited to low yields.
But it can also create great risk even with a small uptick in those yields. The very depressed yields in bonds creates inflows into longer-duration equities.
But if there’s no cash flow directly supporting those prices, then it’s a huge risk. So it’s a potentially very dangerous environment for those types of “growth” assets and a potentially great environment for the cash flow assets.
Thinking about leverage
If cash and bond yields are so low and historically attractive as funding vehicles (borrowing them to buy other assets), doesn’t that favor leveraging a lot?
It can create this incentive, but like anything it’s a matter of degree.
You can take a relatively safe asset and use leverage to raise its return to match or exceed that of a risk asset but still have it be safer than the unleveraged risk asset. You can also take an unleveraged risk asset and make it safer by holding more cash.
For example, stocks are presumed to be unleveraged, but companies have debt and those debtholders get paid before common shareholders.
Let’s say you assume stocks will return 5 percent per year at 16 percent annualized volatility and you have another asset that returns 2.5 percent per year at 5 percent volatility.
You can borrow $1 for each dollar of your own money to buy that 2.5 percent asset and effectively match your expected returns on equities. You doubled its expected volatility, but you now have a 5 percent returning asset (2x leverage on a 2.5 percent yield) and 10 percent volatility.
That’s a more favorable risk profile than equities. And if it’s a unique asset like a fixed income instrument you’re also improving the overall reward-to-risk of the portfolio by preventing it from having a concentrated environmental sensitivity. Stocks and bonds do well in different environments.
Of course, the higher the yield the better. It could mean buying a private asset/business that generates cash flow.
What assets benefit most
The assets that benefit most are those that are boosted by the nominal spending and the monetization policies that are being pursued.
These are, for example, companies that sell something that everyone needs (e.g., consumer staples), which aren’t as likely to be impacted by a fall in the credit cycle because you don’t have the traditional interest rate policy to offset that fall.
Ideally, they’re the least susceptible to the economic cycle as possible.
Or at least have strong balance sheets such that anything that comes at them they can get to the other side of it.
And these assets are funded with a negative real interest rate, as of right now. Cash and Treasury bonds are not investment assets. They destroy wealth due to their real yields, so they’re funding assets.
In Asia and China, the yields on financial assets are higher. And their economies are growing more quickly.
What are old, normal industries in the US are growth industries in China and many parts of emerging Asia simply because they didn’t have them before. They went from not existing to existing as they look to develop their internal economy and diversify it well.
So, in that part of the world you have a broader set of security and industry selection. And you also have a tailwind of higher productivity growth, plus the normal policy levers should they need them.
You have very different circumstances between the two. And because of the global competition between the two, such as supply chain delinking and a greater focus on autonomy as opposed to interdependence, it could also create better diversification.
On top of all that, you don’t have the tightening of monetary policy anywhere, which is largely positive for risk asset investing.
Diversification is vital
Without belaboring the point, as we’ve done in other articles, diversification is key.
You want to avoid the areas that are going to destroy your wealth (having too much cash beyond what’s sensible and prudent, Treasury bonds).
But no one asset is going to do it.
Throughout history, there’s never been a decade-long period where any one asset class – stocks, bonds, gold, commodities – hasn’t declined 50-80 percent (or more). This also includes cash.
And you don’t know which one that’s going to be. Markets are tough because it’s not whether things are good or bad, but whether things will be good or bad relative to what’s already discounted in the price.
Some people might favor stocks, bonds, gold, or another asset or asset class, but they can all be part of it if these assets are blended well.
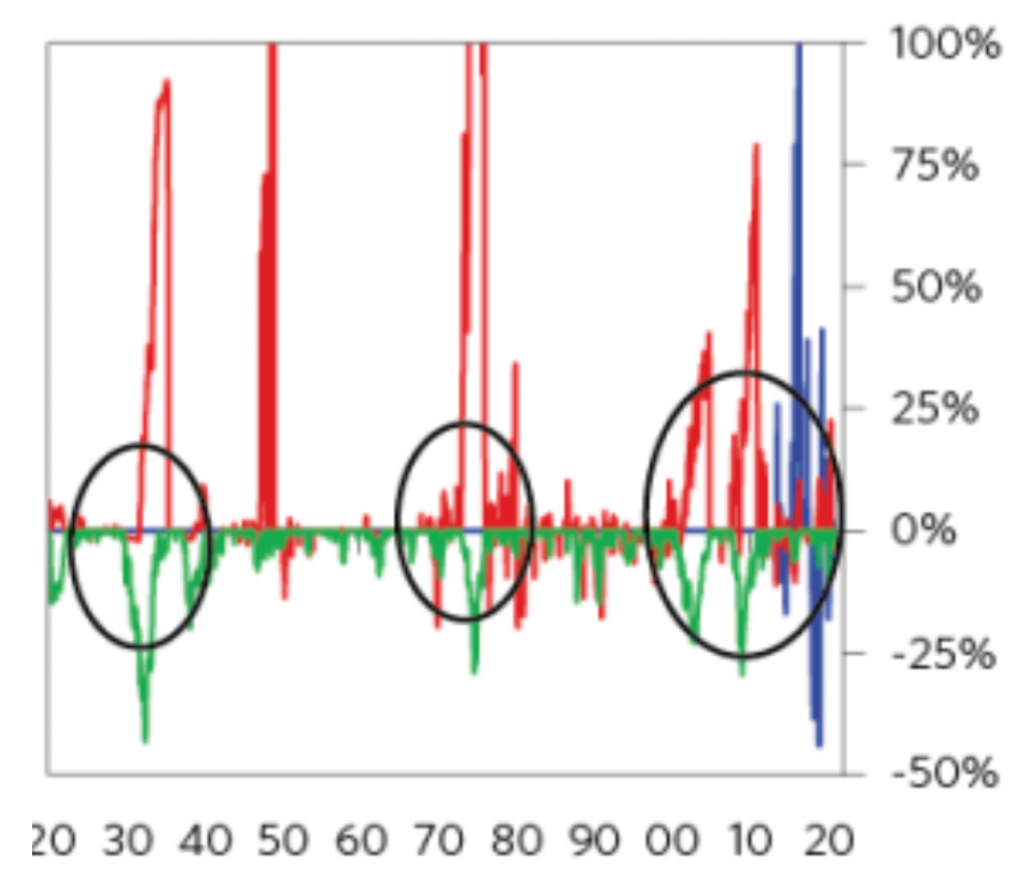
For example, when a stocks and bonds portfolio has undergone large declines, gold has traditionally done a pretty good job of helping the portfolio from undergoing large amounts of capital destruction.
Gold (red) vs. US 60/40 (green) vs. Bitcoin (blue): 1920-present
Can cryptocurrency be part of a portfolio?
It’s a potential store of value. It’s basically a call option on the idea it could be one. We’ve discussed the asset class in other articles.
Even owning a small slice of cryptocurrency in a portfolio (e.g., one percent of the allocation, even less) is a lot of volatility. Big double-digit rises and declines are commonplace in very short periods of time.
That level of volatility is not likely to come down until there’s more diversity in the investor base, including big institutions. These entities need to see more public oversight, more of a track record, and more assurance that it won’t be outlawed.
Gold, an alternative currency and store of value, has been banished at times throughout history as a form of credit controls.
Because bitcoin and cryptocurrency can serve that same type of purpose as gold as an alternative money, or alternative asset not controlled directly by central banks, there’s that left-tail risk.
Namely, if the behavior in it is such that it impedes central banks from having control of the money and credit within their borders, they could work to prevent transactions and/or purchases of it (e.g., such as banning bank wires or bank debits typically used to buy it).
Overall
But by and large, there is no one answer as to what to invest in. Because the range of unknowns are always large relative to the knowns relative to what’s discounted in the prices of markets.
You have to have some diversification to prudently improve reward relative to risk and also make the risk of the unacceptable (risk of ruin) nil.
There needs to be diversification with respect to ups and downs in growth and ups and downs in inflation. Certain assets do well in different environments, so they need to be balanced appropriately.
Inflation concerns
The low-rate environment is great as long as inflation stays within acceptable boundaries. If it heats up, then the trade-offs that need to be made from a policy standpoint become more concerning.
Inflation has the effect of raising nominal interest rates, which feeds into the discount rate at which the present value of future cash flows is calculated. So, it’s bad for stocks and bad for nominal rate bonds.
Traders and investors are accustomed to the inverse correlation between stocks and bonds, but that can’t be extrapolated. This is because it’s a function of a set of circumstances that could change.
And in a coordinated fiscal and monetary environment, the capacity to create inflation is that much more. Since 2008, we’ve had relatively loose monetary policy throughout the developed world, but relatively tight fiscal policy.
The tide turned in 2018 during the Trump administration, but this was counteracted by a shift toward tight monetary policy by the Federal Reserve.
They eventually gave up on this tightening in late-December 2018 after about a 20 percent drop in the stock market. That would have a feed-through into economic activity.
By 2019, they had given up on the idea of further tightening and began easing policy.
You can consider this a type of Fed put, and the reason for this relates to the linkage between the stock market (and capital markets) and the economy. There’s a feed-through effect.
That led to a great year for equities and all financial assets. That brought us to 2020 and a move toward unified fiscal and monetary policy with the steep drop in incomes.
With the unification where you can pursue such policies as putting money in the hands of people – and based on who needs it most through proxies like incomes reported on tax returns – you can get more inflation.
But it’s also a matter of what the inflation is in.
With standard interest rate and QE policies, you get an inflation of financial assets because it’s run through the financial system.
QE is literally buying bonds and financial assets and those who sold the bonds and asset are going to want to buy something similar to what they already owned. So it goes into assets that are of higher duration or credit risk.
But little of that money flows down into goods and services.
That’s helped swell the prices of financial assets but very little of that eventually went into the real economy and helped facilitate spending.
US vs. Global
Inflation is also not just a US matter, it’s a global question. More than 80 percent of the countries in the world have an inflation rate under three percent.
Things like globalization where you can locate production where it’s cheapest has helped lower the cost of labor. You had the rise of cheap markets like China, India, and to a lesser extent other countries where you could have goods produced cheaply.
So, low and stable inflation has been largely true globally, and not only in the US and developed markets.
A rise in inflation would have to be a global phenomenon. And other countries are not stimulating to the extent the US is because they can’t.
Currency matters
Any country’s inflation rate is impacted based on what its currency does.
If you have a dollar devaluation, that can raise the US’s inflation rate, even though it’s deflationary to other countries, ceteris paribus, because their currency goes further relative to the dollar.
For example, imports from the US become cheaper. And they can get more dollars for their exports, which increases national savings.
Capital flows matter a lot.
If yields are low in real terms for domestic savers and investors and bad in currency-adjusted terms for international investors (because of the combination of the low yields and depreciation rate in the currency), money leaves the currency for safer currencies and alternative ways to store wealth.
This puts policymakers in an increasingly delicate situation where trade-offs become more acute. This is especially true if they can’t print money, like the predicament faced in emerging markets.
When money leaves the country, lending increasingly declines and the economy slows down. The central bank is either faced with the choice between letting credit markets dry up or creating money, generally ample amounts to offset the contraction in credit.
In countries where they can print money, they have an advantage. But they can’t abuse these stimulants. The more they do, the less growth they’ll get out of them.
It’s widely understood that central banks face a trade-off between output and inflation when they change interest rates and liquidity in the financial system.
However, this trade-off between output and inflation becomes much more acute when money is leaving the country. Conversely, it becomes easier to manage when money is flowing into a country.
This is because these positive capital inflows can be used to increase foreign exchange reserves, lower interest rates, and/or appreciate the currency, depending on how policymakers choose to use this advantage.
Positive capital flows (capital inflows) provide deflationary pressures. They can get more growth per unit of inflation.
Negative capital flows (capital outflows) provide inflationary pressures. They get less growth per unit of inflation.
The complexity of the inflation question
But the inflation question is more complex, as there can be both secular and distributional impacts. Inflation for one country can be deflation for another based on the influence of relative exchange rates.
Nonetheless, we can say that inflation will be one of the main constraints on how far policymakers can prop up risk assets and the economy through monetary stimulus.
Without inflation, they have a lot of room to pursue these kinds of policies.
But with inflation and currency depreciation, monetary and fiscal policymakers begin to run into limitations in terms of how far they can go.
Conclusion
The stock market has an impact on the real economy.
A positive rise in the stock market (and capital markets more broadly) has a beneficial impact on the real economy with a lag, as money and credit work their way into producing positive economic outcomes in the production of goods and services.
And the converse of that is true with drops in the stock market having a negative feed-through into the real economy.
If you look at the return of assets as they come packaged to you, they’re likely to be low. In real terms:
- Cash: Negative-two percent
- Bonds: Negative-one percent to +1 percent
- Stocks: +1 to +3 percent
Cash and bonds are largely a source of wealth destruction. And all assets compete with cash and bonds, so they get pulled down as well.
Looking backward, that’s pulled up their returns. But looking ahead, that’s reduced their forward returns.
And that’s particularly relevant in the West (the US, developed Europe, Japan). So these countries will have difficulty stimulating their economies through the conduit of the financial markets.
In the East, it’s a different story. You have higher productivity growth. They haven’t gone into large fiscal deficits.
You also have much more in the way of the traditional policy levers to influence the economics of borrowing and lending and how the financial markets can produce good outcomes for the benefit of the real economy.
So there are both unique risks and unique opportunities of balancing exposures globally.