Why Countries’ Monetary Policies Move Together


There are a few main reasons why countries’ monetary policies move together.
i) Business conditions are correlated internationally
ii) Inflation rates and commodity prices tend to be correlated
iii) Countries don’t want their currencies to get too strong or too weak relative to others, so the decisions of some countries’ central banks influence those of others in tandem
Due to global trade and cross-border services, business conditions are largely correlated. China has an outsized pull on the rest of the world, going from less than one percent of global activity in the 1980s to around 15 percent, which is comparable to developed Europe.
Some commodity markets are localized due to the challenges in transporting some over long distances (e.g., natural gas). But many other commodities are global markets and rarely get too far out of whack depending on location (e.g., crude oil, soybeans). That means each country pays similar prices.
Countries that have similar levels of development in terms of technological adoption and comparable commodity price feed-ins will tend to have similar inflation rates.
Likewise, a good that is tradable should see similar prices regardless of where you go. Though it is dependent on transit costs, trade barriers, taxation, and other such factors, all countries will be motivated to buy from the lowest-cost producer.
There’s also the currency argument.
A weaker currency relative to a trade partner makes exporting its goods (and services) to it cheaper, but imports from it more expensive.
Whether policymakers want a weaker or stronger currency depends on the nature of the relationship between the two countries as well as its own domestic conditions.
If a country exports a lot to a certain country, but imports little, then it will generally want a weaker relative exchange rate to optimize the economics of this relationship.
When a country has a lot of debt, especially a lot of foreign debt denominated in its own currency, and can print its own money, it eventually wants to depreciate its currency. (A country that can’t print its own money or can’t do it sufficiently will eventually have to restructure its debts.)
A weaker currency in the form of printing money is everybody’s favorite form of stimulus. It’s much more palatable than cutting spending (because people rely on that spending for income) or raising taxes, which can cause capital migration, arbitrage, and potentially lower revenue.
Wealth transfers (adjustments of spending and tax revenue) are rarely done in sufficient quantity during economic or financial crises because of the constraints associated with each.
So, countries must either print money to fill in the gap or take it through lower incomes or bad inflation problems. Countries with reserve currencies (all developed countries to varying extents) will choose to print while those that don’t (emerging markets) will either have inflation problems or have to accept lower living standards.
From the US’s point of view and practically all developed countries that have a lot of debt and deflationary influences, they want a devaluation in their currencies.
On top of that, currency devaluations help trigger stock market rallies and is one of the best ways to do so.
Part of is the debt relief implications, part is the extra money creation going into financial assets, and part is the lower real interest rates getting more capital into the stock market and away from lower yielding assets.
It is also good for commodities and gold, and bad for bonds (i.e., getting paid back in depreciated money).
Co-movements in policy rates
Nominal interests are a function of nominal growth rates. Nominal rates must be below nominal growth rates by an appropriate spread to ensure balanced credit growth. Short-term interest rates are set by central banks (and sometimes long-term interest rates as well when short-term rates can no longer be lowered).
If the nominal interest rates are above nominal growth rates, then the debt will compound faster than the economy can grow and debt servicing problems will eventually emerge.
Though there are some difference in the growth rates between different developed countries and monetary policy is commonly thought of in a domestic framework, the various forms of linkages and commonalities between countries produce similar trends and levels in nominal growth and therefore in interest rates.
Inflation: US, Japan, UK, Euro area
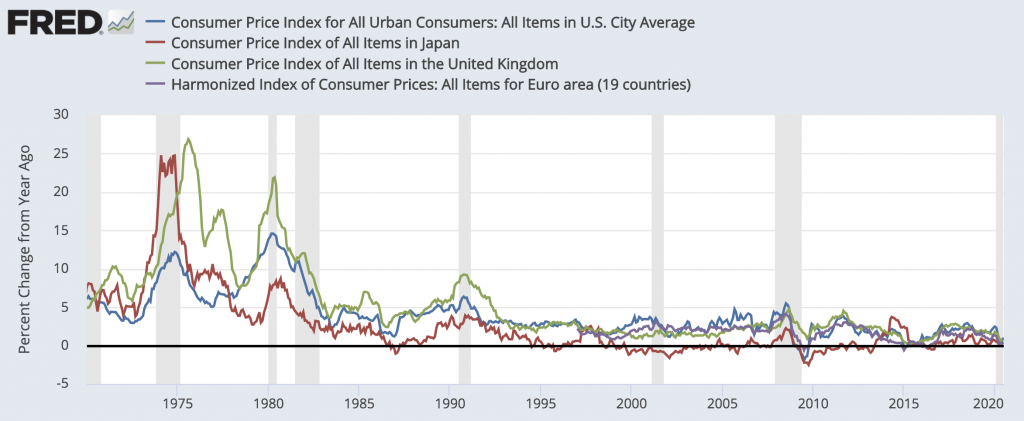
(Sources: BLS, Eurostat, OECD)
The graph above shows the strong co-movement in CPI inflation rates in the US, Japan, UK, and Euro area from 1970 to the present.
Inflation rose in the 1970s and “easy” central bank policy didn’t do enough to fight against the effect commodity price increases had on the overall price level. Higher inflation expectations took effect.
Before the 2008 financial crisis, short-term interest rates were in positive territory so interest rates were primarily set through the buying and selling of shorter duration bonds.
The graph below shows the large co-movements in monetary policy rates in the major economies from 1970 to the present for the Federal Reserve (US), Bank of Japan, and Bank of England. All hiked interest rates from the intolerably high inflation of the 1979-81 period and reduced them after once inflation was controlled.
Interest Rates: US, Japan, UK
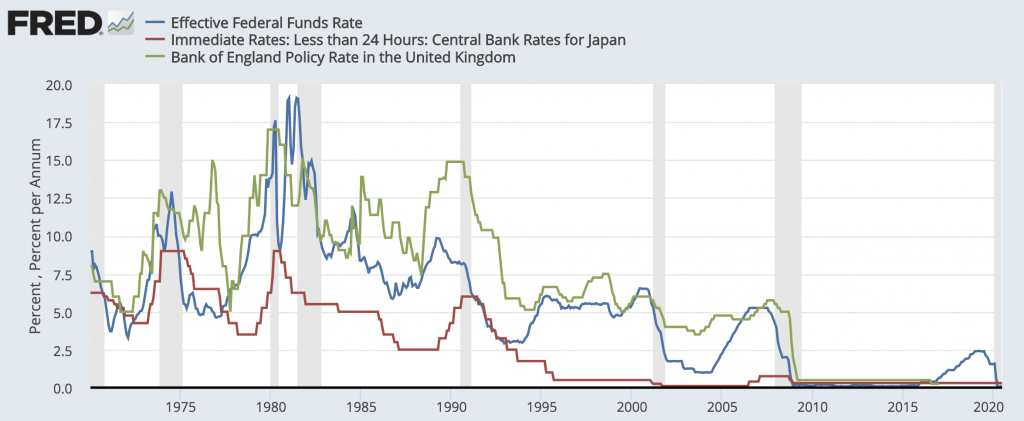
(Sources: BoE, Board of Governors, OECD)
When interest rates hit zero or a bit below, they cease being effective as a means of stimulating private sector credit creation.
Because the Fed, BoE, and BoJ hit zero on short-term interest rates, they had to move into a secondary form of monetary policy. This came to be known as “quantitative easing” or QE, where central banks increase the money supply by buying longer term bonds to reduce long-term interest rates.
As the 2008 financial crisis impacted all developed market economies, central bank balance sheets increased at the same time. The exception was Japan as their economy isn’t as financialized as that of the US or England’s.
Central Bank Balance Sheets: US, Japan, UK, Euro area
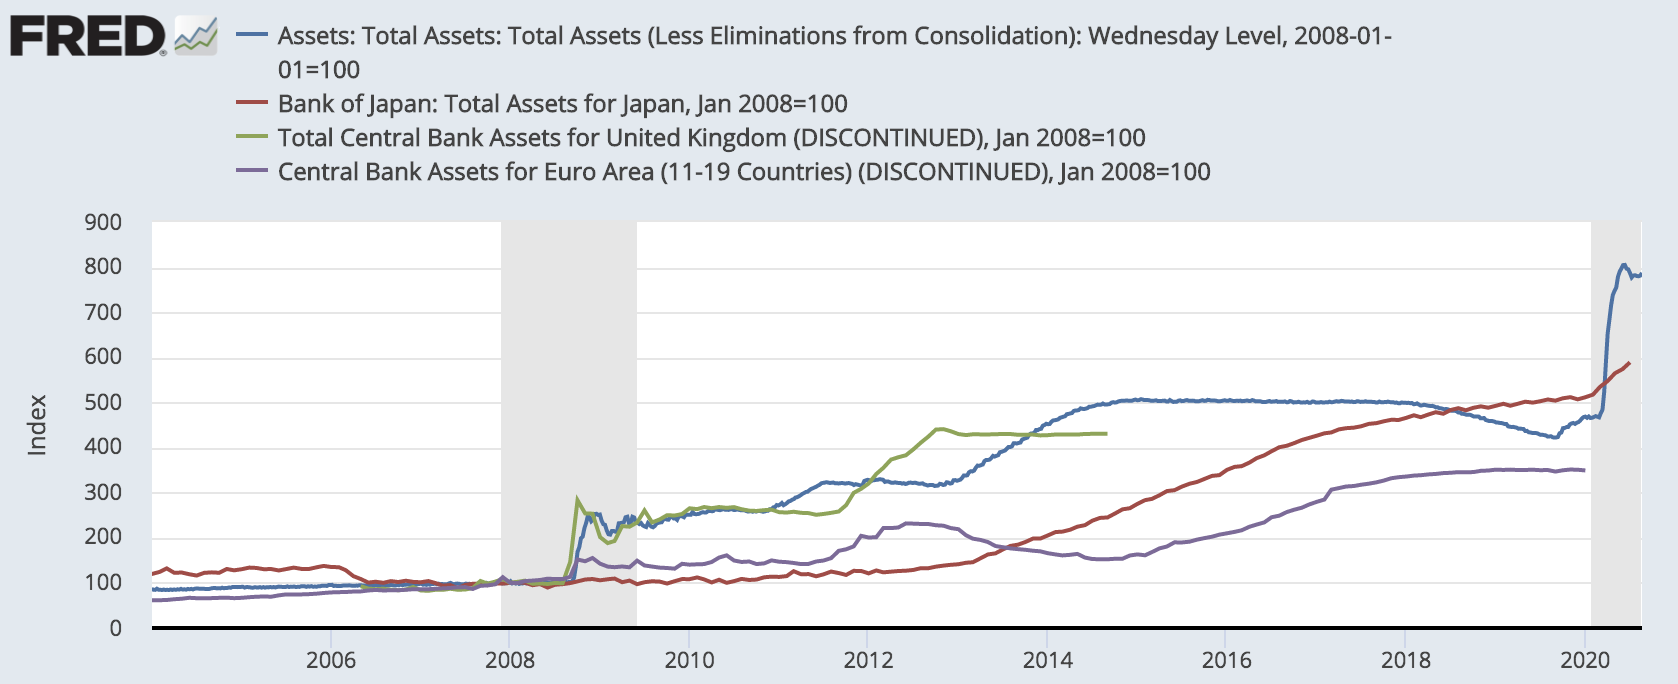
(Sources: BoE, BoJ, Board of Governors, ECB)
You can also notice from the graph that the US Fed’s balance sheet started growing in late-2012 while the ECB’s started shrinking. In other words, the US continued to print money while the EU chose to let bonds roll off its balance sheet believing it no longer needed the stimulus.
Increasing the supply of money is bearish for a currency while removing liquidity from the financial system through a smaller balance sheet is bullish for a currency. The trending moves in the balance sheets going in diverging directions was great for currency traders with a multi-year outlook.
Consequently, you can see the EUR appreciate against the USD during this period.
EUR/USD: Mid-2012 to 2014
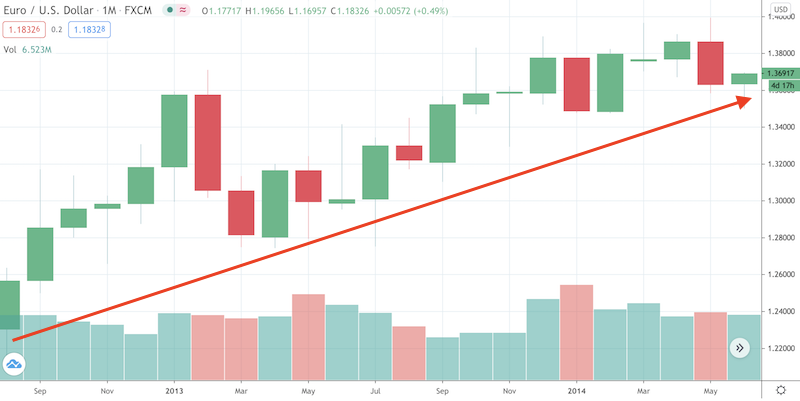
(Source: Trading View)
The value of the assets on central banks’ balance sheets is an imperfect way to measure the stimulus provided by quantitative easing.
The central bank balance sheet graph is based on an index value instead of the value of assets in each respective currency. This provides an approximate comparison of the size of each program.
The US and Bank of England were the first to respond in 2008-09. The ECB did so to a lesser extent, and later picked up the pace of buying in response to the sovereign crisis in 2011-12. The BOJ began in 2013 in response to their stagnation, with the ECB following again in 2015 after a two-year period of mild tapering.
Conclusion
Monetary policies between countries largely move together for the basic reason that business conditions are correlated internationally.
Capital flows, goods and services flows, people flows (to an extent), commodity prices, and other influences largely move together. Countries want to move production to where it’s cheapest and buy goods where they’re cheapest. This results in correlations between economies and between movements in their capital markets.
Developed countries have heavily adopted a lot of the same technologies among a large portion of their populations, have similar educational systems, and accordingly tend to have similar productivity rates.
Investors are global and tend to move their money to wherever they can get the best return on investment.
Some emerging markets have their currencies pegged to developed market currencies, typically to whomever their largest trading partner is. For example, for Saudi Arabia that’s the US, so in their fixed exchange rate regime the SAR is pegged to the USD.
Some countries also don’t want to be left at a competitive disadvantage when one country takes its monetary policy in one direction, given the effect on the currency.
If a country hikes interest rates, its return on short-term debt becomes more attractive. This leads to capital inflows and currency appreciation holding all else equal. A country that trades with said country may not want a weaker relative currency and want to move its monetary policy in lockstep.
Likewise, when a country lowers its policy rates, it may not want a stronger relative exchange rate and move rates down in conjunction.
When the Federal Reserve lowered interest rates three times in 2019, many other countries followed (especially those whose national incomes depend materially on exporting goods to the US) to avoid undesired appreciation in their currencies.
Notes
While the adjustment of short-term and long-term interest rates (and now monetary policy and fiscal policy coordination) is the primary way monetary policy works today, it has not always worked that way historically.
We’re in a fiat monetary system, mostly with various currencies free-floating against each other.
Other systems are commodity-linked where a certain amount of a currency can be exchanged for a certain amount of a commodity. Usually this is gold, but is sometimes silver (or both, or something else that it has a lot of, like oil).
Sometimes it’s a pure commodity system.
In commodity and commodity-linked systems, the constraints to money creation mean either increasing gold reserves (or whatever the currency is tied to) or increasing the amount of currency that can be exchanged for the commodity.
For example, in the early-1930s, before President Roosevelt broke the US dollar’s link with gold, one ounce of gold could be exchanged for $20.67. Because of the tight constraint on money creation this was broken in March 1933 to help relieve the debt burdens of the era.
Later, during the Bretton Woods monetary system that lasted from 1944 to 1971, each ounce of gold could be exchanged for $35. That was broken again in August 1971. This led to a rapid rise in the price of gold that decade as currency was created to help relieve the pressure related to a burgeoning number of debt claims.
This is different from pure fiat monetary systems where the basic adjustment of interest rates is typically used as the means by which money and credit creation are expanded and contracted without such constraints (i.e., backed by tangible reserves).
Governments prefer fiat systems because it affords them the power to print money, create credit, and redistribute wealth by altering the value of money.
Inevitably, fiat systems lead to highly indebted societies and commodity-based systems are enacted when the value of the money has been severely depreciated after the government “prints” a lot of it to relieve the associated debt burdens.
When a country undergoes hyperinflation that renders its currency worthless, its next step is to establish reserves of a commodity that has value and use that as a hard backing.
The government then removes the old currency from circulation that has lost its value and institutes the new one backed by the commodity.
Commodity-based systems are abandoned when the constraints to money and credit creation become too onerous. As a result, we continually oscillate between the two systems historically.
Naturally, the monetary cycle is another economic and market cycle. It is less well-known relative to the business cycle because major turning points occur rarely.
The last monetary regime change in the US was in 1971. As mentioned, claims on gold had become too large relative to the gold supply, so the linkage was inevitably broken.
Central banks do a good enough job in altering interest rates and controlling credit growth to the point where currency systems tend to work well for decades and these inflection points are reached infrequently.