A Basic Overview of Financial Market Forecasting (Macro Forecasting)


In macroeconomic forecasting of financial markets, it start with inflation, which moves into interest rates, which then flows into every other market.
Inflation
There are various definitions of inflation and everyone’s opinion on the inflation rate might be different because their basket of goods and services is different; their exact basket may vary significantly depending on what they’re buying as will their spending patterns.
CPI (and close derivatives of it) is what a lot of financial securities and contracts are indexed to, so it gets the most attention.
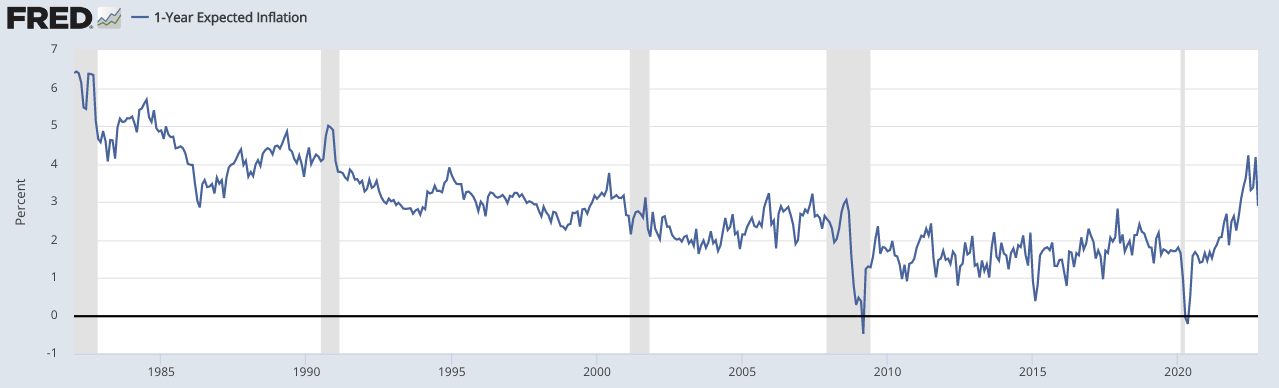
You can find what discounted inflation expectations via the pricing of TIPS relative to regular Treasury bonds.
You can compare this across all tenors. It’s common practice to look at inflation expectations out over 1-, 5-, and 10-year periods.
The FRED archive also contains this data.
1-Year Expected Inflation
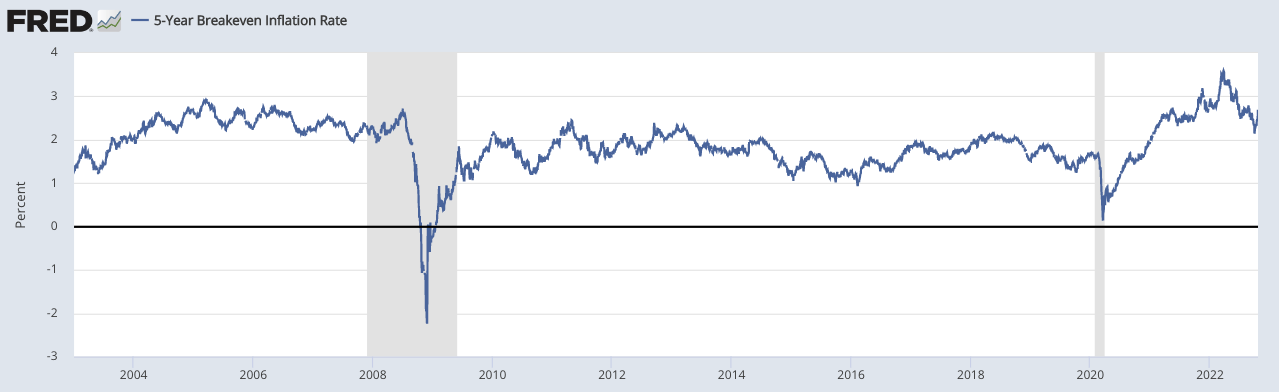
5-Year Expected Inflation
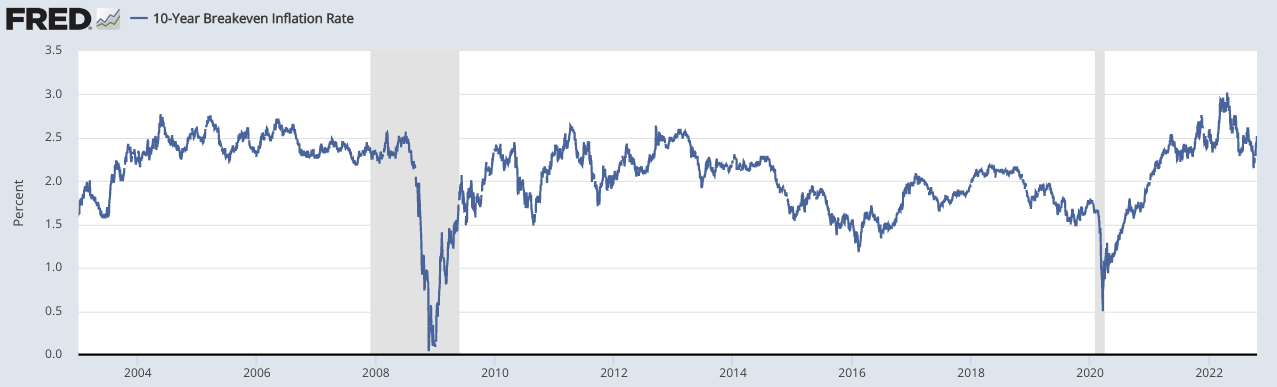
10-Year Expected Inflation
Market pricing is based on how things transpire relative to discounted expectations.
So, if one forecasts that inflation will be higher or lower relative to what’s discounted that has implications for interest rates, bonds, and other markets that are priced off this information.
Inflation itself encompasses the prices of around 100,000 goods and services. It involves forecasting the future path of interest rates as set by the Fed and other central banks.
It involves forecasting the outcomes of certain geopolitical events and the knock-on effects those have on global energy and commodity markets, trade relationships, and supply chains.
If there are further flare-ups in droughts, floods, and other shocks that can cause inflation to overshoot.
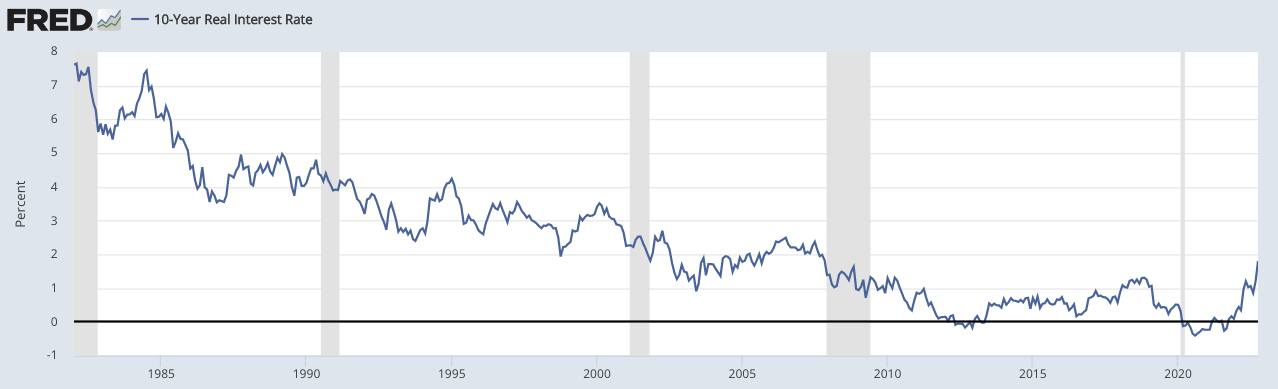
Real yields
Markets currently discount a real (i.e., inflation-adjusted) yield of about positive-1 percent over the next decade for the United States.
This basically means how much expected buying power would they gain/lose from putting their money into Treasury bonds.
The calculation for the real yield is based on:
- the amount of debt assets and overall liabilities outstanding
- the debt service costs for debtors, and
- what the implications of those real returns for creditors
What is the balance between the incentive for creditors to lend versus the level of punitiveness of that real yield for debtors?
0 to 1 percent is in the tolerable range for both debtors and creditors.
Below is a chart of how real interest rates have trended over time over a discounted 10-year timeframe.
10-Year Real Interest Rate
Projected bond yield
Add inflation and the real yield together and you get your projected bond yield.
This is the risk-free interest rate that feeds into determining the valuation of most everything.
For example, if you get 5 percent for a projected inflation figure and 0-1 percent for a projected real yield, that’s 5-6 percent for a projected risk-free bond yield.
Then you compare that to the current bond yields/interest rates seen across the yield curve.
Of course, depending on how well and how sophisticated your analysis is, you might expect inflation and the real yield to change over time, which would enable you to build out a yield curve of your own.
Effect of flows on interest rates
Then you have to consider the influence of flows.
Add in another 4 to 5 percent of GDP worth of bonds that need to be sold to fund the fiscal deficit.
Of course, the fiscal deficit changes over time, which needs to be accounted for and isn’t easy to predict.
It’s larger during a recession due to lower tax receipts (because incomes fall) and spending may need to increase to offset the fall in incomes and private credit.
Then add in another 4 percent to plug what’s being sold by the Federal Reserve. This also varies materially over time based on monetary policy operations. Sometimes they are buyers; sometimes they are sellers; and sometimes they have no influence as they’re neither net buyers nor net sellers.
But when there is a net selling into markets and not enough private or net foreign demand interest rates will need to rise further to reduce private sector credit demand to balance out the supply and demand.
Other influences on inflation
One thing that’s likely not adequately discounted as part of the inflation picture is the external conflicts that are going on and the impact those have on the de-linkages that are occurring between countries.
There is the rebuilding of supply chains that increasingly emphasize resiliency over efficiency.
Doing this successfully is going to take a lot of capital expenditures that will increase nominal GDP (i.e., what’s spent) without necessarily increasing real wealth (i.e., what you get) because what this is primarily accomplishing is replacing lost wealth and stranded assets.
There will still be trade between most countries, including among those that are geopolitical rivals, but they won’t be as tightly linked as before because countries are recognizing the need to become more self-sufficient and not dependent on other countries to get what you need.
Globalization and locating production wherever it was cheapest was great for efficiency and was a big tailwind for global wealth creation.
Manufacturing being increasingly located in China and other countries led to a large build up in savings that flowed back into the US in the form of buying Treasury bonds and other forms of assets.
This reduced real interest rates and bid up asset prices. Now that’s going in the other direction.
Even though globalization was a win for the whole, there were many who made worse off and so there are also net benefits too when the process reverses.
Some of the losers of globalization (some forms of labor) no longer have the same kind of drag on their wages and threat to their employment.
It may be a net negative for financial markets, which benefited from the low interest rates and low inflation and the ability to locate everything where you get the cheapest production. But more of the pie going back toward labor and away from capital can be argued to be a net societal benefit.
And naturally, there are also various kinds of shocks that can accelerate these trends (e.g., Russia-Ukraine, China-Taiwan, China and its allies vs. the US and its allies).
But even in the absence of shocks, it will grind in that direction.
These de-linkages also come with more divergent outcomes among countries in terms of the performance of their markets and economies.
This is a boost for investors looking for better diversification when it comes to international markets.
How this works into tactical market bets
So, if interest rates are set to rise or fall in such a way that deviates from the discounted market consensus, you might put on tactical market trades.
Strategic and tactical asset allocation are different.
Strategic asset allocation involves having a type of risk-neutral portfolio that’s balanced and blended well to avoid environmental bias.
Too many portfolios are biased to do well when the environment is good (good growth, low to moderate inflation relative to what’s discounted) and biased to do poorly when that’s not true (poor growth or high inflation relative to what’s discounted).
We have an article on how to go about that here.
Tactical is a different story where you’re betting against the market consensus by overweighting or underweighting certain assets based on what you think will happen relative to what’s discounted.
For example, if you believe inflation is discounted to be too low and that actual inflation will come in above that, you might consider bonds to be a short.
But even if your analysis is valid, there are cases where your tactical bet may still be wrong.
For example, the central bank could decide that high interest rates are too much of a drag on credit creation, so they cut down on their bond selling or even become a net buyer.
In that case, you would get a weaker dollar/currency.
And FX is relative. So if you get a weaker currency, then weaker relative to what?
It could be relative to some other currencies (which means you need to do analysis on other FX); it could be relative to certain types of commodities or currency alternatives (e.g., gold); or it could mean relative to something like stocks.
But those other assets have competing influences governing their prices.
Divergent effects within asset classes
If you believe that interest rates will rise faster than what’s discounted into the curve, this will have divergent effects in the equity market.
For example, the debt-dependent and/or interest rate-sensitive parts of the economy might also be a short, such as most tech, commercial real estate, housing (which may include homebuilders, most mortgage bond spread strategies packaged as mortgage REITs, most services dependent on housing sales).
Since technology companies are typically higher-growth, more of their cash flow is discounted to come further in the future. This makes them longer-duration securities, which in turn makes them more sensitive to changes in interest rates.
Real estate is a sector where most purchases are made with large amounts of credit and it’s also a significant part of most countries’ labor markets. So weak credit conditions typically impact real estate.
If long-term risk-free bond yields are at the higher end of what’s tolerable for markets and the real economy, then stuff like mortgages have a credit risk premium added on top of that yield.
It’s straightforward that if commercial real estate deals were done at cap rates that are several percent below prevailing or future interest rates, it will impair equity significantly if refinanced.
Private markets are not necessarily a place to hide
When liquid markets are bad (i.e., stocks and/or bonds are falling), some think private markets are a convenient place to hide.
But just because something is illiquid and you don’t see its price continually marked to market doesn’t mean it’s less volatile, less risky, or exempt from the same underlying economic forces as something on a public exchange.
Private assets are not less volatile simply because they aren’t frequently marked to market.
The risk/volatility is not lower; it’s just harder to see.
Mistaken beliefs that private markets are safer because their prices aren’t seen continually is what’s called “volatility laundering”.
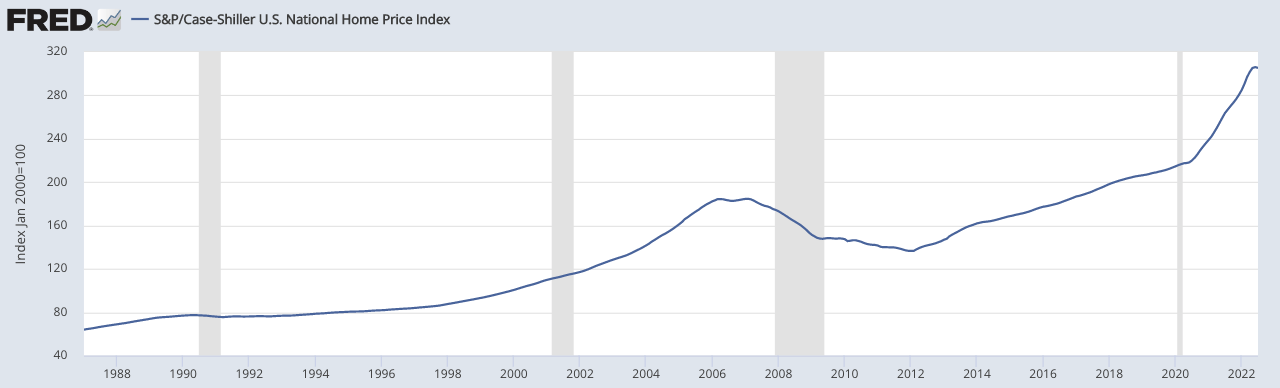
For example, almost all homeowners value their homes by looking at recent sales in their area. Unlike assets constantly marked to market, the most recent home sales in an area may have happened weeks or months ago, not seconds ago. So homeowners are regularly using outdated prices.
The Case-Shiller Index is also misleading because it uses home price data that’s outdated, then uses a moving average of the lagging data, which makes it lag even more. Then, on top of that, prices aren’t continually marked.
S&P/Case-Shiller U.S. National Home Price Index (CSUSHPISA)
Naturally, this can artificially deviate significantly from public equities.
S&P/Case-Shiller U.S. National Home Price Index (CSUSHPISA) vs. Wilshire 5000 Stock Index
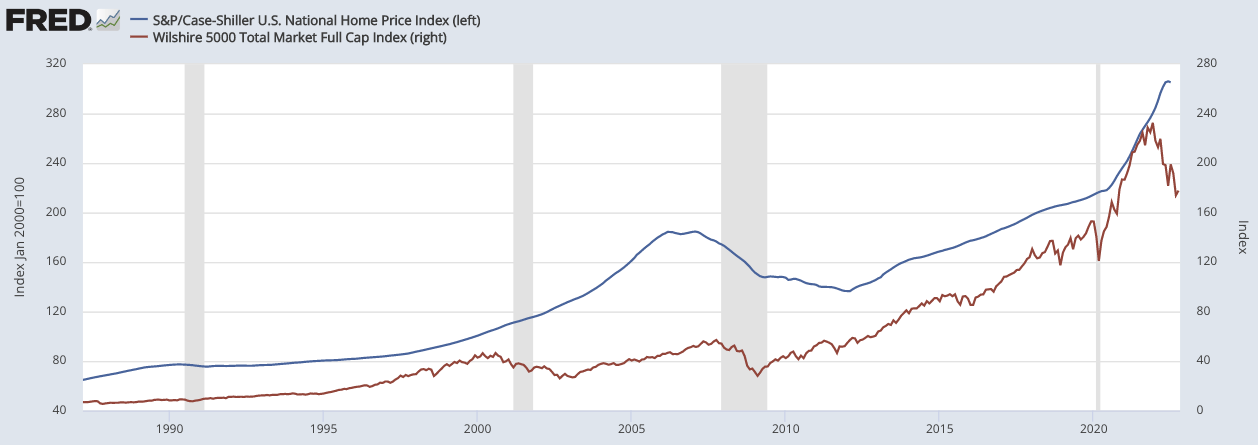
The smoothed out nature of private asset prices is misleading because in private markets sales typically dry up significantly in a bad market, so a lot of assets don’t get marked to market like they naturally will be in public markets.
Because a market has slowed to a trickle or frozen up completely and prices aren’t moving doesn’t mean they are actually higher equilibrium prices. It means that bid and ask prices aren’t matching.
Less interest-rate sensitive parts of the economy
Consumer spending tends to remain strong even during periods of rising inflation, rising interest rates, and falling asset markets.
The fall in private credit will hit spending later. Cash and wealth levels tend to still stay relatively high during the initial legs of a market downturn.
The process of cash and wealth levels being drawn down will tend to support the continued growth in spending.
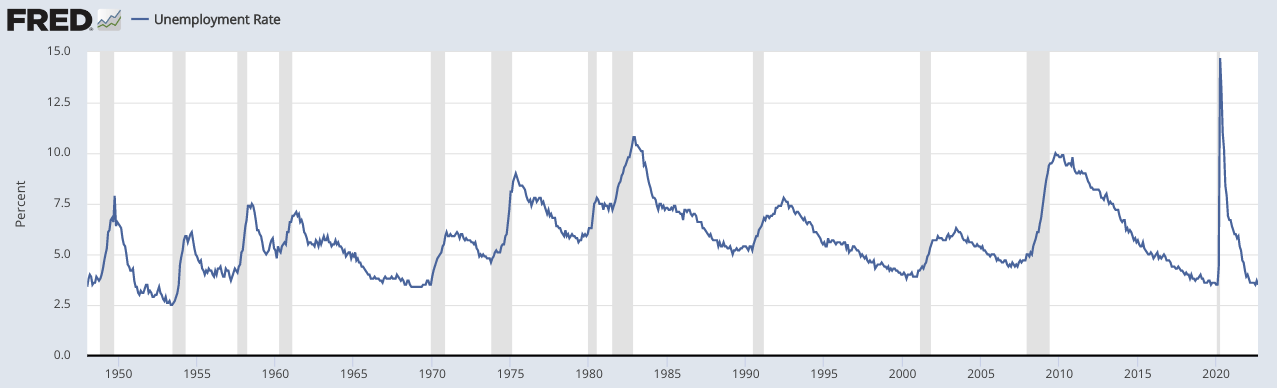
Labor is a lagging indicator. Unemployment will tend to peak early in the next expansion, not within the recession itself. This comes after private credit is cut and companies cut back on labor to protect their operating margins.
Unemployment Rate
Earnings and interest rates are the big two factors in equity markets
Interest rates impact stock prices due to the present value discount effect from higher or lower interest rates, then there is the impact from the incomes produced by assets.
A combination of higher earnings and lower interest rates will tend to raise equity prices while lower earnings and higher interest rates will tend to lower equity prices.
Any number of exogenous factors can also influence stock prices on a day-to-day basis, but earnings and interest rates are your big two factors.
Broad overview of tactical trading
To try to distill tactical trading into a handful of words:
The best time to buy risk assets is not in a strong, booming economy with high equity prices. When that’s the case, central bankers start becoming concerned about inflation and want to start slowing things down.
Some time into the tightening process, they start raising interest rates faster than what’s discounted. And after that, those interest rate hikes start hitting credit creation.
Credit is spending power. Spending is someone else’s income.
So after a while, income gets hit, and financial asset prices start getting hurt from not only interest rate increases (via the present value effect) but also from lower incomes.
So classically, the best time to buy risk assets is in a weak economy with high unemployment and lots of spare capacity. Inflation is typically quite low during these periods.
That’s an economy that the central bank and other policymakers (the fiscal side) are going to try to get going again.
And classically the worst time to buy risk assets is during a period of high inflation. Central bankers will necessarily want to cool that off by tightening monetary policy through a combination of rising interest rates (both short-term and long-term rates).
High inflation through the lens of a policymaker
Inflation is tolerated to a point until it has a negative impact on productivity.
The inflation rate where this occurs – that most policymakers and most people agree on – is somewhere around two percent.
If you’re a policymaker facing an inflationary environment, first you need to understand the nuts and bolts of inflation.
The price of anything is the money and credit spent on it divided by the quantity.
So there’s a supply component and a demand component.
If you’re a monetary policymaker, your biggest lever is over the demand component – i.e., money and credit.
Relying on higher supply to come along to match demand isn’t always realistic. This is especially true since a lot of supply comes from labor and typically a decent amount of inflation is due to tight labor markets.
So expecting a lot more supply of goods and services to come online when labor markets are tight isn’t always realistic.
So how can you most reliably get inflation down?
Take away money, credit, and income.
A lot of money goes into financial markets. So getting a reversal in financial markets will cut down on the amount of money people have.
If you can engineer enough of a cut in financial wealth you will be able to get enough of cut in private credit creation.
This will eventually get enough of a reduction in incomes from rising unemployment rates to get the money and credit spent on goods and services better in line with the production of them.
The fall in real GDP/the deepness of a recession that needs to happen to engineer a move back toward a more normal inflation rate depends on existing inflation and growth levels.
The higher the inflation rate the deeper cut to output that’s needed.
If policymakers don’t want that kind of fall in markets and economic activity, then they will have to accept a higher rate of inflation and the adverse effects on productivity that excessively high inflation rates create.
When policy errors are made – e.g., staying too loose for too long, which necessitates tighter policy at a point in the future – this adds more financial market volatility.
In turn the nominal values of most assets (e.g., stocks, houses) move around a lot even though the intrinsic values of most things might change very little.
Example
During the 2022-23 period, inflation hit about 8-9 percent in the US and over 10 percent in some parts of Europe.
if you look at the underlying mechanics of what the Federal Reserve would need to do to get inflation down to 2 percent in the US, that would require a short-term interest rate of around 5-5.5 percent and long-term interest rates of 6-7 percent, which would likely produce about another 30 percent drop in the average equity index and a real GDP contraction of about 3-4 percent.
The basic issue is that the interest rate needed to solve the inflation problem is too high relative to what the markets and economy can tolerate.
So they straddle the two and get a type of stagflation scenario.
Because going too high is likely too painful, the high nominal growth/low real growth dilemma will likely grind on as they weigh the consequences of that trade-off.
Solving an inflation issue is very different compared to a deflationary shock like 2008 where they can lower rates and digitally “print” money to buy lots of different assets to get it over with fairly quickly if they’re aggressive enough with those efforts.
When they’re dealing with one or more of:
- inflation
- asset bubbles, and
- currency problems…
…they’re constrained and will cause the pain to last longer if they don’t want to get rid of the inflation problem right away.
Policymakers straddling a middle ground
In such scenarios, they’re most likely to take a middle path between the two bad outcomes and accept that they’ll try to engineer a core inflation rate of somewhere around 3.5-4 percent over the medium-term.
But even doing is harder than they expect and can cause inflation to overshoot what’s discounted.
And when current market pricing doesn’t reflect those kinds of higher medium-term inflation rates, that would mean financial asset pricing would need to adjust a lot as the discount rate evolves in that direction.
Market implications
In turn, that would be bad for bonds and somewhat bad for stocks and other equity-like assets (e.g., real estate) in terms of a broad generalization.
Even within broad-level asset classes like equities, there’s a very large divergence in terms of what will do well in this kind of environment and what will do poorly.
Sufficiently cash-flowing assets vs. Insufficiently cash-flowing assets
Approximately 40 percent of the equity market is dependent on new buyers entering those securities because the cash flows they produce aren’t sufficient to support their prices.
This 40 percent is calculated by looking at the number companies that don’t produce enough cash flow to offset the net annual churn rate in their shareholder base relative to the overall number of companies.
For instance, if a company has 5 percent of its shareholder base churn each year then the company needs to produce enough cash flow to offset that decline to organically support its own asset price.
What is shareholder churn caused by?
This can be due to people retiring and running down their assets to support their spending or whatever the case is.
This churn is basically the pure dynamic in the cryptocurrency space. The “coin” requires new promotion and constant new infusions of money and credit to find the next buyer willing to pay a higher price.
Any asset market can be like this and asset bubbles occur when this dynamic is inappropriately extrapolated.
People expect the price rises to keep going via pricing extrapolations that would require ongoing Ponzi-like infusions (because it’s not coming from productivity) of new money and credit in the same quantities to sustain those price rises.
But when we see limitations in the form of inflation, bubbles recognized by policymakers or regulators (who might use macroprudential tools to slow the rate of credit growth), or currency problems, these asset markets can’t keep going in the way that they have.
When markets reverse, this is where a lot of uneconomic business models get exposed.
The most high-flying stocks that were assumed to be great innovators and great to own often see their prices crash by 50 percent or more. Some see their shareholders zeroed out.
Fraud and accounting problems often get exposed.
Yet at the same time, many companies may actually do quite well in inflationary environments because they’ve benefited from the rise in nominal spending and produce enough cash flow to offset the rise in the discount rate.
Or they might sell the good that’s been one of the causes of inflation in the first place. This is why energy stocks might outperform when oil is a contributor to inflation rates.
Looking under the hood of the stock market is important
So even though there’s a common tendency to look at indices and everything in an asset class just kind of gets lumped together as “stocks” or whatever it is, there’s a divergence between the assets that are okay (supported by their own cash flows) and not okay (not supported by them) when liquidity is being drained out of the financial system.
Differences between countries
And there’s not just divergence within asset classes but among different parts of the world as well.
During the 2021-23 period, developed countries have done a mostly poor job of managing their monetary policies, but countries like Brazil and Mexico have done a much better job.
Tactical trading has become more important in developed markets
On the other hand, in developed markets success is much more tactical – such as shorting, relative value trades – where returns streams can’t just be dependent on everything mostly going up.
This means you need to have returns streams that can benefit you when asset prices fall or you need more of a focus on strong cash flow.
A lot of assets, like standard stocks and bonds, don’t produce adequate cash flow relative to the rise in the discount rate relative to what was discounted, causing their prices to fall and leading to portfolio losses for most investors.
This also means that cash can do well in such environments and not only in relative terms.
Cash can be a perfectly viable or even attractive asset when its interest rate helps to compensate for the rate of inflation and the amount of the interest income that will go to taxes.
The allocation of cash in a portfolio will depend on its return and risk profile relative to that of other assets and how to go about the exact strategy.
One example is rolling short-term Treasury bonds.
For individuals, a popular strategy in the US has been buying Series I Bonds, which don’t have price risk (i.e., nominal price falls).
There will still be some loss in real value because the interest is taxed. For Series I Bonds, they are tax-deferred.
Conclusion
Financial market forecasting starts with inflation, which feeds into interest rates, which then feeds into other asset markets.
Stocks and bonds in general tend to not do well when there is a rise in inflation and/or interest rates and liquidity is being drained out of the financial system.
But there can be big differences between individual stocks and sectors, as well as among different countries.
This makes tactical allocation play a bigger role during such periods, which may include shorting and relative value trades.
So it’s important to understand how each asset class functions, how they can integrate into a portfolio, and the differences in conditions among different parts of the world in order to make appropriate asset allocation decisions.