Beneish M-Score [Components, Formula, Calculation, Example]


The Beneish M-Score is a statistical model that is used to detect whether a company has manipulated its earnings.
The model was created by professor Messod Beneish in June 1999 after publishing a paper called The Detection of Earnings Manipulation.
The logic behind the Beneish M-Score is that a combination of aggressive revenue recognition practices, margin manipulation (could suggest cost capitalization), changes in leverage ratios and asset quality (e.g., companies may engage in acquisitions to distort profits), and discrepancies between earnings and cash flow (could suggest aggressive accruals) can be used to inflate earnings.
Beneish M-Score Components, Formula, and Calculation
The Beneish M-score is calculated using 8 variables (financial ratios):
Days Sales in Receivables Index
(DSRI) DSRI = (Net Receivablest / Salest) / (Net Receivablest-1 / Salest-1)
Gross Margin Index (GMI)
GMI = [(Salest-1 – COGSt-1) / Salest-1] / [(Salest – COGSt) / Salest]
Asset Quality Index (AQI)
AQI = [1 – (Current Assetst + PP&Et + Securitiest) / Total Assetst] / [1 – ((Current Assetst-1 + PP&Et-1 + Securitiest-1) / Total Assetst-1)]
Sales Growth Index (SGI)
SGI = Salest / Salest-1
Depreciation Index (DEPI)
DEPI = (Depreciationt-1/ (PP&Et-1 + Depreciationt-1)) / (Depreciationt / (PP&Et + Depreciationt))
Sales General and Administrative Expenses Index (SGAI)
SGAI = (SG&A Expenset / Salest) / (SG&A Expenset-1 / Salest-1)
Leverage Index (LVGI)
LVGI = [(Current Liabilitiest + Total Long Term Debtt) / Total Assetst] / [(Current Liabilitiest-1 + Total
Long Term Debtt-1) / Total Assetst-1]
Total Accruals to Total Assets (TATA)
TATA = (Income from Continuing Operationst – Cash Flows from Operationst) / Total Assetst
The formula to calculate the M-score is:
M-score = −4.84 + 0.92 × DSRI + 0.528 × GMI + 0.404 × AQI + 0.892 × SGI + 0.115 × DEPI −0.172 × SGAI + 4.679 × TATA − 0.327 × LVGI
How to Interpret the Beneish M-Score
The threshold value is -1.78 for the model whose coefficients are used in the above section.
- If the M-score is less than -1.78, the company is considered not likely to be an earnings manipulator. For instance, an M-score value of -3.23 would suggest a low chance of manipulation.
- If the M-score is greater than −1.78, the company is considered to be a potential earnings manipulator. For instance, an M-score value of -0.47 suggests a high likelihood of manipulation.
Example – Beneish M-Score for Tesla (TSLA)
If we apply this analysis to Tesla for the Q2 2021 to Q2 2022 period, it comes in as:
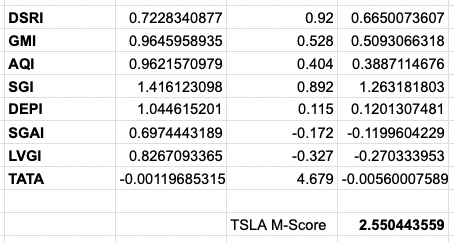
Tesla (TSLA) Baneish M-Score = 2.55
This 2.55 figure is well above the cut-off mentioned of -1.78 for “likely earnings manipulation”.
This suggests Tesla, known for its aggressive accounting practices, would strongly be suspected to be engaging in earnings manipulation according to this metric.
Where Tesla raises red flags, in particular, is:
- its receivables relative to its sales
- its sales growth relative to its cost of goods sold (gross margins)
- its asset quality
- its sales growth
- its low growth in SG&A relative to its growth in sales
Note that this particular exercise is academic in nature.
Many can disagree on the particular formula used to calculate the score, the cut-off points, and whether reducing a complex exercise to a single score is worthwhile.
But there is logic behind using these factors to assess potential earnings manipulation in corporate financial statements, as these are the various types of things you would look for.
FAQs – Beneish M-Score
What is the Beneish M-score?
The Beneish M-score is a statistical model that uses financial ratios to assess whether a company has engaged in earnings manipulation.
What is the formula for the Beneish M-score?
The formula for the Beneish M-score is:
M-score = −4.84 + 0.92 × DSRI + 0.528 × GMI + 0.404 × AQI + 0.892 × SGI + 0.115 × DEPI −0.172 × SGAI + 4.679 × TATA − 0.327 × LVGI
What are the threshold values for the Beneish M-score?
The threshold value is -1.78 for the model. If the M-score is less than -1.78, the company would be considered not likely to be an earnings manipulator.
If the M-score is greater than -1.78, the company would be considered to be a potential earnings manipulator.
It could be considered a gray area around that mark.
What does a high Beneish M-score mean?
A high Beneish M-score means that the company is suspected of engaging in earnings manipulation according to this metric.
What are some examples of companies with high Beneish M-scores?
Some companies with high Beneish M-scores include(d) Tesla, Enron, and Worldcom.
What are some criticisms of the Beneish M-score?
Some criticisms of the Beneish M-score include that it is too simplistic and that it relies on accounting data that can be easily manipulated.
Conclusion – Beneish M-Score
The Beneish M-score is a statistical model that uses financial ratios to assess whether a company has engaged in earnings manipulation.
The model is useful for detecting earnings management that would not be picked up by other methods, such as GAAP or IFRS.
The Beneish M-score has a reasonably high degree of accuracy in predicting earnings manipulation because there is logic behind the metrics it uses and the weighting behind it.
It therefore can be a valuable tool for investors to use when considering whether to invest in a company.
However, it should be noted that the Beneish M-score is not perfect, and there are some circumstances in which it may give false positives.
Therefore, it is important to use the Beneish M-score alongside other analytical methods when assessing a company.