Business Financials: The 3 Types of Financial Statements

Those in accounting, business, and finance will become familiar with the three types of financial accounting statements:
- income statement
- balance sheet, and
- cash flow statement
All three serve as financial analysis reports to shed insight into how efficiently and effectively a business is operating.
Let’s take a look at the nuts and bolts of all three.
Income Statement
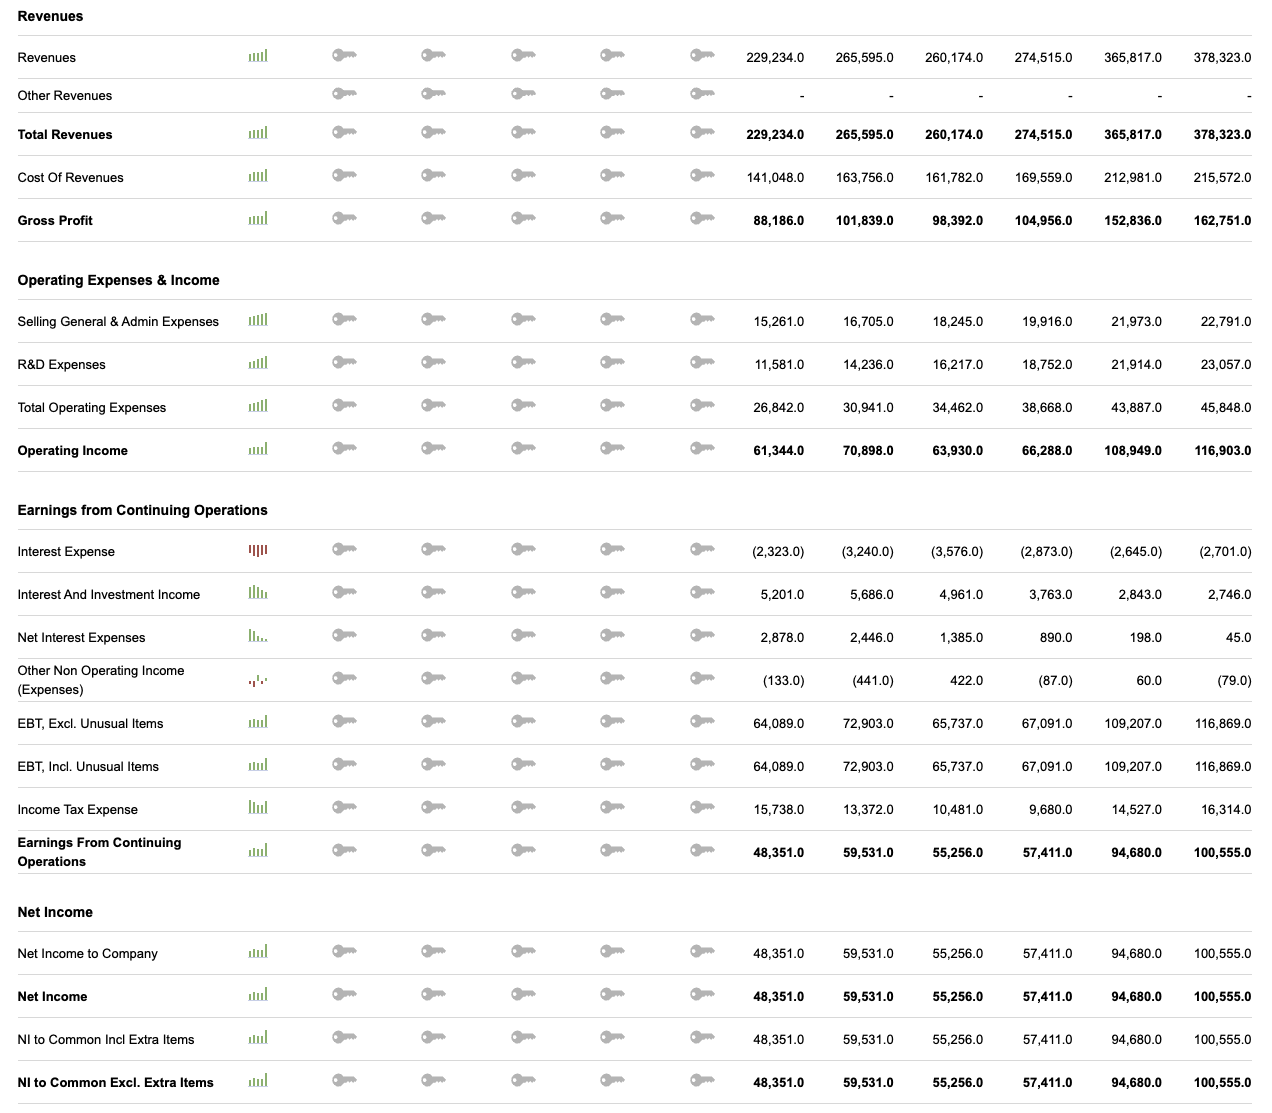 (Example of income statement)
The income statement reflects income, expenses, and serves as a basic profit and loss (P&L) statement.
The “bottom line” phrase commonly used to denote financial performance is a measure of income minus expenses. If income exceeds expenses, then the firm has a net income. It means the business has earnings and that it’s sustainable.
Sub-items included on an income statement include:
- Gross sales
- Net sales (Gross sales – Sales returns)
- Cost of Goods Sold (COGS)
- Inventories, Goods for sale, Additional purchases
- Gross profit
- Depreciation & Amortization
- Research & Development expenses
- General & Administrative expenses (rents, wages, utilities)
- Any irregular items
- Disclosures (e.g., disposal of PP&E, litigation settlements)
- Total expenses
Certain inputs above are arithmetically derived from other inputs:
Gross profit = Net sales – COGS
Total expenses = COGS + General & Administrative expenses
Earnings per share (EPS) are also placed on the front of an income statement due its importance in offering insight into a company’s profitability and general management performance.
It is equal to:
EPS = (Net income – Preferred stock dividends) / (Weighted Average of Common Shares Outstanding)
As reported on the income statement, two common forms of EPS are generally reported:
Basic: Earnings divided by common shares outstanding
Diluted: Earnings divided by all forms of shares that can be transformed into common stock, such as convertible bonds, stock options, warrants, and other forms of securities
The diluted version of EPS is generally preferred as all forms of stock are included and will naturally decrease EPS over the basic form.
Income statements will differ based on the type of company.
For instance, a manufacturing company may have three types of inventory while most firms will typically have one.
Moreover, banking has a business model based on interest rate spread and commissions, while insurance is profit is predicated on charging risk premium. In these cases, COGS is rarely applicable as they have very little to nothing in the way of actual goods.
Balance Sheet
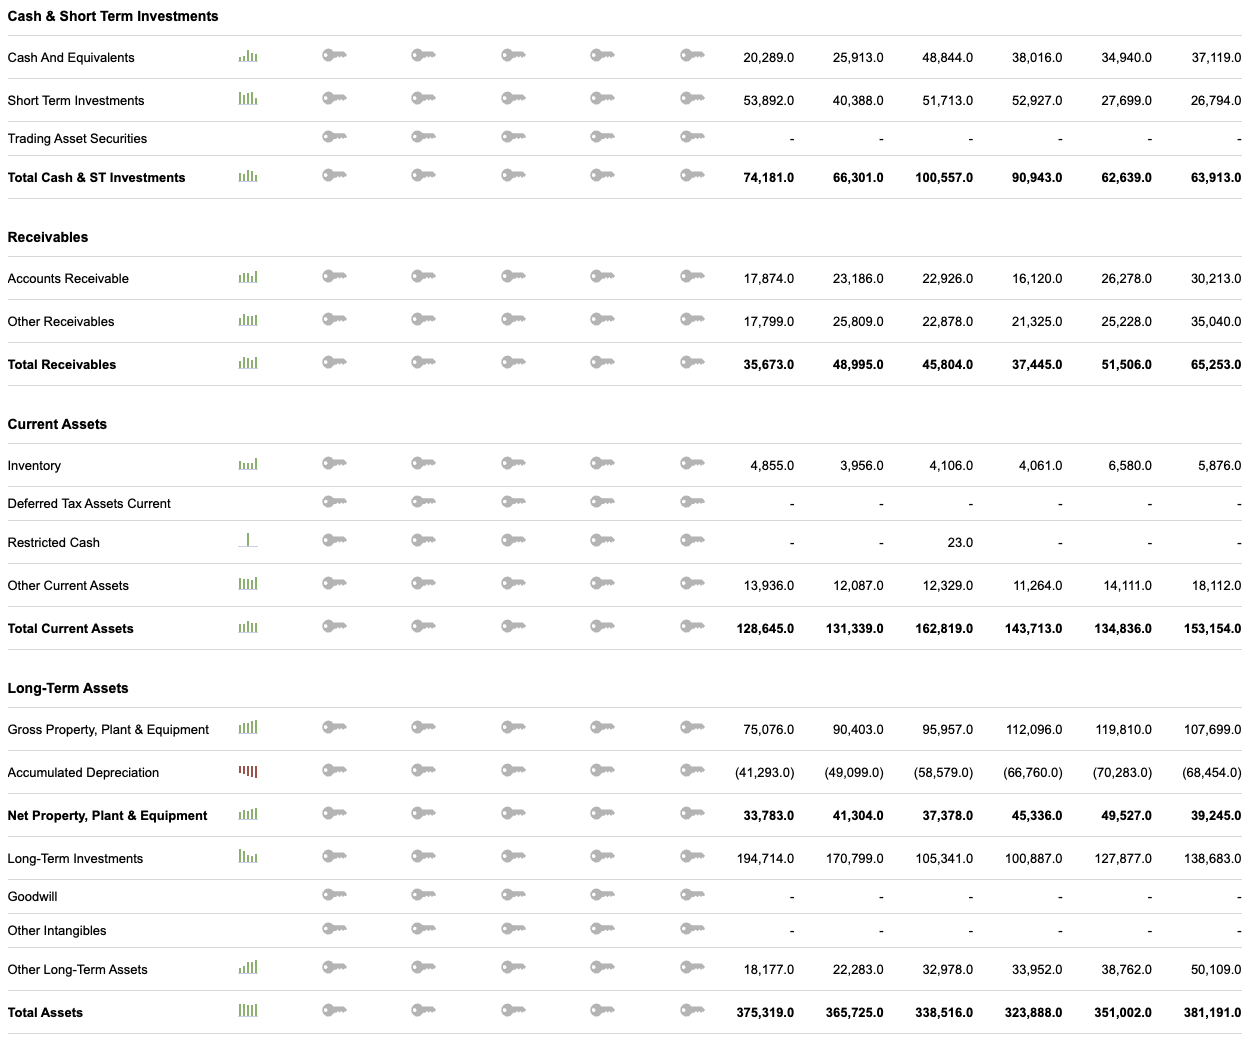
(Example of balance sheet assets)
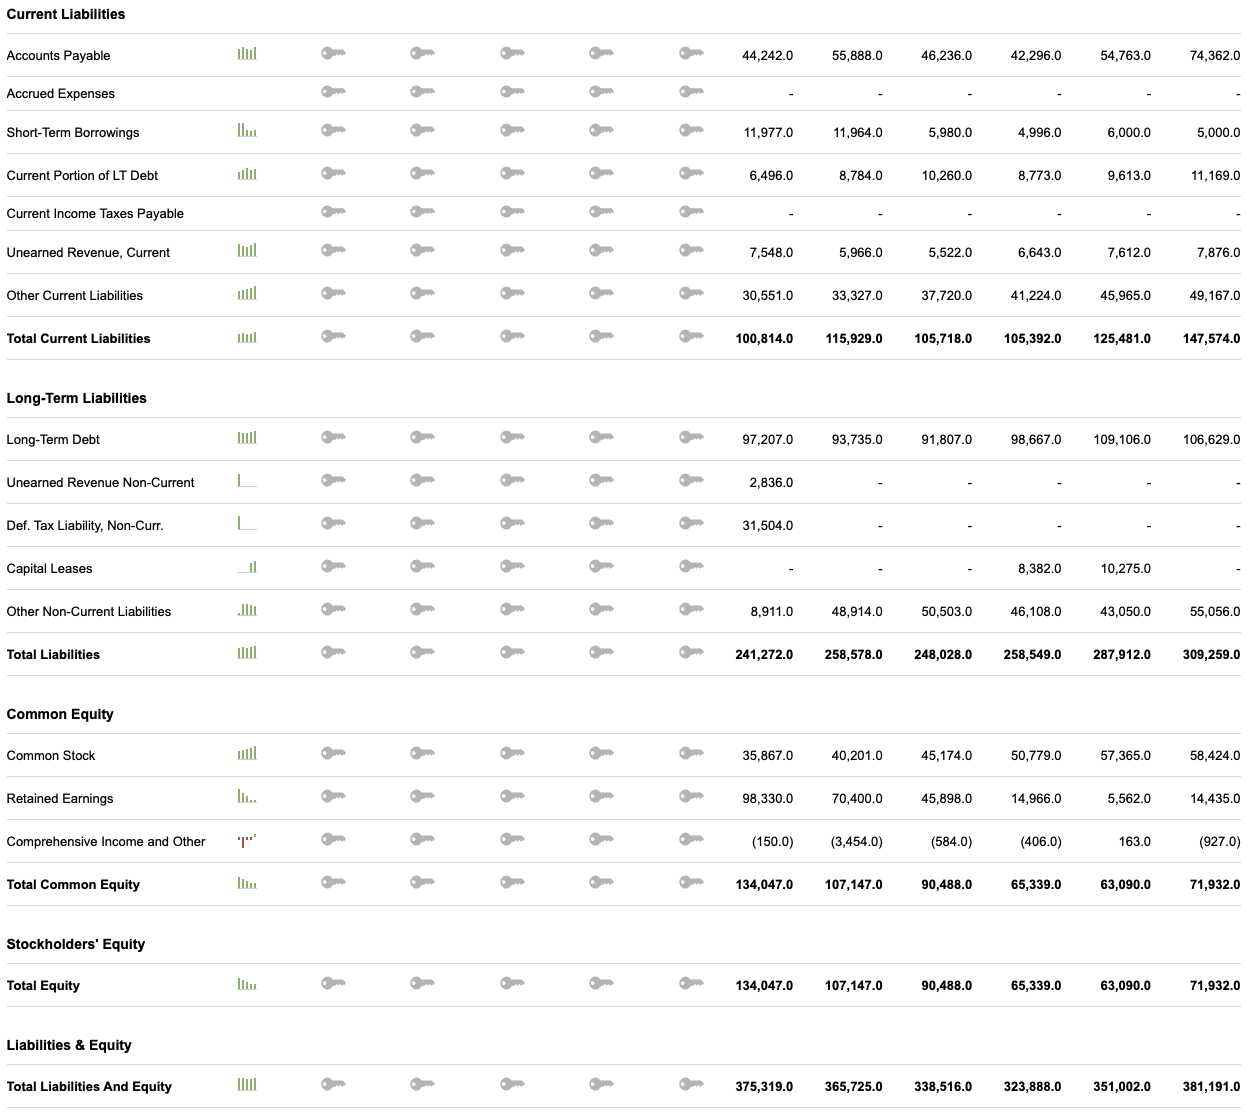
(Example of balance sheet liabilities)
The balance sheet features the assets, liabilities, and ownership equity in a company.
The figures listed on a balance sheet only apply to that particular point in time.
Of these main categories, the following sub-categories on a balance sheet may appear as:
Assets
- Cash and cash equivalents
- Accounts receivable
- Prepaid expenses
- Non-current assets
- PP&E
- Investments
- Biological assets (e.g., dogs in a police force)
- Financial assets
- Intangible assets
Liabilities
- Notes payable
- Accounts payable
- Financial liabilities
- Deferred tax liabilities and deferred tax assets
Owners Equity
- Capital stock
- Retained earnings
As a balance sheet, both sides must balance accordingly:
Assets = Liabilities + Shareholder’s Equity
The balance sheet is often the first thing one looks at when valuing a company, as it denotes exactly what a firm owns, owes, and how much is left over for owners, including shareholders.
It can shed insight on the foundation of a business. What is actually there that’s producing economic value and what are its liabilities?
A balance sheet also gives insight regarding working capital (current assets – current liabilities), which can feed directly into determining free cash flow measures, such as FCFF, in order to value a firm.
A firm with a low inventory turnover (COGS / Average Inventories) will need more working capital to work with (such as a machinery company). Firms with a high inventory turnover (e.g., grocers) need proportionally less.
Shareholder equity and book value are regularly confused with each other.
Shareholder equity is what is left over after liabilities are deducted from assets.
However, book value excludes intangible assets, so is essentially a measure of “net tangible assets,” or assets that exist in physical form. An intangible asset is normally a patent or brand name.
Financial metrics such as the debt-to-equity ratio are derived from the balance sheet, which derives the relative proportion of debt and equity that is used to finance a firm’s assets.
Or the current and quick ratios, which determine a company’s ability to pay for its current liabilities (assets / liabilities – current ratio includes inventories; quick ratio doesn’t).
Like the income statement, each balance sheet will be different for each company.
Some companies will have categories on their sheet that aren’t seen here, while others will have fewer.
Some will have, for example, accounting goodwill on the balance sheet.
This measures the premium that one company paid for another relative to the target company’s book value.
So if a company paid $50 million for a firm with a book value of $20 million. Accounting goodwill would equal the difference, which is $30 million.
Cash Flow Statement
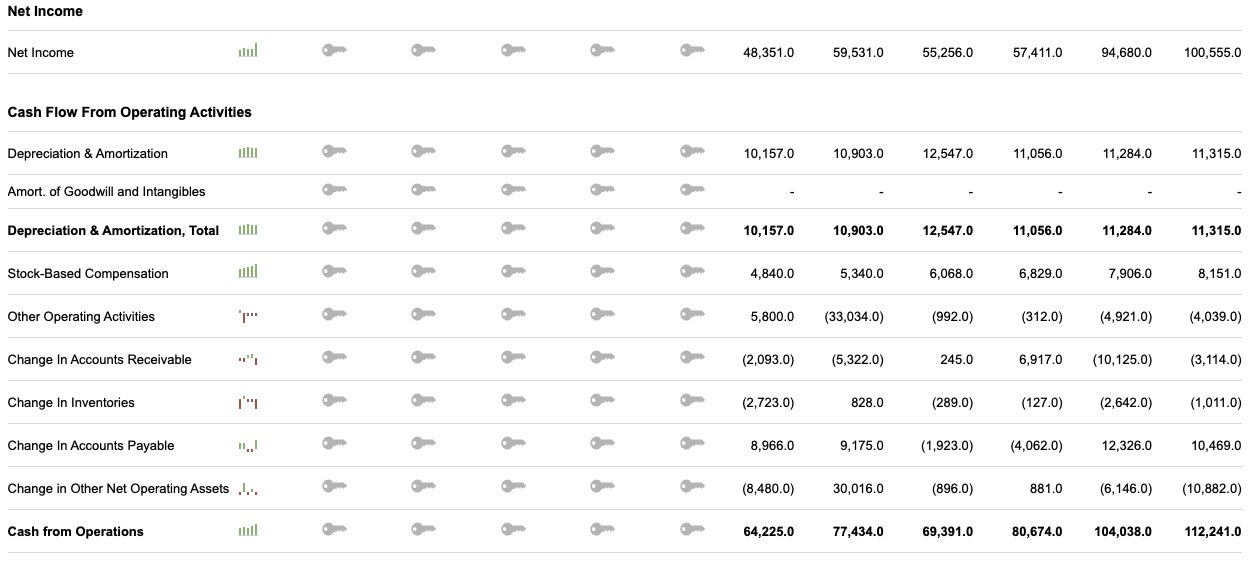
(Example of cash flow statement with cash flow from operating activities)
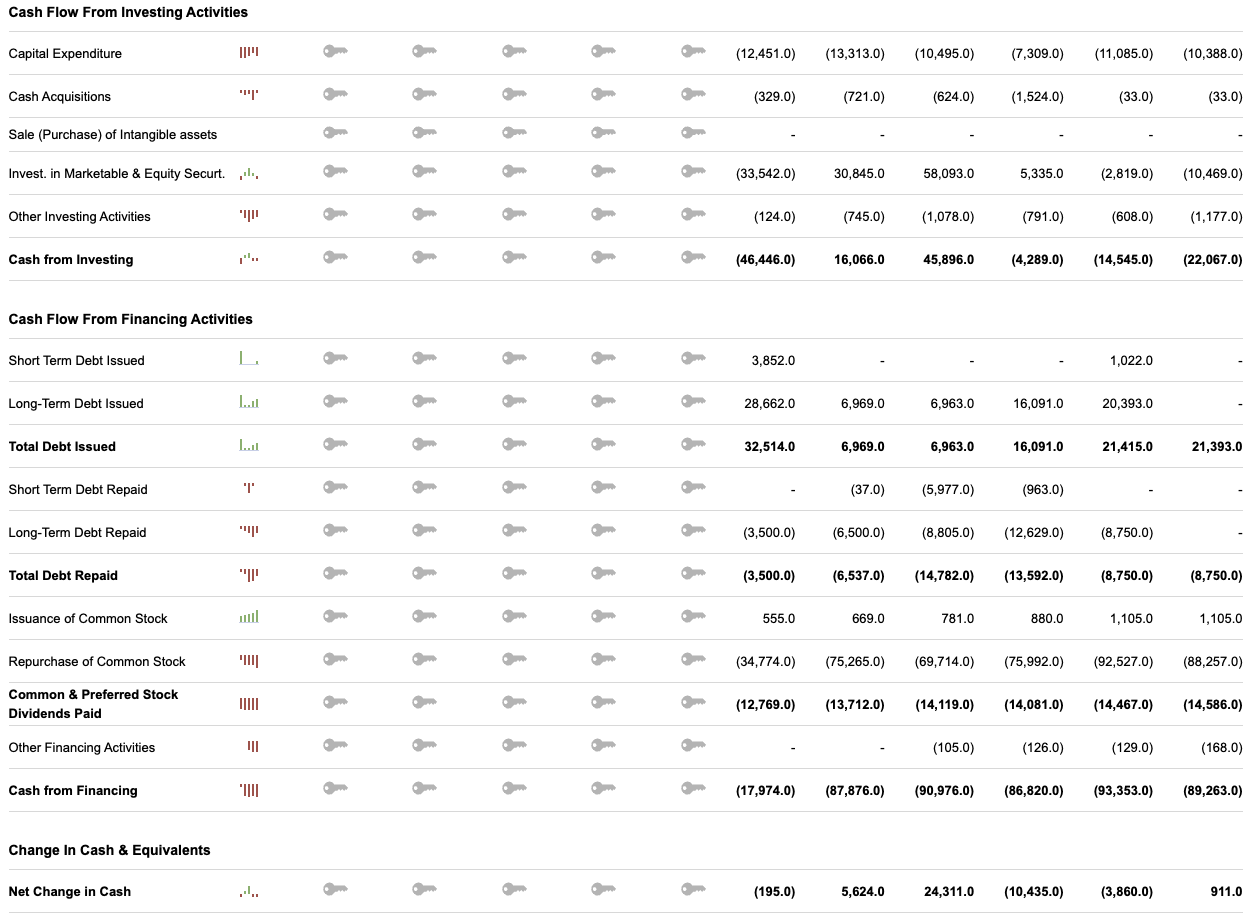
(Example of cash flow statement with cash flow from investing activities and cash flow from financing activities)
The cash flow statement measures a company’s liquidity, or ability to meet its financial obligations without incurring drastic losses.
The cash flow statement is divided into three categories:
1. Cash from operating activities
2. Cash from investing activities
3. Cash from financing activities
Any money that comes into the business is deemed an inflow; any going out is an outflow.
Cash flow is not the same as net income, given that the latter also includes noncash expenses, such as depreciation and amortization. Cash flow measures cash transactions only.
Cash flow can also be improved “artificially” in many cases.
A company can elongate the amount of time it takes to pay off its debts, accelerate the requirements by which it obtains inflows, or preserve cash by delaying the purchase of inventory stock.
These types of tactics could provide a boost to cash flow from operations.
Cash flow investing activities entails capital expenditures or the sale of capital assets.
This can also be manipulated through accounting procedures or business tactics as well, given that not all companies have an equal definition of what counts as a capital expenditure (i.e., money paid to acquire assets to improve the business).
Cash flow from financial activities reflects debt financing and the purchase and sale of stock.
The value provided in this category will be predicated on the company’s dividend policies, debt terms, or capital structure.
Cash flow as a whole helps companies measure the degree to which they can:
- expand
- make investments
- engage in product development
- reduce indebtedness, and
- project dividend payouts.
The results of the cash flow statement are among the most heavily looked at profile in accounting when it comes to evaluating that company’s health.
Measures of efficiency and higher net income are heavily reflected within the cash flow statement.
Investors and other companies looking to acquire others will look at the cash flow statement relative to the firm’s share price. The higher the cash flow relative to the share price, the better the investment outlook normally becomes.
(See: The Complete Guide to Cash Flow Analysis)
Conclusion
An income statement looks at a company’s financial transactions over a particular period of time, a balance sheet its set of financial resources and obligations at a particular point, and cash flow statement measures liquidity.
An income statement begins with revenue and then proceeds to subtract expenses until it arrives at the “bottom line” of net income.
It illustrates profitability based on transaction history. It captures this information over a specified time period, normally a quarter or a year.
The balance sheet reflects the assets, liabilities, and shareholder equity in a firm.
Assets constitute resources that a firm has, while liabilities denote the funding for these resources.
As implied, both sides of a balance sheet must balance, with assets being equal to the sum of liabilities and shareholder’s equity.
A balance sheet, by its nature, accounts for a “snapshot” of the company’s history, by showing this information at a particular point in time (usually the end of a quarter or year).
The cash flow statement expands on the cash portion of the balance sheet and reconciles the beginning of period cash balance to the end of period cash balance.
The statement typically begins with net income, adjusts for non-cash income and expenses involved in internal business activities to arrive at operating expenses.
And then proceeds to add cash flow from investing activities and cash flow from financing activities to form the complete cash flow analysis.
The business financials on the three statements provide many of the inputs seen in various investment banking financial models and these financial reports are used by professionals throughout finance to make investment decisions.