Asset Allocation: The Math Behind Diversification


Diversification through strategic, rather than tactical, asset allocation is the most important thing you can do to win in the markets over the long-run.
It’s more important than focusing on what to invest in and more important than focusing on your targeted absolute level of returns.
For individual investors who play the markets, most of their wealth is generally tied up in stocks, either individual companies or stock indices. Moreover, they tend to be tied to their domestic stock market in companies they’re most familiar with (whether because of products they own or are familiar with through marketing or second-hand experience).
Even if they choose stock indices that supposedly provide diversified exposure, all stocks are tied together by a certain type of environmental bias.
Each asset class does best in a certain setting.
- Stocks and corporate credit do best when growth is above expectations and inflation is moderate and/or stable.
- Government debt (fixed or nominal rate debt) of reserve currency countries does best in periods of disinflationary recession.
- Commodities and inflation-linked bonds do best during periods of higher inflation.
- Cash does best when money and credit are tight, and so on.
The risk-adjusted returns of portfolios concentrated in a certain type of asset class are inefficient.
They can provide greater right-tail exposure (i.e., higher potential gains) but left-tail risks that are often asymmetric.
Traders and investors that can balance asset classes well such that portfolios can do well in any environment are going to increase their return per unit of risk better than anything else they can practically do.
Limiting drawdowns
Limiting drawdowns is critical. The bigger the hole you dig yourself in, the harder it is to get out of.
This is because the percentage gain needed to get back to breakeven is greater.
If you have a 10 percent drawdown, it’s manageable. You need an 11 percent gain to get back.
If you have a 20 percent drawdown, you need a gain of 25 percent.
Once you get beyond that, it gets more difficult to do. For professional money managers, who typically have clients that care a lot about short-term performance, a 20+ percent drawdown can be a career killer.
On top of that, equity markets typically decline by more than 20 percent during recessions or heading into them.
Certain concentrations within equity markets – e.g., tech, real estate, emerging markets – with some managers specializing (or simply having bias toward certain asset verticals) can make those drawdowns even sharper.
To make matters worse, leverage is commonly employed. Without the proper risk controls, even a well-diversified equity portfolio on leverage can see very large drawdowns (>50 percent) in a short period of time.
For an individual investor, it’s the type of drawdown that can alter important life decisions, such as when one could feasibly retire.
The relationship is non-linear. The bigger the drawdown, the greater the corresponding gain needed just to get back to breakeven.
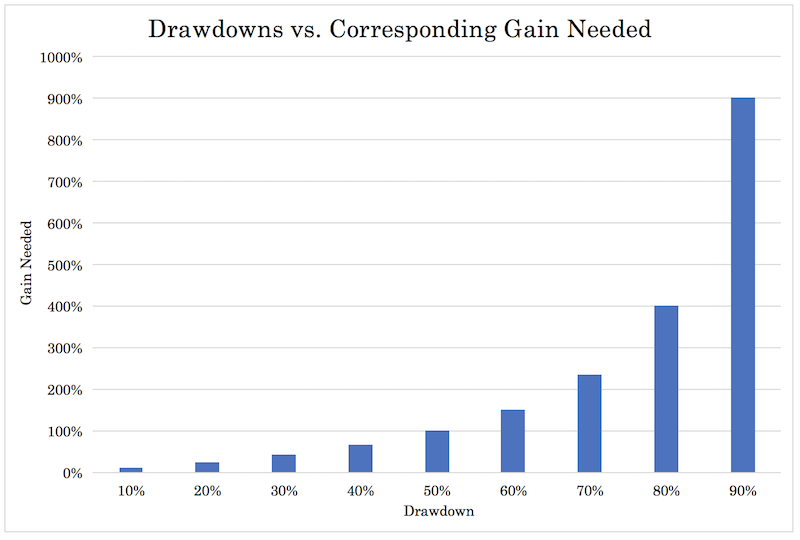
In tabular format:
| Drawdown | Gain Needed |
| 10% | 11% |
| 20% | 25% |
| 30% | 43% |
| 40% | 67% |
| 50% | 100% |
| 60% | 150% |
| 70% | 233% |
| 80% | 400% |
| 90% | 900% |
Wealth shifts more than it’s destroyed
Concentration in anything is dangerous. Everybody’s favorite asset class (whether that’s stocks, bonds, gold, real estate) is going to decline 50 to 80 percent at some time during their lifetime.
If we look at the total global loss in economic activity going back the past 150 years or so, recessions tend to be relatively shallow in comparison to the total losses suffered by equity markets.
The 2008 financial crisis, which produced a recession that lasted until mid-2009 in most developed markets, saw a total global loss of activity of just under 3 percent despite equity market losses of 50 percent or more in the US and various other countries.
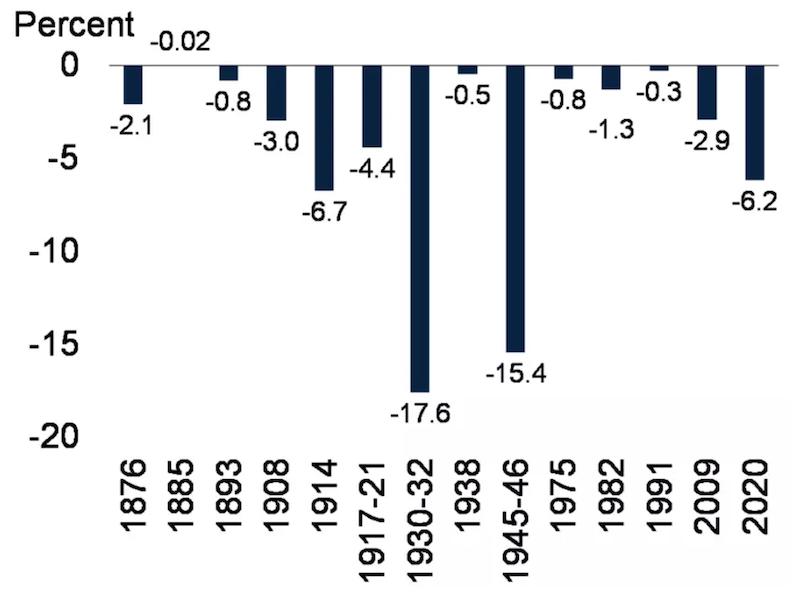
(Source: World Bank)
Why do equity markets lose so much relative to the level of economic activity?
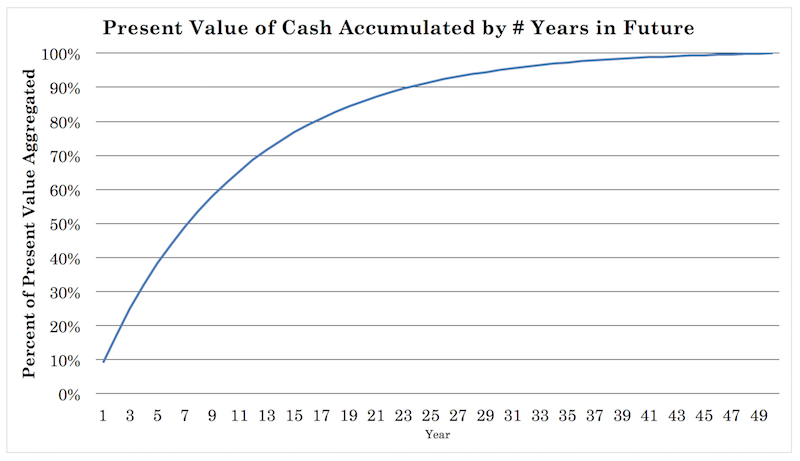
It has to do with the present value effect, or the process on which future cash flows are discounted. Markets go from discounting a certain level of earnings being produced to a lower level.
This change in the expectations rates their prices downward. Losses of income in the present are more deleterious to stock prices than expected losses of income further out.
Outside of earnings and economic growth concerns, people often run into cash flow problems in recessions. That causes them to sell off assets to meet their debts and other expenses. Stocks become compressed further.
Stocks do well in an environment where growth is above expectation. When this environment isn’t there, capital flows into other asset classes seeking safety and liquidity.
Wealth isn’t destroyed so much as it shifts.
It shifts between asset classes, between countries, between currencies, and between fiat and non-fiat sources of wealth.
If you’re only in stocks (or any other asset class, country, or currency) and you don’t have anything else to “catch” shifts out of it, then you will inevitably have very large drawdowns.
Even a very simple portfolio with a mix of stocks (30 percent), a mix of US fixed income (60 percent), and gold (10 percent), represented by the blue line, has done a much better job of limiting drawdowns than an all-stocks portfolio (red line).
Simple US diversified (Portfolio 1) vs. US stocks only (Portfolio 2)
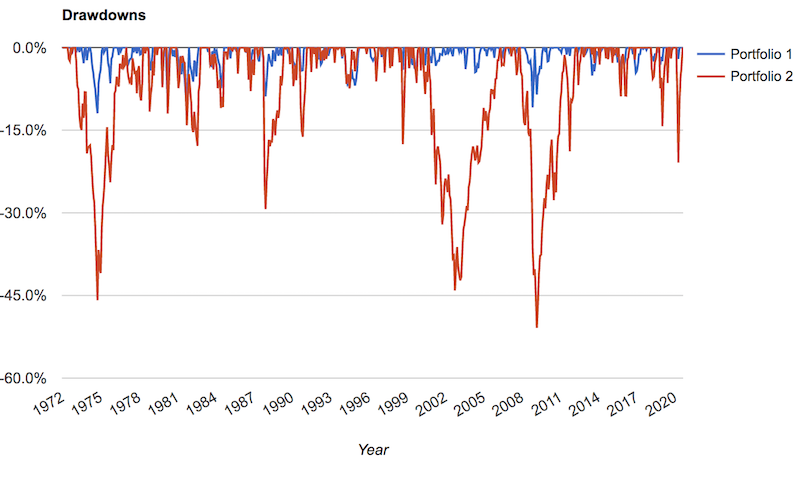
Any drawdowns will be much shallower; volatility and left-tail risk will also be lower by a factor of 2x-3x just based on that simple mix.
Won’t returns be lower?
Yes, but a portfolio leveraged to match the returns of the equity market will display superior reward-to-risk. Or the same risk but higher returns. Because you’re getting more return per each unit of risk.
Any time there’s a shift out of something it can disperse to many other asset classes, geographies, and currencies that are deemed to be more hospitable to the right mix of returns relative to the risks.
Learning how to blend well among all those factors is key to systematically improving return relative to the level of risk taken on.
Having a portfolio that’s well-balanced and can do well in a variety of economic environments and limit drawdowns is important. Otherwise one is going to spend too much time simply trying to earn back money that was lost in previous drawdowns.
For novice traders, they’ll likely never be able to make it back trading the markets, so that means earning it back through their day job and/or getting knocked out of the markets altogether.
We have an entire article dedicated to the subject of having a strategic asset allocation in ‘How to Build a Balanced Portfolio’, so we’ll defer to that on explaining the general process, in addition to others:
- Building a Balanced Portfolio with Options
- Building a Balanced Portfolio with VRP Overlay
- Balanced Beta: Efficiently Balancing Risk, Not Capital
- Simple Portfolios: Improving Outcomes by Simplifying
- The Barbell Portfolio Strategy
- How to Improve Risk-Adjusted Returns
Diversification relationships
Reducing your risk by combining uncorrelated assets follows an elegant mathematical relationship.
There are three basic variables:
i) The returns expectations and volatility characteristics of each asset or return stream
ii) The correlation between and/or among each of the assets or return streams
iii) The number of different assets in the portfolio
The greater the number of assets or returns streams and the lower the correlation among them, the more one’s risk is reduced per unit of return.
Using basic matrix multiplication, we can figure out this relationship mathematically and represent it visually.
Examples
Let’s say you have assets in a portfolio and each has the same returns and volatility characteristics.
Let’s assume each has a 5 percent annual returns expectations and their annualized volatility is 15 percent (as represented by standard deviation or a similar volatility metric).
How many of these assets would you need to keep your same returns but cut your risk in half?
Only four.
When correlation is zero among the assets – i.e., they each provide returns streams independently – the relationship follows a square root type of pattern.
However, when you increase the correlation among assets, the number of returns streams you need to achieve the same diversification effect gets higher. Sometimes getting a certain level of risk reduction from diversification becomes impossible when the correlation between and among assets increases.
If the correlation between assets is increased to just 25 percent, not even the addition of 25 different returns streams to a portfolio would cut risk in half.
That’s why it’s important to have truly differentiated returns streams, as difficult as they are to achieve. Most forms of income are dependent on or highly correlated with a healthy economy.
So even if you own tech stocks, energy stocks, utilities stocks, and various forms of different businesses, they’re all in large part driven by the overall credit cycle.
The source of the cash flow might be different. But even that’s tied together by aggregate economic activity.
As a trader or investor, you have a unique advantage over other industries in that you can short-sell markets. You can bet on prices going down.
In other businesses, it’s hard to do this. If you’re in manufacturing, e-commerce, services, or whatever it might be, you’re largely subject to the cycle in some form, some industries more than others.
If you’re a trader or investor and have this latitude, you can avoid having these implicit biases toward bull (or bear) markets in anything.
But at the same time, short-selling is also hard to do. You’re effectively paying away risk premium.
Moreover, management teams are always in control of the narrative. Sell-side equity research (largely relationship managers for the investment banking division) also have a bullish bias to help win business and keep positive relationships.
Central banks want asset prices to go up. They’re going to target an inflation rate of at least zero.
They create money by fiat, can adjust incentives to stimulate credit creation, can buy assets directly, and monetize government deficits.
Some investors run a hybrid long/short fund, such as a 130/30 fund or 150/50 fund. These approaches short-sell assets equal to 30 and 50 percent of the portfolio’s value, respectively, and uses the cash that’s effectively borrowed from the short sales to develop long exposures of 130 and 150 percent of the portfolio, respectively.
They both net out to 100 percent exposure, but with separate long and short books.
Even some well-known short sellers use a type of approach where they’ll go long the market 2x, then put the intellectual capital into the short side, to net out to about 100 percent long exposure. The alpha generated is then a function of how well the short picks pan out relative to the benchmark.
For example, if the market goes up 10 percent in a year and the short book loses 6 percent (i.e., the stocks sold short went up 6 percent), then 400bps (4 percent) of alpha was created. The total return for the 2x long/1x short fund would be 2*10 percent minus 6 percent = 14 percent (i.e., the +4 percent over the benchmark).
Some short funds are dedicated short sellers and do short-selling only, but it’s a hard model to make work.
And these funds often short-sell assets with lower interest rates or yields and get more long the higher yielding assets. This has the effect of increasing their risk beyond their benchmark because naturally lower yielding assets are typically less risky than those with higher yields.
Moreover, regardless of the nature of a financial asset or where its cash flow is derived from, they’re all influenced by interest rates. That’s ultimately what financial assets are driven by at the most fundamental level.
As an investor, you’re putting up a lump sum payment for a future cash flow.
The price of an asset is just the series of future cash flows discounted back to the present. For a stock, whose durations are theoretically perpetual, that means the present value of the sum of its future cash flows over the next 40-50 years (with the bulk of said present value from the next ten years):
Most stocks, in reality, are about 75 percent correlated to each other. That means owning a bunch of stocks doesn’t provide much in the way of diversification.
During the Great Depression, the collective US stock market dropped 89 percent peak to trough.
During the 2008 financial crisis, the S&P 500 (over 500 stocks, counting companies that had more than one class of shares included), dropped 51 percent, going from the October 2007 top to the March 2009 bottom.
The NASDAQ crash of 2000 dropped the tech-heavy index 80 percent.
It should also be noted that the stock market is representative of the most well-capitalized companies. They tend to be more diversified and well-entrenched.
Visuals
To help visualize the relationship between correlations, the number of assets, and the effect on reducing your risk, we’ll go through some graphics.
This presumes that each bet size is equal to one another.
Zero percent correlation
If the correlation between assets is zero, a fairly clear relationship develops.
If you have four equal-returning, equal-risk assets, you cut your risk in half without reducing your return.
If you have nine equal-returning, equal-risk assets, you cut your risk by two-thirds without reducing your return.
If you have 16 equal-returning, equal-risk assets, you cut your risk by 75 percent (three-fourths) without reducing your return.
If you have 25 equal-returning, equal-risk assets, you cut your risk by 80 percent (four-fifths) without reducing your return.
As you will notice, all of these chosen numbers (4, 9, 16, 25) are all perfect squares and give a clean percentage in terms of the risk reduction.
Graphically:
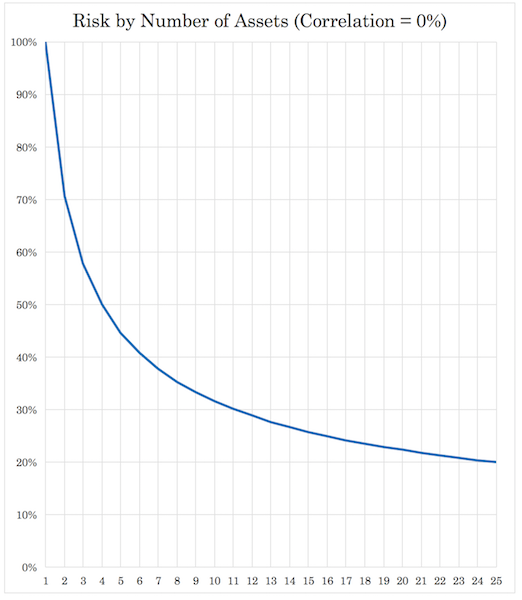
The implication is that if you have, for example, 15 different returns streams that are each uncorrelated to each other, you can improve your return to risk ratio by a factor of about 4x.
If you have 15 returns streams that expect to give you 5 percent annualized returns, and their return volatility is 15 percent, that means your return stays at five, but your risk is cut by about 75 percent, or down to about 4 percent.
That also gives you compelling strategic engineering opportunities.
In our article on building a balanced portfolio, this process involves diversifying among different assets, within asset classes, by geography, by different currencies, and by different durations (i.e., the maturity length of an investment).
That post dealt with diversifying with respect to betas. Betas simply mean different asset classes (bonds, equities, commodities). There are only so many different asset classes, so having truly differentiated investments is hard after a certain point.
Accordingly, you can realistically reduce your risk by about 60-70 percent with this approach.
When you diversify with respect to alphas, or taking returns wherever they are, long or short, or whatever the trade structure in and between any asset class, your diversification opportunities are much higher.
However, this comes with the reality that betting on what’s going to be good and bad is very difficult to do, so most investors probably shouldn’t take alpha risk (i.e., betting tactically). Most will try regardless, but without a systematic approach relying on cause-and-effect, it’s a very difficult thing to do long-term.
Having a great strategic asset allocation is the most realistic way they can win in the markets over the long-run.
25 percent correlation
When assets are correlated 25 percent, those four assets that cut your risk in half when they aren’t correlated, now just cut your risk by 34 percent.
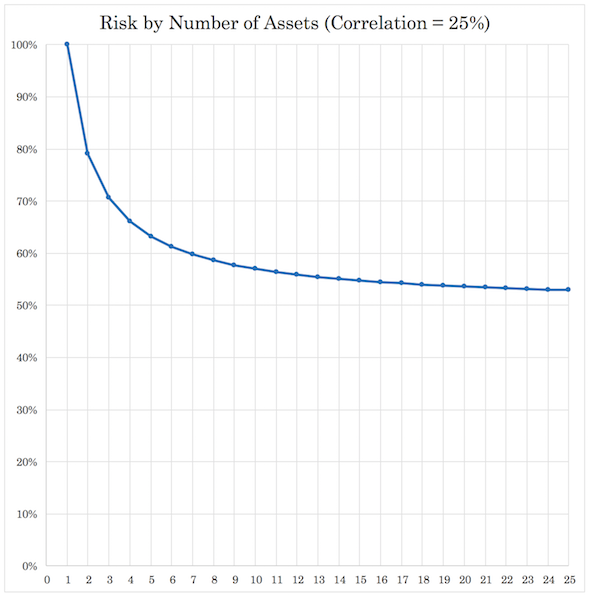
Nine assets cut risk by only 42 percent instead of 67 percent. That’s already a difference of 25 percent.
Sixteen assets decrease risk by 46 percent (not much difference from nine) instead of 75 percent.
Twenty-five cut it by 47 percent (an improvement of only one percentage point) instead of 80 percent.
The biggest difference is that the marginal benefit of diversification decreases markedly once returns streams become correlated to each other.
When returns streams are differentiated the marginal benefit of diversification is more robust. When they become correlated the incremental benefit decreases, also in a non-linear way.
50 percent correlation
As one would expect, going from 25 percent to 50 percent correlation also sees a large drop in the incremental advantage of diversification.
Four equal-returning, equal-risk returns streams correlated at 50 percent among each other would reduce risk by just 21 percent versus the 50 percent when non-correlated.
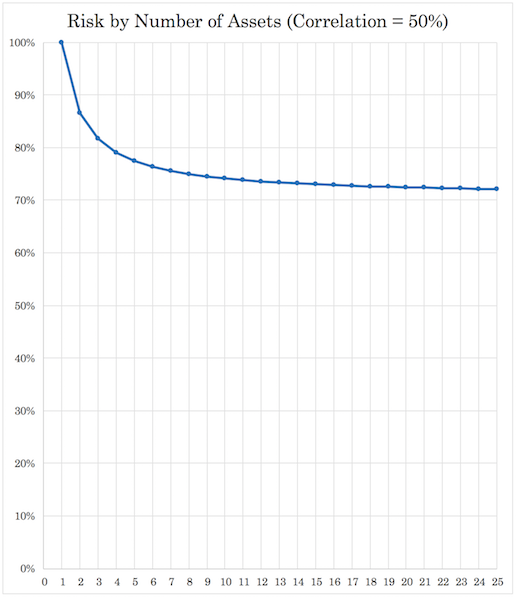
Nine cuts risk by 25 percent (versus 67 percent for zero correlation).
Sixteen cuts risk by 27 percent (versus 75 percent).
Twenty-five cuts risk by 28 percent (versus 80 percent).
Going from nine assets to 25 assets, a huge jump, reduces risk by only three percentage points. Adding a bunch of semi-correlated assets doesn’t provide much in the way of real diversification.
75 percent correlation
75 percent correlation among assets in a portfolio is similar to holding a portfolio of stocks.
While the business models and cash flows of various companies are different, they are all dependent on interest rates, overall economic activity, and subject to aggregate investor behavior.
Even if companies are fundamentally fine, when investors themselves encounter cash flow issues, they need to sell assets in order to meet their obligations. So, even if you’re holding a “diversified” index fund or the like, stock prices tend to go down collectively even when the fundamentals among them are very different.
But during crashes, assets whose fundamentals are otherwise fine get hit.
Jeff Bezos said the following about his company as it pertained to the dot-com crash in 2000. Amazon’s stock (AMZN) fell down to $6 per share by the following year despite internally improving fundamentals:
“I had all the internal metrics on how many customers we had and I could see. People thought we were losing money…. I just knew it was a fixed cost business, and as soon as we reached a sufficient scale, we would have a very good business… That understanding of the fixed nature of our expenses, relative to physical retail, is what led us to have the ‘get big fast’ strategy. We knew that our economics would be improved if we had sufficient scale.”
The gist is that even when the company internally was getting stronger, the stock still got trampled by investors fleeing to the exits in the crash.
Four assets correlated at 75 percent provides just a 10 percent risk reduction, versus 50 percent for four zero-correlation assets.
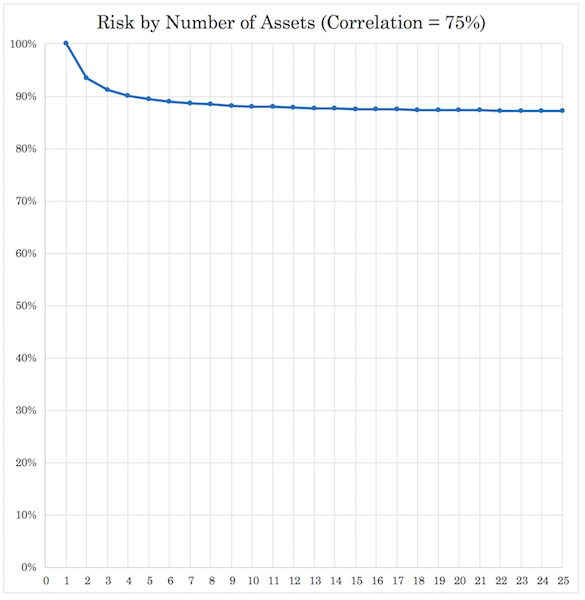
Nine provides 12 percent reduction (versus 67 percent for nine at zero correlation).
Sixteen also cuts risk by just 12 percent (versus 75 percent).
Twenty-five cuts risk by 13 percent (versus 80 percent).
As you can see, the risk reduction curve flattens very quickly as the marginal benefit virtually disappears. By the fifth asset, the marginal benefit to risk reduction is less than one percentage point.
The reality is even if you add 1,000 returns streams at 75 percent correlation, you’re not reducing your risk by very much at all.
That’s why single broad index funds and ETFs don’t actually provide much in the way of true diversification.
These contain a lot of different assets. But stocks are heavily driven by the same type of cause and effect linkages regardless of the type of business they engage in. Stocks typically rise and fall together even if the nature of the cash flow is very different.
They are heavily tied to the credit cycle. And in terms of contemporary factors, interest rates can’t be lowered anymore to offset the drop in earnings.
For those running equities portfolios, this is the type of relationship they’re looking at.
Moreover, the equities market is one of the most difficult markets to generate alpha in, and the alphas are linked to the betas. Throwing in additional stocks past a certain point isn’t going to diversify the portfolio much more.
Warren Buffett says he doesn’t like diversification. For him, as someone with wealth heavily tied to large capitalization US equities, diversification won’t do him much benefit in the sense of boosting reward to risk. Returns are more tied to making good stock picks, which isn’t easy to do.
Outsized returns among managers specializing in the equity markets are typically from taking on greater-than-normal risk.
In addition, once a portfolio is at a very large size, market-beating returns become difficult to achieve because position sizes start taking up a non-immaterial fraction of the market for each security.
For any entity managing tens of billions of dollars, taking larger stakes in small cap companies would effectively mean owning them. In other words, they start becoming the market itself. This is why alpha funds (those trying to beat the market) have to cap their size, as alpha has limited capacity.
Asset Allocation: A Practical Application
If you can find 15 quality, truly non-correlated returns streams, that each have about equal return and equal risk, you can improve your return to risk ratio by about 4x.
There’s a level of math to it where your marginal risk reduction from the effects of diversification are the most beneficial at first, then slow from there. (And of course are still large in the early stages if correlation is very low.)
If you go from one to two non-correlated returns streams, you cut your risk by 29 percent without reducing your return.
If you go from one to three non-correlated returns stream, you cut your overall risk by 42 percent (again, without reducing your return).
Four uncorrelated return streams cut your risk in half.
If you go out to 10 return streams, you’ve cut your overall risk by about 68 percent.
Out to 15 returns streams, about 74 percent, or a factor of about 4x.
On the other hand, if you’re in a portfolio where you own 25 stocks, you’re reducing your risk by only about 13 percent. If you have one thousand stocks, you’re reducing your risk by about 15 percent. Even after 4-5 returns streams, your marginal benefit is less than one percent.
Having a structure to the portfolio
How you approach trading or investing has to have a certain structure to it. If you’re trading in and out a lot you’re basically chasing pure alpha. That’s hard to do.
If you’re long, buy and hold, and following broad asset classes, you’re taking beta risks.
Many will take a combination of both alpha and beta.
Most investors should approach it in the sense of structuring their portfolios assuming the future is unknowable (i.e., more toward beta risk, which you can feel pretty comfortable with taking, knowing that financial asset classes will outperform cash over the long term).
Many investors always want a “hot tip” or they want to know what the best things to trade or invest in are. That’s probably not going to accomplish much. For most, it will cause them to lose.
Moreover, what’s known is already discounted in the price. And the list of unknowns are large relative to what can be known in relation to this, which makes playing the financial markets hard to do.
Instead, they should think about what their “risk neutral” position is.
How does a portfolio achieve balance? How does it achieve balance in a way that maximizes reward to risk?
If you can get these 10-15 quality returns streams that are uncorrelated you’re going to be reducing your risk by around 70 to 75 percent from the typical portfolio.
What’s correlation?
The words “correlation” and “uncorrelated” have been used a lot in this article, so it’s important to clarify what those mean.
They don’t mean the classic sense of correlation in terms of a coefficient or a percentage – for example, that stocks and bonds are X percent correlated.
This is backward-looking.
Instead this means what are they intrinsically like?
What drive their returns (and risks) and how does their value behave in response to certain variables, such as movements in the expectations of growth and inflation?
Correlation coefficients are fleeting byproducts of these relationships and are inherently unstable.
If you have, for example, a stock portfolio, a bond portfolio, own timber land, real estate, a web-based business, trademark rights, gold or precious metals, you’re spread among different currencies, and so on, how do all those assets behave?
Are they alike or are they different?
If you think of previous crises like 2008:
- How did they do through them?
- Did their value move around a lot?
- Did it impact how much cash you could generate from them?
- Did some assets “zig” while others “zagged”?
- How did the overall value of the portfolio shift?
- Did it largely at least hold steady or did it result in painful drawdowns?
- What more can you do to improve your return relative to your risk?
Final Thoughts
Most investors are biased to be long their own stock market, which leaves them with a poorly diversified portfolio subject to large drawdowns.
Most investors should think less in terms of what type of specific asset or thing can I invest in that’s going to be good.
Instead more of the focus should be placed in terms of how can I structure my portfolio in a way that gives me an excellent asset allocation mix that doesn’t bias my portfolio to outperformance or underperformance in any given environment?
In the markets, what you don’t know is always going to be greater than whatever it is that you do know.
It also takes a certain level of self-awareness and humility to know what you don’t know. The most inexperienced traders and investors paradoxically tend to be the most confident because they simply don’t know enough to realize what they’re missing. (See: Dunning-Krueger effect)
Accordingly, dealing well with the inherent uncertainty in trading markets is best done with strategic diversification and differentiated returns streams.
This also has applications for safely engineering a portfolio to targeted levels of return and risk.
If investors can efficiently create better optimized portfolios where they’re improving their return to risk ratio by 2x to 5x what they would under the traditional management approach, they achieve:
- the same returns at less risk
- better returns at the same risk (through leverage or leverage-like techniques), or
- some permutation thereof
For example, let’s say an investor has ten assets or returns streams he wants to invest in. Each returns 4 percent annualized (expected) and has 12 percent annualized volatility.
If each of them is uncorrelated to each other, he reduces his risk by a factor of 3x, following the relationship we discovered above.
He keeps the same 4 percent return but cuts his risk down to one-third of that 12 percent, or 4 percent.
Now he has a portfolio that yields 4 percent return at 4 percent annualized volatility. Now he is free to engineer the portfolio to his target risk or return threshold.
If he wants 10 percent annual returns, he can borrow 1.5 dollars for every one dollar of his own equity. In other words, for every $4 he puts up of his own money, he can borrow $6 ($10 total) and have a 10 percent return at 10 percent annualized volatility – assuming he is content with that level of risk (and borrowing costs are basically free).
Being able to diversify well and having a strategic asset allocation mix is critical for long-term investment success.
Even from a trader’s mindset, starting with a “risk neutral” asset allocation and making tactical deviations from that point is a prudent means of thinking about how to strategically and consistently make money from the market.