Valuing Synergy in the Mergers and Acquisitions Process


Synergy measures the degree to which two firms function more efficiently or more profitably relative to how they perform as individual entities.
The idea behind synergy is one of the central purposes of completing a merger in the first place.
If the two corporations aren’t more profitable or better off in some fashion together, what would the point of the business union be to begin with?
Companies merge and acquire other companies to:
- cut costs
- increase revenues
- combine technology
- talent, and
- generally enhance the efficiency process
Finding synergy in a merger or acquisition
There is a basic 6-step process to deriving the value of synergy in a merger.
There are many M&A accretion/dilution models that use synergy as an input, but they don’t state how that was derived mathematically.
It was just basically there, as that model’s focus was to give us a basic understanding of how various inputs affect the level of accretion/dilution and to give us a basic mental roadmap of how all the pieces flow together.
But given synergy is such an important part of an M&A deal, it deserves an article of its own.
Evaluating the level of synergy in a merger follows a six-step process:
1. Each firm is valued separately by projecting future cash flows, terminal value, and discount rate(s) to obtain a value for the firm.
2. Combine the value of each firm by adding the present cash flow values of each company. No synergy is assumed at this point (i.e., 1 + 1 still equals 2, not 3.)
3. Derive a cash flow statement for the combined firm by adding up the items from their income statement and balance sheet.
4. Determine how the synergy will be derived – more revenue, lower costs, or both.
5. Put the synergy in dollar terms.
If in the form of more revenue, synergy can be expressed through a higher growth rate.
If in the form of cutting costs, this can be reflected on the combined cash flow statement.
6. Calculate the combined value of the firm including synergy and subtract the amount found in step 2. This is the maximum amount of premium that should be paid as part of the takeover.
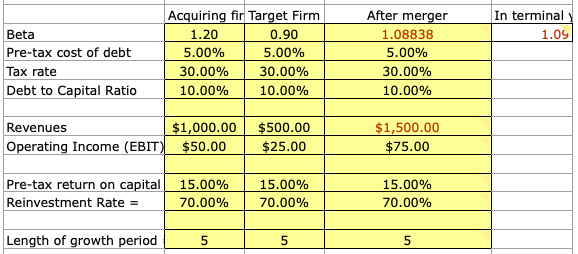
The spreadsheet, designed by Aswath Damodaran and linked here (‘synergyvaluation.xls’ on the spreadsheets page), measures the following criteria on both the bidding and target firm:
-
-
- Beta
- Pre-tax cost of debt
- Tax rate on income
- Debt to capital ratio
- Revenues
- Operating income (EBIT)
- Pre-tax return on capital
- Reinvestment rate
- Length of the growth period
-
 The standard capital asset pricing model (CAPM) fundamentals are needed as the most basic inputs:
- Current risk-free rate (i.e., cash rate or 10-year bond yield are good proxies)
- Risk premium
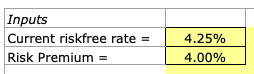
This is used to calculate the cost of equity, which is the discount rate used to calculate the present value of free cash flows.
This makes the assumption that there are zero excess returns beyond your high growth phase, and that stable growth rate = risk-free rate.
The model will take all this information and calculate synergy benefits – from revenue, cutting costs, or both.
And lastly, we have a small cash flow table (free cash flow to equity (FCFF) given we are using the cost of capital as a discount rate – if cost of equity, we would use FCFE), for the bidding company, target company, both companies together without synergy, and both companies together with synergy.
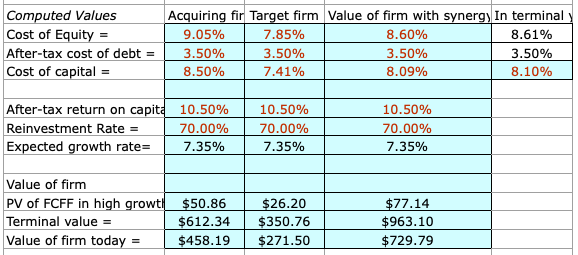
From here, we can determine the gains made from synergy by looking at the difference between the cash flow readings of both companies combined with synergy and without synergy.
How Various Inputs Might Impact Synergy in an M&A Deal
Let’s take a look at how different variables might impact synergy.
The model we looked at above had the variables that it had.
But other synergy models you might encounter will have other variables as well.
Revenues
An increase in revenue for both firms increases synergy between the two, as it helps increase the scalability of the business (e.g., greater financial flexibility to invest).
Operating expenses as a % of Revenue
In this case, there is no binary distinction – e.g., that more is better or less is better. There is some level at which operating expenses as a percentage of revenue are optimized. Operating expenses as a whole refer to expenditures paid out for a business’s everyday activities, but unrelated to the costs of production for goods or services.
These include the cost of goods sold, and selling, general, and administrative expenses. As a fraction of income, these cannot be 0%, but they can also not be 100% as well. There is some middle ground.
Tax rate
The lower the tax rate for each firm, the greater the synergy should they merge. Lower tax rates help a firm through basically every accounting or financial assessment metric, as it naturally provides them more revenue, profit, or cash flow in some manner.
Interest expenses
The lower the interest expenses, the greater the synergy. Firms with lower expenses will have higher synergy (everything else held constant) due to higher cash flow.
Depreciation
Depreciation has a positive impact on cash flow. While it is considered a non-cash expense given it describes the incremental loss in value of a fixed asset, it has an indirect effect on cash flow by decreasing tax burden.
Depreciation is considered an expense on tax forms, and reduces the amount of taxable income available and therefore how much the company is required to pay in taxes. Therefore, greater depreciation expense would increase synergy in a merger.
Capital expenditures
The greater a company’s capital expenditures, the lower its free cash flow.
Capital expenditures are used for investing activities (to upgrade or bring in new assets, such as plant, property, and equipment).
The ideal goal is that capex will eventually add more value to the firm in time, but as cash is spent it will decrease cash flow and thereby decrease synergy.
Working capital as a % of revenue
Working capital as a percent of revenue is inversely calculated with cash flow and synergy potential in a merger. Working capital is equal to current assets minus current liabilities, and represents operating liquidity, or the ability for a firm to pay off its debts.
Working capital as a percentage of revenue is essentially an efficiency measure. How well is a company using its working capital to generate revenue? The lower the amount of working capital needed to generate revenue, the better. A lower percentage would show that the company is using a relatively small portion of its net assets to generate revenue.
Others may use a metric known as the working capital turnover ratio, which is net sales divided by average working capital over that time period.
A higher working capital turnover ratio denotes a more efficient use of short-term assets and liabilities to turn a profit, and a firm that is less likely to invest in accounts receivable and inventory assets, and incur higher debt levels as a result.
Growth Rates
This also doesn’t have a clear-cut answer, as it will be dependent on the level of synergy as determined from the combined cash flows of both firms acting as one enterprise.
We will discuss how to calculate free cash flow below.
Beta of the company’s stock
An increase in beta (volatility relative to the market) would increase the cost of equity (expected return for investors) and decrease cash flow and synergy.
Calculating Free Cash Flow
Synergy is determined from cash flow.
Consequently, cash flow must be calculated from our above inputs. We are using free cash flow to equity (FCFE) in this case. The calculation goes as follows:
FCFE = (Revenue in current year * (1 – Operating expenses as % of revenue) – Interest expenses) * (1 – Tax rate) + Depreciation – Capex – Working Capital as % of Revenue * (Revenue – Revenue / (1 + Expected growth rate in years 1-5))
Basically what this equation boils down to is a standard FCFE calculation, but modified for the fact that we have some non-standard variables:
FCFE = EBIT (1-t) + Depreciation – Capex – Changes in working capital
We do this for each firm. To calculate free cash flow for both firms together without synergy, it is simply adding the two individual cash flow calculations together.
For the free cash flow of both firms together with synergy (in the form of cost reduction or both cost reduction and revenue growth), we combine them as follows:
FCFE = [(Revenues, b + Revenues, t) * (1 – Cost of goods w/ synergy) – (Interest expenses, b + Interest expenses, t)] * (1 – (Tax rate, b + Tax rate, t) / 2) + (Depreciation, b + Depreciation, t) – (Capex, b + Capex, t) – (Revenue, b – Revenue, b / (1 + Expected growth rate in years 1-5)) * Working capital as % of revenue, b – (Revenue, t – Revenue, t / (1 + Expected growth rate in years 1-5)) * Working capital as % of revenue, t
- b = Metric with respect to the bidding company
- t = Metric with respect to the target company
Once again I have highlighted the text to point out the congruities to a standard free cash flow calculation.
Instead of adding the cash flows individually, all components are combined into a single equation.
To calculate the total gains from synergy, first we need the terminal values from our free cash flow calculations.
It’s calculated as:
Terminal Value = FCF in final year * (1 + Growth rate after five years) / (Cost of equity – Growth rate after five years)
Calculating terminal value this way carries some risk of distortion given the hypersensitivity of the equation toward the growth rate.
When cost of equity and growth rate approximate each other, the terminal value will balloon to infinite proportion.
Or even illogically turn negative if it exceeds the cost of equity.
The present value of all future cash flows will equal:
PV of FCF = FCF, year 1 / (1 + Cost of equity) + FCF, year 2 / (1 + Cost of equity)^2 + FCF, year 3 / (1 + Cost of equity)^3 + FCF, year 4 / (1 + Cost of equity)^4 + (FCF, year 5 + Terminal Value) / (1 + Cost of equity)^5
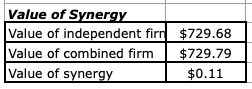
Once terminal values are calculated, our gains from synergy will be equal to:
Synergy = PV of FCF, combined with synergy – PV of FCF, combined with no synergy
However, we are still missing one important piece of information at this point.
What is the maximum bid that the target company should place on the firm it’s targeting?
In other words, what would be the maximum reasonable amount of money the firm should pay to complete the buyout/merger as a premium?
It is not the amount of synergy, but rather the amount of synergy added to the present value of the free cash flows of the bidding company.
Why? Because the bidding firm isn’t just deriving value from the synergy involved in combining the two entities.
It is also integrating the value of the target firm’s free cash flows along with it.
Even if there was no synergy in the deal, the bidding firm would benefit from having the target firm’s cash flows a part of its operations.
Hence when we calculate the logical maximum bid price it follows as:
Max bid price for target = Synergy + PV of target’s FCF
The percent premium over the market price is equal to:
Synergy / PV of target’s FCF
This measures what the bidding firm would have to pay for buying out or merging with this company relative to its market value.
Conclusion
Synergy is a very important concept in mergers and takeovers given they determine the extent to which the deal makes sense in the first place – how effectively, in dollar terms, do the two companies work together instead of apart?
How much value is created?
If one and one still make two, instead of something above two, the deal doesn’t have much fundamental purpose to it.
It follows a process from:
- determining the value of each firm separately
- valuing the combined firm with no synergy
- preparing a cash flow statement for the combined firm by adding their income statements and balance sheets
- finding where the synergy is being derived (more growth, reduced costs)
- placing this synergy in dollar terms on the combined cash flow statement
- calculating the value of the combined firm with synergistic considerations, and
- subtracting this total from the value of the combined firms with no synergy involved
The final number will determine the absolute most that should be paid in takeover premium.
The spreadsheet can be downloaded here (‘synergyvaluation.xls’). It’s a quick and easy model that can provide a great interactive format to learn how synergy works in an M&A transaction.