73+ Probabilistic, Statistical & Analytical Techniques for Traders to Know


For traders, investors, and market participants, an understanding of various probabilistic, statistical, and analytical techniques is important for making good decisions when the future is unknown.
Markets are heavily an applied probability exercise.
Each of these techniques and methods offers unique modeling capabilities and enables finance professionals to tackle specific and complex challenges – assessing risks and identifying potential opportunities.
Their application often requires a blend of domain knowledge, mathematical ability, and computational expertise.
They reflect the interdisciplinary nature of modern financial analysis and strategy development.
We will keep each of the descriptions of these techniques brief in the interest of keeping the article to a reasonable length.
And we have individual articles on many of the probabilistic, statistical, and analytical techniques mentioned below, or at least mentions nested within other articles. So we will link to those where appropriate.
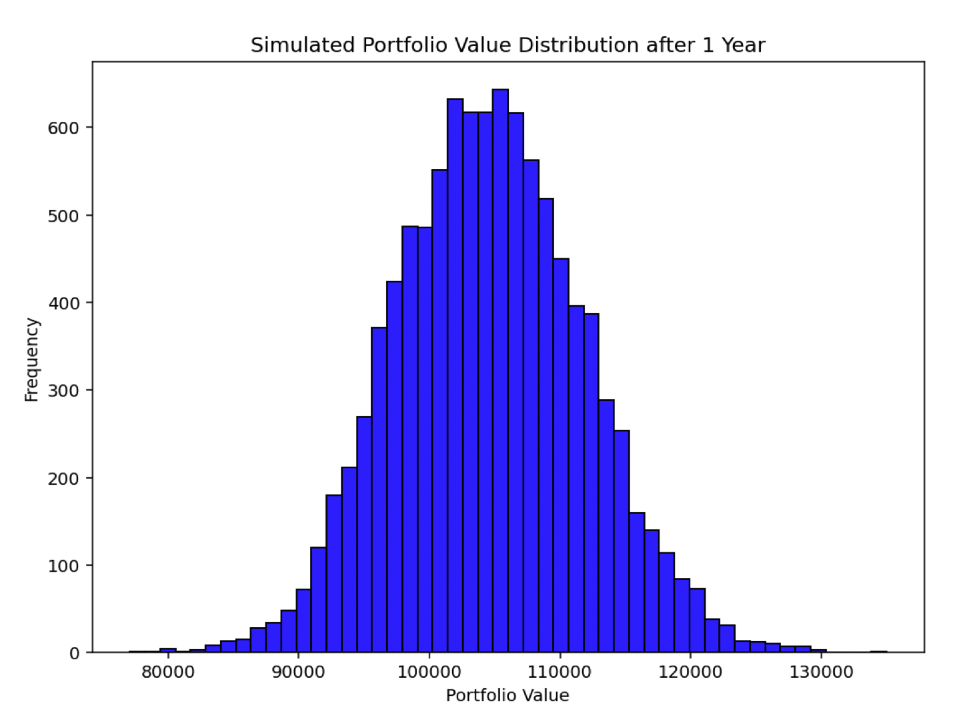
Monte Carlo Simulations
This technique uses random sampling to simulate the behavior of complex systems.
Monte Carlo simulations are used for pricing complex derivatives, assessing risks (like Value at Risk), and simulating various market scenarios.
They are particularly useful for modeling situations where analytical solutions are difficult or impossible to obtain.
Bayesian Statistics
This approach incorporates prior knowledge along with new data to make probabilistic statements.
For traders/investors, Bayesian statistics can be used to update beliefs about market behaviors or the likelihood of various economic scenarios based on incoming data.
An example would be updating beliefs of what price a stock should trade at after a quarterly earning release.
Markov Models
These models are used to predict the probability of various states given the current state.
Markov models can be applied to credit rating transitions, stock price movements, and market regime changes.
In other games like chess, a Markov model is used to assess the current position for what it is and what lines are best going forward.
Stochastic Calculus
Essential for modeling the random behavior of asset prices, stochastic calculus is used in the Black-Scholes-Merton model to price options and other financial derivatives.
It’s fundamental for understanding the random walks and Brownian motion in financial markets.
GARCH (Generalized Autoregressive Conditional Heteroskedasticity) Models
These are mostly used to forecast volatility, a factor in risk management and derivative pricing.
GARCH models are useful in modeling time-varying volatility, which is a common characteristic of financial data.
eGARCH and tGARCH models can be used to account for asymmetries in volatility data.
Copula Models
These models are used to understand and model the dependence structure between different asset classes or financial instruments.
Copulas are useful in risk management and in understanding tail dependencies in portfolio management.
Extreme Value Theory (EVT)
EVT is used for assessing and quantifying the risk of extreme market movements.
Used for stress testing and managing tail risks in portfolios.
Time Series Analysis
Techniques like ARIMA (Autoregressive Integrated Moving Average) are used for forecasting future stock prices, economic indicators, and other financial time series data.
Machine Learning Algorithms
ML techniques like regression, classification, clustering, and reinforcement learning can be used to predict market movements, identify trading opportunities, and develop automated trading strategies.
Decision Trees and Random Forests
These are useful for classification and regression tasks in finance.
They can be applied to credit scoring, bankruptcy prediction, and for constructing quantitative trading strategies.
Hidden Markov Models (HMM)
These models are used to study data that changes over time – assuming that the data follows a pattern with unobservable (hidden) factors influencing its behavior.
HMMs are useful in algorithmic trading for detecting regime/paradigm changes in financial markets or identifying latent factors that drive market movements.
Survival Analysis
This statistical approach is used to predict the time until an event of interest occurs, like default on a credit product.
Useful in risk management for understanding the lifetimes of financial instruments or investments.
For example, in the stock market you often see the advice to “invest in good companies.”
But the definition of a “good company” (e.g., what’s in the Dow Jones or top market cap in the S&P 500) changes over time.
For example, the top companies today are very different from what they were 30 years ago, which are very different from what they were a generation before that, and so on.
About 60% of the S&P 500 gets replaced every 25 years.
Non-Parametric Statistics
Non-parametric techniques like kernel density estimation and k-nearest neighbors (KNN) allow for model-free analysis.
Can be useful when the underlying distribution of the financial data is unknown or complex.
Dynamic Bayesian Networks (DBN)
These are extensions of Bayesian networks that model sequences of variables.
They are useful in finance for modeling sequential data, like time series of stock prices, and for making predictions based on historical trends.
Particle Filtering
This method is used for estimating the state of a hidden variable in a dynamic system.
Can be applied to high-frequency trading data for tracking and predicting market states in real-time.
Kalman Filters
This algorithm is used to estimate the state of a linear dynamic system from a series of noisy measurements.
Kalman filters are used for adaptive market tracking and for optimizing trading strategies in real-time.
Game Theory and Nash Equilibria
Game theory and Nash equilibria are used to model and predict the behavior of market participants under different scenarios.
Used in strategic decision-making and auction theory.
Utility Theory
Important for understanding and modeling the behavior of traders/investors.
Often framed in terms of risk aversion and investment choices under uncertainty.
Graph Theory and Network Analysis
Useful for modeling and understanding the interconnectedness of financial markets, systemic risk, and contagion effects.
Reinforcement Learning
While a machine learning technique, it deserves mention for its use in developing sophisticated trading algorithms that learn and adapt from their interaction with the market.
Portfolio Optimization Techniques
Methods like Mean-Variance Optimization and Stochastic Optimization are used for constructing efficient portfolios.
Chiefly it’s about the trade-off between risk and return.
Quantum Computing Approaches
Emerging techniques in quantum computing are beginning to be explored for complex financial modeling.
Offers potential breakthroughs in speed and efficiency for certain types of calculations.
Fractional Brownian Motion
This is an extension of classical Brownian motion that incorporates memory into the process.
Useful for modeling long-term dependencies in financial time series, such as stock prices or interest rates.
Neural Networks and Deep Learning
These machine learning techniques are used for complex pattern recognition and predictive modeling in financial markets.
Example applications include stock price prediction, fraud detection, and algorithmic trading.
Bootstrap Methods
Bootstrap techniques are used for estimating the distribution of a statistic (like the mean or variance) by resampling with replacement from the data.
Useful in finance for assessing the uncertainty of estimates when the underlying distribution is unknown.
Fuzzy Logic
Fuzzy logic is a form of logic used in computing that allows for reasoning with approximate or uncertain information – rather than strictly binary (true/false) logic.
Can be applied to investment analysis and risk assessment where the inputs are ambiguous or unclear.
Wavelet Analysis
This is used for analyzing financial time series data at different scales or resolutions.
It’s particularly useful for detecting hidden patterns, trends, and anomalies in financial markets.
Support Vector Machines (SVM)
These are used for classification and regression tasks.
SVMs can be applied to credit scoring, market prediction, and constructing trading strategies.
Multifractal Analysis
This technique is used for analyzing complex, self-similar structures in financial time series.
Agent-Based Modeling
Agent-based modeling simulates the interactions of agents (like investors or consumers) to assess their effects on the financial system as a whole.
Catastrophe Theory
Used to study the behavior of systems that can undergo sudden shifts in response to gradual changes, like market crashes or financial crises.
Principal Component Analysis (PCA)
A statistical technique used to reduce the dimensionality of financial datasets while retaining most of the variability in the data.
Used in risk management and for identifying key factors driving market movements.
Predictive Modeling using Econometric Methods
Techniques like Vector Autoregression (VAR) and Cointegration are used for forecasting economic and financial time series and for understanding the relationships between multiple time series.
Quantum Machine Learning
An emerging field that combines quantum computing with machine learning.
Potential for faster and more efficient data processing and analysis in finance.
Evolutionary Algorithms and Genetic Programming
Used for optimization problems in finance, such as portfolio optimization and strategy development, by simulating the process of natural evolution.
Part of a subset of algorithms known as heuristics and metaheuristics.
Nonlinear Dynamical Systems and Chaos Theory
These approaches are used to understand complex, dynamic systems in finance (those that exhibit nonlinear behaviors and sensitivity to initial conditions).
Sparse Modeling and Regularization Techniques
Techniques like LASSO (Least Absolute Shrinkage and Selection Operator) and Ridge Regression are used for handling high-dimensional data in finance.
Helps improve the interpretability of models and prevent overfitting.
Ensemble Methods
Methods like boosting and bagging combine multiple models to improve predictions and reduce variance.
Useful in financial forecasting and risk modeling.
Sentiment Analysis and Natural Language Processing (NLP)
These techniques analyze textual data like news articles, financial reports, and social media to gauge market sentiment and predict its impact on financial markets.
Anomaly Detection
Statistical techniques for identifying outliers or anomalies in financial data. Can be indicative of events like fraud, market manipulation, or operational risks.
Structural Equation Modeling (SEM)
Used for understanding complex relationships between observed and latent variables.
SEM can be applied to model the relationships between various economic indicators and market variables.
Robust Statistics
Focuses on techniques that aren’t unduly affected by outliers or deviations from assumptions.
Makes them suitable for financial data that often exhibits heavy tails and is prone to outliers.
Graphical Models and Bayesian Networks
These models represent dependencies among variables and are used for probabilistic inference and decision-making in finance.
Time-Frequency Analysis Methods
Techniques like the Short-Time Fourier Transform (STFT) or Continuous Wavelet Transform (CWT) are used for analyzing non-stationary financial time series.
High-Frequency Trading Algorithms
Specialized algorithms designed to execute orders rapidly and in large quantities.
Uses probabilistic and statistical techniques to make short-term market predictions.
Focuses on market microstructure.
Simulated Annealing and Other Optimization Techniques
Used for solving complex optimization problems in finance – e.g., asset allocation and portfolio optimization – especially where traditional methods are computationally intensive or inadequate.
Conic Solvers
Conic solvers are optimization tools used to find solutions to mathematical problems defined by conic sections (like circles or ellipses).
Typically involves constraints and objectives.
Conic solvers are applied to tackle portfolio optimization and risk management problems, where the constraints and objectives can be modeled using conic structures.
Data Fusion and Multi-Source Integration
Techniques for integrating and analyzing data from multiple sources (like market data, economic indicators, and social media) to gain a comprehensive view of the financial markets.
Systemic Risk Modeling
Methods to assess the risk of collapse of entire financial systems or markets, rather than individual components.
Involves network analysis and stress testing.
Algorithmic Complexity and Information Theory
Used to analyze the complexity and informational efficiency of financial markets, and for developing algorithmic trading strategies.
Graph Signal Processing (GSP)
This method extends signal processing concepts to data defined on graphs, such as financial networks.
Useful for understanding the structure and dynamics of financial systems and for signal processing on irregular domains.
Hierarchical Models
These models structure parameters at multiple levels, allowing for more nuanced understanding and modeling of data hierarchies and relationships – e.g., those found in multi-asset portfolios.
Related: Hierarchical Risk Parity
High-Dimensional Data Analysis
Techniques like:
- principal component analysis (PCA)
- factor analysis, and
- manifold learning…
…are used for dimensionality reduction and feature extraction in high-dimensional financial datasets.
Spectral Methods
Used for analyzing the spectrum (eigenvalues) of matrices associated with financial data.
These methods are used in understanding various properties of financial markets and networks, including market stability and risk.
Stochastic Volatility Models
These models capture the random and dynamic nature of volatility in financial markets – essential for pricing derivatives and risk management.
Stochastic Control Theory
SCT is used in dynamic optimization of portfolios and in the management of financial risks.
Stochastic Differential Games
A field that combines game theory with stochastic processes.
Useful in modeling competitive behaviors in financial markets when the future is unknown.
Stochastic Portfolio Theory
A mathematical framework for constructing and analyzing portfolios in stochastic markets.
Focuses on the distributional characteristics of portfolio returns.
Those who perform this type of analysis (e.g., Monte Carlo) will view results in terms of probability distributions.
Advanced applications and extensions of stochastic portfolio theory include the effects of market microstructure on portfolio dynamics.
Stochastic Optimization
Techniques like stochastic gradient descent and simulated annealing are used for optimizing portfolios and trading strategies under uncertainty.
Stochastic Geometry
This field applies concepts from geometry to stochastic processes.
Can be used for modeling the spatial aspects of financial data – e.g., the geographical distribution of market participants or assets.
Stochastic Game Theory
A generalization of game theory and decision theory to analyze strategic interactions with random outcomes.
Functional Data Analysis (FDA)
This approach deals with data that are functions (like curves or shapes) rather than scalar observations.
Can be used for analyzing curves such as yield curves or price trajectories.
Complex Systems Theory
This interdisciplinary approach studies how relationships between parts of a system give rise to its collective behaviors and how the system interacts with its environment.
Applicable in financial systems analysis.
Can also tie in with techniques like agent-based modeling discussed above.
Information Bottleneck Method
Used for finding the relevant information in a random variable about another random variable.
Useful in feature selection and reducing complexity in financial models.
Metaheuristic Algorithms
Techniques like genetic algorithms, simulated annealing, and swarm optimization are used for solving complex optimization problems that are otherwise hard to solve using traditional methods.
Quantum Financial Models
Utilizing principles from quantum mechanics to model financial markets.
Used for complex problems where classical algorithms are inefficient.
Nonlinear Time Series Analysis
Methods like nonlinear state-space modeling and chaos theory are applied to model and forecast complex, nonlinear dynamics in financial time series.
Nonlinear State-Space Modeling
Nonlinear state-space modeling is a mathematical framework for representing dynamic systems.
Here the relationship between variables and their evolution over time is characterized by nonlinear equations.
Used to capture the complex, nonlinear dynamics of financial markets and instruments – e.g., predicting stock prices or economic indicators that don’t follow straightforward, linear patterns.
Bifurcation Theory
This mathematical concept studies changes in the qualitative or topological structure of a given family of models.
Useful for understanding market shifts, like transitions from stable to volatile periods.
Large Deviations Theory
This branch of probability theory provides a framework for assessing the probabilities of rare events, such as extreme market movements.
Used for risk assessment and stress testing.
Topological Data Analysis (TDA)
TDA focuses on the shape of data and is used to extract meaningful structures and patterns from complex financial datasets (mostly in high-dimensional spaces).
Nonlinear Filtering
Techniques like particle filters and nonlinear Kalman filters are used for estimating hidden states in financial time series.
Most commonly used when the dynamics are nonlinear.
Predictive Analytics Using Machine Learning
Predictive analytics using machine learning involves using sophisticated algorithms (e.g., ensemble methods and deep learning) to analyze data and make future predictions based on patterns and trends identified from (mostly) historical information.
Network Theory and Financial Contagion Models
These methods are crucial for understanding and modeling the interconnectivity in financial systems and how shocks in one part of the system can propagate to others.
Behavioral Finance Models
These models incorporate insights from psychology to understand the behavior of traders/investors and markets.
Quantum Probability
An emerging field that applies quantum theory to probabilistic events.
Potential applications in modeling financial markets and complex economic systems.
Algorithmic Game Theory
Combines algorithms with game theory to understand and design systems with multiple self-interested agents – e.g., financial markets, auctions, and trading strategies.
Multi-Agent Simulation
This approach simulates the actions and interactions of multiple agents to recreate and predict the emergence of phenomena in financial markets.
Much like agent-based modeling.
Submodular Function Optimization
Used in areas like portfolio optimization and resource allocation, this method deals with optimizing a special class of set functions that exhibit diminishing returns.
Risk Measures and Their Properties
Advanced study of risk measures like CVaR (Conditional Value at Risk) and their mathematical properties, to better understand and manage financial risks.
Factor Models in High Dimensions
These models, including PCA and factor analysis, are extended to high-dimensional settings.
Useful for analyzing large-scale financial datasets – e.g., those in big data analytics.
Risk Parity and Advanced Portfolio Construction Methods
Beyond traditional mean-variance optimization, risk parity methods focus on distributing risk equally among portfolio components or some other optimization goal – e.g., balancing risk between different macro environments.
Considers correlations and volatilities to create more resilient investment strategies.
A form of balanced beta.
Alpha strategies can also be pursued within the context of the risk parity framework.
Adaptive Filtering and Learning in Finance
Techniques that adaptively update models or strategies in response to new market data.
Used in high-frequency trading and algorithmic decision-making where market conditions are constantly changing.
Fractal Markets Hypothesis
Extending beyond the Efficient Market Hypothesis, this approach considers financial markets as fractal in nature.
Accounts for scaling and self-similarity in market movements.
Causal Inference in Econometrics
Techniques like Granger causality tests and vector autoregression (VAR) models are used to infer causal relationships in economic data.
Can be used for understanding economic policy impacts and market drivers.
Algorithmic Differentiation in Finance
Used for efficiently computing sensitivities of financial models.
Used in risk management and option pricing where gradients and partial derivatives are required.
Multilevel Models in Finance
These models handle data that are organized at more than one level.
An example would be individual assets within portfolios.
Useful for hierarchical risk aggregation and multi-level financial analyses.
Geometric Brownian Motion in Advanced Modeling
Beyond its basic application in option pricing, this stochastic process is used to model stock prices in more complex scenarios, incorporating jumps and other real-world market behaviors.
Predictive Time Series Analysis with Long Short-Term Memory (LSTM) Networks
A type of recurrent neural network particularly well-suited for modeling and predicting sequences – e.g., financial time series data.
Quantile Regression
Beyond mean-based models, quantile regression is used for modeling different quantiles of a distribution.
Useful for understanding the entire range of possible market outcomes.
Can also be used to test for normality. (Much financial data is more fat-tailed than the normal distribution would suggest.)
Credit Scoring Models Using Advanced Machine Learning
Incorporating techniques like random forests, gradient boosting, and neural networks to improve the accuracy of credit risk assessment.
Market Microstructure Analysis
Understanding the mechanisms and behaviors within financial markets at a micro-level, including bid-ask spreads, order flow, and liquidity.
Counterparty Risk Modeling
Assessing the risk that the other party in a financial transaction may default.
Uses models that account for correlations and network effects.
Stochastic Process Calibration in Finance
Techniques for calibrating stochastic models to market data.
Ensures that models accurately reflect observed market dynamics.
Advanced Techniques in Derivatives Pricing
Beyond Black-Scholes, using stochastic volatility models, jump-diffusion models, and other advanced methods to price complex financial derivatives.
Temporal Difference Learning in Reinforcement Learning
Applied in algorithmic trading and portfolio management.
Helps in learning optimal policies through sampling, without requiring a model of the environment.
Advanced Credit Risk Modeling
Utilizing survival analysis, hazard models, and machine learning to predict defaults and manage credit risk more accurately.
Important in the context of large credit portfolios.
Stochastic Processes with Jumps
Extending beyond models with continuous paths, these processes (like Poisson jump processes) model sudden movements in market prices.
Helpful for capturing market shocks and tail risks.
Non-Equilibrium Statistical Mechanics in Finance
Applying concepts from physics to financial markets to model and understand market dynamics far from equilibrium, such as during market crashes or bubbles.
Extreme Risk Management Techniques
Advanced methods like stress testing, scenario analysis, and tail risk hedging are used to manage and mitigate the risks of extreme market movements.
Related: Tail Value at Risk (TVaR)
High-Dimensional Copula Models
Extending copula modeling to high dimensions to understand and model dependencies in large portfolios or across multiple financial instruments.
Liquidity Risk Modeling
Advanced methods for quantifying and managing liquidity risk. Most important in times of financial distress.
Network Models in Systemic Risk Analysis
Using graph theory and network models to analyze and mitigate systemic risk in the financial system, including the study of contagion effects and interconnectedness.
Asset and Liability Management (ALM) Techniques
Advanced modeling approaches for optimizing the composition of assets and liabilities.
Used by banks, insurance, and reinsurance companies in managing risks and returns over time.
Modeling High-Frequency Financial Data
Techniques to handle and analyze the massive volumes of data generated by high-frequency trading.
Focuses on market microstructure and intra-day price dynamics.
Behavioral and Experimental Economics in Financial Decision-Making
Applying insights from behavioral economics to understand and predict financial decision-making, market outcomes, and anomalies.
Computational Bayesian Methods in Finance
Using Bayesian inference and Markov Chain Monte Carlo (MCMC) techniques for more complex and realistic modeling of financial phenomena.
Multi-Objective Optimization in Finance
Techniques for optimizing multiple conflicting objectives, such as return and risk, liquidity and yield, in investment and portfolio management.
Sometimes called higher-moment optimization when one is trying to strike a balance or optimize among various measures beyond mean (return) and variance (volatility) – e.g., skewness and kurtosis.
Conclusion
Each of these techniques has its own area of application and is suited for specific types of financial analysis.
The choice of a technique largely depends on the nature of the financial problem, the type of data available, and the specific goals of the analysis.
Understanding and applying these probabilistic methods can enhance the analytical capabilities of traders and investors.
They enable market participants to:
- refine their strategies
- improve their predictive models, and
- make more informed decisions in an environment characterized by lots of unknowns and dimensionality