Yield Curve


A yield curve is a graph that plots the yields of fixed-income securities against their maturities.
The maturities of the securities are typically shown on the x-axis, and the yields are shown on the y-axis.
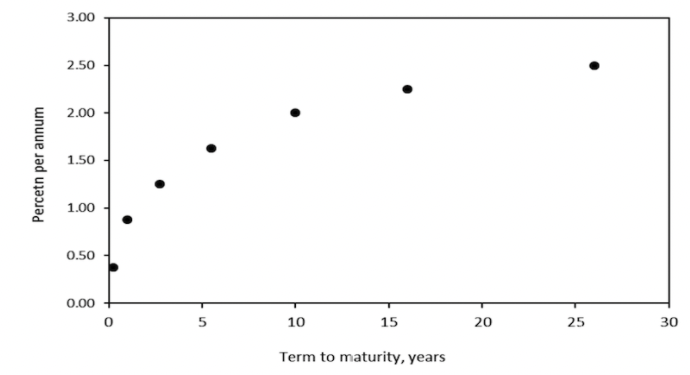
A yield curve typically has an upward slope, which means that securities with longer maturities generally have higher yields than securities with shorter maturities.
There are several different types of yield curves, including the normal yield curve, the inverted yield curve, and the flat yield curve.
A normal yield curve is one in which the yields on longer-term securities are higher than the yields on shorter-term securities.
This is because investors typically demand a higher yield to compensate them for the additional risk of holding a longer-term security.
An inverted yield curve is one in which the yields on shorter-term securities are higher than the yields on longer-term securities.
This is unusual and may indicate that traders/investors expect economic conditions to deteriorate in the future.
A flat yield curve is one in which the yields on securities of all maturities are relatively similar.
Yield curves are used by investors and analysts to make informed decisions about which securities to buy or sell, and can also be used to predict future economic conditions.
For example, if the yield curve steepens (i.e., the difference between short-term and long-term yields increases), it may indicate that the economy is improving and that interest rates are likely to rise.
Conversely, if the yield curve flattens or inverts, it may indicate that the economy is slowing down and that interest rates are likely to remain stable or even decline.
Key Takeaways – Yield Curve
- The yield curve is a graphical representation of the relationship between bond yields and their maturities. It shows the yield of bonds with different maturities, typically on the y-axis and the maturities on the x-axis.
- A normal yield curve is upward sloping, which means that longer-term bonds have higher yields than shorter-term bonds. This is because investors demand a higher yield to compensate for the additional risk of holding a bond for a longer period of time.
- An inverted yield curve occurs when shorter-term bond yields are higher than longer-term bond yields. This is generally considered to be a sign of economic recession, as investors expect the Federal Reserve to lower interest rates in response to a slowing economy.
- The slope of the yield curve can also give traders and investors insight into the direction of the economy. A steep yield curve typically indicates that the economy is growing and that investors expect interest rates to rise in the future (following nominal growth). A flat or humped yield curve, on the other hand, may indicate that the economy is slowing or that the Federal Reserve is holding steady on interest rates.
- Changes in the yield curve can also have an impact on the performance of different asset classes. For example, a steep yield curve may be beneficial for banks, which rely on the spread between short-term and long-term interest rates to generate profits. On the other hand, a flat or inverted yield curve may be negative for banks and could lead to a decrease in their profits.
Yield Curve Inversion
A yield curve inversion occurs when the yields on shorter-term securities are higher than the yields on longer-term securities.
This is unusual because, in a normal market, investors typically demand a higher yield on longer-term securities to compensate them for the additional risk of holding a longer-term investment.
An inverted yield curve is often seen as a sign of economic uncertainty, and may indicate that investors expect economic conditions to deteriorate in the future.
There are several different types of yield curve inversions, including a partial inversion, in which only some of the yields on shorter-term securities are higher than the yields on longer-term securities, and a full inversion, in which all of the yields on shorter-term securities are higher than the yields on longer-term securities.
A full inversion is considered to be a stronger signal of economic uncertainty than a partial inversion.
Yield curve inversions can have significant implications for financial markets and the economy.
For example, an inverted yield curve has historically been a reliable predictor of recessions, and an inverted yield curve can also lead to a decrease in lending and borrowing activity, which can have negative impacts on businesses and consumers.
However, it is important to note that yield curve inversions do not always predict recessions, and that other factors can also influence the shape of the yield curve.
Yield Curve Control
Yield curve control (YCC) is a monetary policy tool that central banks can use to influence the shape of the yield curve, which is a graph that plots the yields of fixed-income securities against their maturities.
Central banks can use YCC to maintain a specific target level for the yield on a particular maturity of government bonds, or to keep the yield curve at a certain shape (e.g., steep or flat).
The Bank of Japan (BOJ) has implemented YCC as a way to help achieve its inflation target and stimulate economic growth.
Under its YCC program, the BOJ announces a target level for the yield on 10-year Japanese government bonds (JGBs) and buys an unlimited amount of JGBs to keep the yield at that level.
The BOJ also buys shorter-term JGBs to help keep the yield curve steep, which can encourage borrowing and investment.
The BOJ’s YCC program first went into place in September 2016, and has been credited with helping to support economic growth and achieve the BOJ’s inflation target.
However, YCC has also been criticized for potentially distorting financial markets and making it more difficult for the BOJ to exit from its unconventional monetary policies.
Why Is the Yield Curve Called the Term Structure of Interest Rates?
The yield curve is often referred to as the term structure of interest rates because it provides a snapshot of the interest rates of bonds with different maturities, or terms.
The term structure refers to the relationship between the interest rates and the time to maturity of a bond.
The yield curve is a graphical representation of this relationship, with the yields plotted on the vertical axis and the maturities plotted on the horizontal axis.
By examining the shape of the yield curve, investors can gain insights into the market’s expectations for future interest rates, inflation, and economic growth.
The term structure of interest rates is an important concept in finance because it can help investors and analysts make informed decisions about the pricing and risks of different fixed-income securities.
For example, a steeply sloping yield curve indicates that investors expect interest rates to rise in the future, while a flat yield curve suggests that the market expects little change in interest rates over time.
Understanding the Yield Curve
https://www.youtube.com/watch?v=PKYiGsoYm7o
FAQs – Yield Curve
What does the yield curve predict?
The yield curve, which is a graph that plots the yields of fixed-income securities against their maturities, can be used to predict a range of economic conditions and events.
In general, the shape of the yield curve can provide insight into the expectations of investors and analysts about future interest rates and economic growth.
The yield curve is just one tool that investors and analysts use to make predictions about the economy, and that other factors can also influence the shape of the yield curve.
What determines the shape of the yield curve?
In short, a bond yield is discounted nominal growth (i.e., discounted real growth (growth in the labor force + growth in productivity) + discounted inflation) + term premium.
There are several variables that can influence the yield of a bond and the shape of the yield curve:
- Interest rates: Interest rates set by the Federal Reserve play a major role in determining the yield of a bond.
- Inflation expectations: Inflation expectations also influence the yield of a bond. If investors expect inflation to rise in the future, they may demand a higher yield to compensate for the erosion of purchasing power. This can lead to a steepening of the yield curve.
- Credit risk: The credit risk of a bond, or the risk that the issuer will default on its payments, can also affect the yield. Investors will demand a higher yield for bonds with higher credit risk to compensate for the additional risk. The credit risk of bonds in reserve-currency countries is generally considered to be about zero because these countries can always pay their bills in nominal terms.
- Market supply and demand: The supply and demand for bonds in the market can also influence the yield curve. If there is strong demand for bonds, the yields may be driven down, while a decrease in demand may lead to higher yields. These supply and demand dynamics flow into what’s called the term premium.
- Economic growth: Economic growth can also impact the yield curve. If the economy is growing, investors may expect interest rates to rise in the future, which can lead to a steepening of the yield curve. On the other hand, if the economy is slowing, investors may expect interest rates to remain low, which can lead to a flattening of the yield curve.
What does a steep yield curve mean?
A steep yield curve, which is one in which the yields on longer-term securities are significantly higher than the yields on shorter-term securities, may indicate that investors expect economic conditions to improve and that interest rates will rise in the future.
This can be a sign of confidence in the economy and may suggest that borrowing and investing activity will increase.
What does a flat or inverted yield curve mean?
A flat or inverted yield curve – where the yields on securities of all maturities are relatively similar or the yields on shorter-term securities are higher than the yields on longer-term securities – may denote that investors expect economic conditions to remain stable or deteriorate in the future.
The inversion might indicate a wider distribution of discounted market expectations (“uncertainty”) or concern about the economy and may suggest that borrowing and investing activity will decrease.
What happens to the yield curve when inflation is high?
When inflation is high, it means that the general price level of goods and services in the economy is rising.
This can lead to an increase in long-term interest rates, as lenders will demand a higher return on their loans to compensate for the expected erosion of the purchasing power of their money over time.
As a result, the yield curve may steepen, which means that the difference between yields on long-term and short-term bonds will increase.
However, the relationship between inflation and the yield curve is not always straightforward, and there are other factors that can influence the shape of the yield curve as well.
The yield curve operates off discounted expectations of the future. So if inflation is currently high but expected by market participants to fall in the future, the yield curve may be relatively flat.
For example, if investors expect future economic growth to be strong, they may be willing to accept lower yields on long-term bonds, which could lead to a flattening or even an inversion of the yield curve.
Conclusion – Yield Curve
The yield curve is a graph that plots the yields of fixed-income securities with different maturities. It is typically used to show the relationship between bond yields and their maturities, with shorter-term bonds on the left side of the curve and longer-term bonds on the right.
Traders and investors need to understand the yield curve because it can provide valuable information about the current state of the economy and the expectations of market participants.
A steep yield curve, for example, may indicate that investors expect strong economic growth and rising inflation in the future, while a flat or inverted yield curve may suggest that they expect slower growth and lower inflation.
The shape of the yield curve can also have important implications for the profitability of different investments.
For example, if the yield curve is steep, it may be more attractive for investors to buy long-term bonds, since they can earn a higher return on their investment.
On the other hand, if the yield curve is flat or inverted, it may be more attractive to buy short-term bonds, since they offer a lower but more certain return.
Overall, understanding the yield curve can help traders and investors make informed decisions about their investments and manage their risk.