Tail Value at Risk – TVaR (Formula, Applications, Python Code)


Tail Value at Risk (TVaR) – also known as Tail Conditional Expectation or Conditional Tail Expectation (CTE) – is a risk assessment measure that quantifies the average loss in the worst-case scenarios of an investment portfolio.
TVaR goes beyond traditional Value at Risk (VaR) by not only identifying the threshold of extreme losses but also quantifying the expected severity of losses beyond that threshold.
Key Takeaways – Tail Value at Risk (TVaR)
- Risk Measure Focus: Tail Value at Risk (TVaR) measures potential losses in the tail end of a distribution.
- Looks into extreme risk scenarios beyond the usual Value at Risk (VaR) threshold.
- Severity of Tail Losses: TVaR evaluates the average loss assuming that a loss has exceeded the VaR level.
- Emphasizes the severity of worst-case outcomes.
- Prepares for extreme market movements and tail risks.
Calculation & Formula of TVaR
Tail Value at Risk (TVaR), also known as Expected Shortfall (ES), is a risk measure that quantifies the expected loss in the worst-case scenarios, beyond a specified Value at Risk (VaR) level.
The formula for TVaR depends on the distribution of returns, but a general approach for continuous distributions is as follows:
Determine the VaR
First, calculate the Value at Risk at a certain confidence level .
For a continuous distribution, VaR is the quantile such that the probability of a loss exceeding VaR is .
If is the cumulative distribution function (CDF) of losses, then .
Calculate TVaR
TVaR is the expected loss given that the loss has exceeded the VaR level.
Mathematically, it can be expressed as:
- Where is the probability density function (PDF) of losses.
In simpler terms, TVaR is the average of the worst of losses.
For example, if , TVaR represents the average loss in the worst 5% of cases.
In practical applications, particularly when dealing with complex or non-standard distributions, TVaR is often calculated using Monte Carlo simulations or other numerical methods, as analytical solutions might not be feasible or straightforward.
Python Code – Tail Value at Risk (TVaR)
To calculate the Tail Value at Risk (TVaR) in Python, you can use a Monte Carlo simulation approach.
This method is particularly useful when dealing with complex distributions or when an analytical solution is not readily available.
The following Python code snippet demonstrates how to compute TVaR:
- Generate Random Samples: Simulate returns or losses from the desired distribution.
- Determine VaR: Calculate the Value at Risk at a specified confidence level.
- Compute TVaR: Average the losses that exceed the VaR.
Here’s an example code:
import numpy as np

from scipy.stats import norm

def calculate_tvar_below_threshold(distribution, threshold):
"""
Calculate TVaR for losses below a specified threshold.

:param distribution: A distribution object from scipy.stats
:param threshold: The threshold below which we calculate the average loss.
:return: TVaR value.
"""
# Calculate TVaR as the conditional expectation below the threshold
tvar = distribution.expect(lambda x: x, ub=threshold, conditional=True)

return tvar

# Parameters for normal distribution
mu, sigma = 100, 10 # This the mean and standard deviation
normal_dist = norm(mu, sigma)

# Thresholds for 2 and 3 standard deviation events
threshold_2_std_dev = mu - 2 * sigma # 80
threshold_3_std_dev = mu - 3 * sigma # 70

# Calculate and print TVaR for each threshold
tvar_2_std_dev = calculate_tvar_below_threshold(normal_dist, threshold_2_std_dev)
tvar_3_std_dev = calculate_tvar_below_threshold(normal_dist, threshold_3_std_dev)

tvar_2_std_dev, tvar_3_std_dev
We can find that the answers from this code are about 76.2 and 67.2.
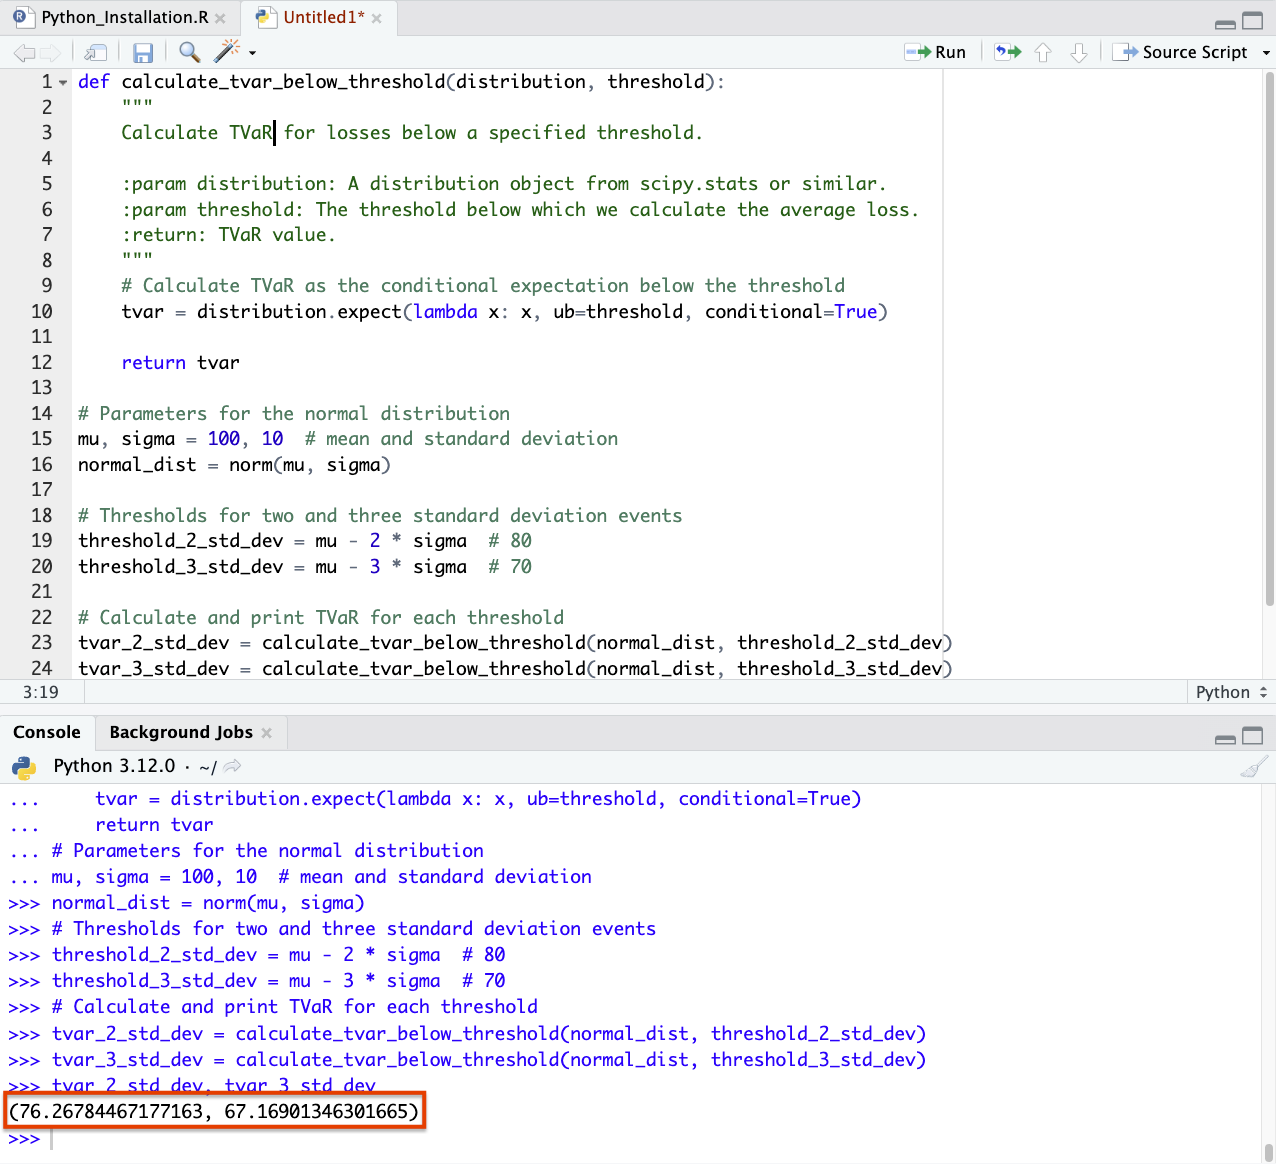
We know this makes intuitive sense.
Because with 100 as a mean and 10 as a standard deviation, the 95% confidence interval (2 standard deviations) would be 80, and the TVaR is always a little bit more (i.e., the loss if it gets to that), so 76.2 makes sense.
The 3-SD point would then be 70, so an amount lower than 70 also makes sense for the 99.7% confidence interval.
Significance
Comprehensive Risk Assessment
TVaR provides a more complete view of risk by focusing on the tail of the loss distribution.
This captures the severity of potential extreme losses.
Better Risk Management
By understanding the magnitude of potential losses in the worst-case scenarios, portfolio managers can make better risk management decisions.
Regulatory Compliance
TVaR is increasingly recognized in regulatory frameworks for its effectiveness in capturing tail risk, especially after the 2008 financial crisis.
Applications
Portfolio Optimization
TVaR is used in portfolio optimization to minimize the potential for extreme losses.
This can lead to more robust portfolio construction.
Insurance and Actuarial Science
In insurance and actuarial science, TVaR can be used for assessing the risk of rare but catastrophic events and determining appropriate premium levels (i.e., how much they need to charge to cover their losses).
Financial Regulation
Regulatory bodies often use TVaR for assessing the risk profile of financial institutions and for setting capital reserve requirements.
Advantages
Focus on Extreme Losses
TVaR addresses the limitations of VaR by not only identifying the point of extreme loss but also quantifying the average loss beyond that point.
Risk Sensitivity
It is particularly sensitive to changes in the shape of the tail of the loss distribution.
Limitations
Calculation Complexity
Calculating TVaR can be complex and computationally intensive.
It may require sophisticated statistical models and significant data.
Data Intensive
Accurate estimation of TVaR requires detailed data on loss distributions. This may not be available for all types of investments.
Dependence on VaR
Since TVaR calculation is based on VaR, any inaccuracies or limitations in the VaR estimation will affect the TVaR results.
Conclusion
Tail Value at Risk is a risk assessment tool that provides a deeper insight into potential extreme losses than VaR alone.
It’s particularly useful in scenarios where understanding and managing tail risk is important, such as in portfolio management, insurance, and regulatory compliance.
TVaR can offer a more complete picture of risk – especially for extreme events – but its effective use requires consideration of its complexity and the quality of underlying data.