Kurtosis


Unlike Skew, which measures the distribution symmetry, Kurtosis describes the extent to which the tails (or extremes) of a set of data differ from those of a normal distribution. A bell curve distribution would exhibit kurtosis of 3, so only numbers above or below 3 can be described as “excess” Kurtosis.
The Best Brokers For Kurtosis Analysis Trading

Types Of Kurtosis
There are three types of kurtosis:
- Mesokurtic
- Leptokurtic
- Platykurtic
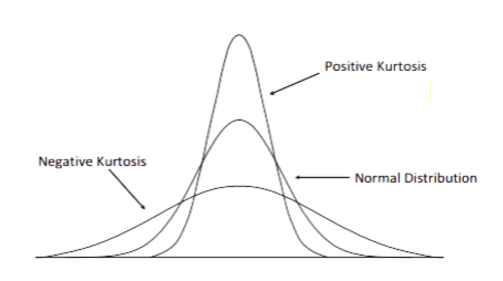
Mesokurtic: This is the profile that corresponds to a normal distribution; the excess is usually around zero (i.e. it will have kurtosis of +/-3).
Leptokurtic: This exhibits a positive excess, with large amounts to data points on either side of the data, indicating the possibility of extreme outlier results in either direction. (Positive and negative).
Platykurtic: This distribution shows negative values, with flat tails (i.e. only a small number of outliers in the data set).
Using Kurtosis In Trading
In finance, a large degree of kurtosis might imply large investment risk, as results may include higher than normal probabilities of both extreme profits AND losses, which would tend to suggest higher return volatility.
A low kurtosis would imply much lower probabilities of large gains or losses.
If the dataset has skew, then one already knows that the distribution has kurtosis, which also means that estimating Standard Deviations or Variance of data via sampling becomes less precise.
The greater the kurtosis, the less useful the results of any sampling of the data will be.
It is also important to note that kurtosis concentrates exclusively on the extremes (or tails) of a distribution and thus has nothing to say about the peaks of a distribution (which are normally found in the middle of the dataset).
There may be a correlation between the tails and the peak of data, but it is not direct and thus the latter cannot be accurately predicted from the former.