Standard Deviation


Standard Deviation: A statistical measurement of the amount of variability (or dispersion) in a dataset, describing how far away the values are from the mean/average. The higher the Standard Deviation, the further away from that mean the values are and vice versa with a low SD.
It is a useful measure of spread for normal (i.e. bell curve) distributions of data, where most values are close to the average, with progressively fewer values as one moves further away from the mean.
The Best Brokers For Standard Deviation Trading Strategies


Mathematical Breakdown Of Standard Deviation (SD)
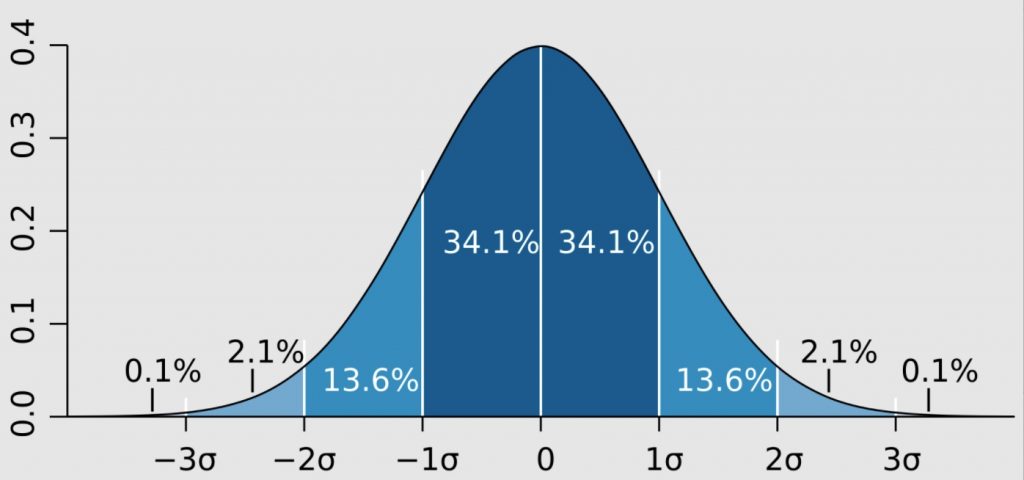
The empirical rule of 68/95/99.7 tells us that;
- Around 68% of scores are within 2 standard deviations of the mean,
- Around 95% of scores are within 4 standard deviations of the mean,
- Around 99.7% of scores are within 6 standard deviations of the mean. (See chart illustration below)
So, if the SD is 10, a two Standard Deviation event is +/- 20.
The formulas used to calculate both population and sample standard deviations are complex, though they can be found as a simple formula tool within certain spreadsheet software, including excel. A detailed explanation of the Standard Deviation Formulas can be found here.
Risk Management Tool
In financial terms it is applied to assess how risky a chosen investment is.
A low SD might indicate that an investment portfolio for example does not fluctuate widely over time.
One might expect an Index fund to have a lower SD of returns than a Growth fund, as the former’s aim is simply to match the return of its Index benchmark.
Alternatively, if an investor is content to see wider swings in values, they may decide to allocate to higher risk investments (e.g. Small Caps or Junk bonds) in order to achieve a higher rate of expected return.
SD is one of the key measures that analysts, fund managers and traders use to measure risk.
But one of the conceptual problems with SD is that it measures not risk, but uncertainty; a higher SD does not necessarily mean higher returns but a bigger range of returns.
It may not be relevant for a long-term investor to use SD to measure risk, as the true risk of an investment is actual loss.
Conversely, a lower range of returns (which would be more acceptable using this metric) might not be enough to justify the risk of holding the investment asset.
Also, it can be affected by extreme values (or outliers)- a portfolio SD of 10% annually does not protect an investor from a 30-40% loss, it just makes it appear very unlikely, but as the 1987 crash (which was a 19 SD event at the time) showed, they can still occur.
Standard Deviation also implicitly assumes a normal distribution of returns, which do not occur in returns from derivatives (e.g. options).
In these non-normal distributions, both skew and kurtosis commonly appear, making SD less useful in forecasting future returns and probabilities.
Notwithstanding this, Standard Deviation is a widely used metric for measuring risk as it is widely understood and easy to interpret. But it is not the last word in risk (or risk control).