How Do Banks Make Money? (Breakdown)


How do banks make money?
From the outside, banks can seem like more of a mystery relative to other businesses.
For most businesses, they make money by selling goods and services.
On the other hand, banks don’t sell traditional goods and work more with money and credit and use it to make even more money.
A lot of traditional analysis of companies is thrown out the window when analyzing financial institutions.
For example, you would not use enterprise value when finding the value of a bank or financial institution. Debt works differently with financial firms, because it’s used to create products.
EBITDA, for example, is not a meaningful financial metric for banks because interest is a key component of both revenue and expenses.
The balance sheet drives everything for a bank. You don’t start by projecting unit sales and prices like you do with a normal company.
Instead, you project loans and securities (interest-earning) and deposits and other sources of funding (interest-bearing).
Let’s dive into the various components.
Key Takeaways – How Do Banks Make Money?
- Banks primarily generate revenue through the interest margin, which is the difference between the interest earned on loans and the interest paid on deposits.
- They also earn money through various fees and charges for services like account maintenance, ATM usage, and loan origination, contributing to a significant portion of their income.
- Additionally, banks engage in investment activities, trading in financial markets, and offering wealth management services, which can bring in substantial profits, diversifying their revenue streams and mitigating risks.
Revenue Components
A bank’s revenues can be broken down into two major components.
The first is interest income.
This is revenue produced from extending loans to borrowers and/or investing in other earning assets, such as securities.
The second is fee revenue (also called noninterest income), which most commonly includes service charges on deposits (such as overdraft fees and other deposit charges), capital markets and asset management services, mortgage and loan fees, among others.
Bank revenue components
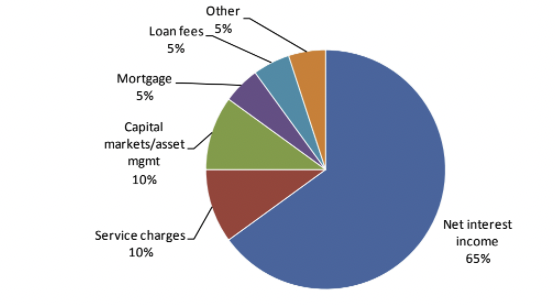
(Source: Deutsche Bank)
Net Interest Income – the Largest Source of Revenue at Banks
The largest component of a bank’s revenue is net interest income (NII).
It is common for NII to account for about 65 percent of revenues on average.
NII is the difference between the interest earned on a bank’s earning assets (i.e., loans, securities, and other interest earning investments) and the funding cost of a bank’s liabilities, which are made up of deposits and borrowings.
NII is a function of volumes (i.e., assets) and spreads (net interest margin).
For example, if a bank has assets of $100 billion and liabilities of $80 billion, if the interest earned on assets is 5 percent and the interest it incurs on its liabilities is 3 percent, then it’s total NII would be:
NII = $100B * 0.05 – $80B * 0.03 = $5 billion – $2.4 billion = $2.6 billion
Net Interest Margin
Net interest margin (NIM) is a key profitability metric for a bank.
NIM denotes the spread between interest income and interest expense dividend by average earning assets.
NIMs increased from the mid-1940s through the early-1990s.
Funding profiles and NIM
The secular rise in NIMs over the 20th century was a result of improved funding profiles.
Banks shifted towards core deposit funding and away from wholesale funding, higher concentration of loans relative to other lower yielding earning assets, and a shift towards higher yielding consumer instead of corporate loans.
Wholesale funding sources for American banks include, but aren’t limited to:
- Federal funds
- US Federal Home Loan Bank advances
- the Fed’s primary credit program
- public funds (such as state and local municipalities)
- foreign deposits
- brokered deposits, and
- deposits from the internet or CD listing services
Core deposits continue to be a key liability funding source.
However, many insured depository institutions may not be able to attract the kind of core deposits they want.
Accordingly, they may look to wholesale funding sources to satisfy their funding and liability management needs.
From the early 1990s through 2008, NIMs fell. This was largely a product of increased deposit and loan competition.
More recently, NIMs have increased again. This has reflected a combination of positive bank funding trends.
Deposit costs have been down, which has been driven partially by growth in low-cost deposits and the run off of higher-cost certificates of deposit (CDs) and improving loan spreads.
A steep yield curve will also help. This is due to the ability to borrow more cheaply at short-term yields and ability to lend at higher rates at longer-term yields.
Why some banks have higher NIMs than others
There are a variety of reasons why some banks have higher NIMs than others.
Differences are driven by a combination of:
- higher asset yields
- lower funding costs and
- equity capital levels
Asset yields
Asset yields are driven by the mix of assets.
For example, a higher proportion of loans often have higher margins than securities and other short-term earning assets, though it depends on the nature of the loans.
It could also be a function of a loan mix that’s biased more toward higher yielding types of loans. Credit card loans, for example, will have higher yields than commercial loans (of course, at the trade-off of higher default rates).
Funding costs
A bank with lower funding costs will commonly have a higher proportion of low-cost or non-interest bearing core deposits (in lieu of higher-cost CDs or brokered deposits).
Capital levels
A bank with a higher amount of equity capital will have a greater proportion of its funding that is non-interest bearing. This will benefit its NIM as a result.
Other
Other factors that impact NIM include:
- the amount of nonperforming assets
- interest rate risk in a bank’s securities portfolio, and
- the amount of loan and deposit competition that a bank has
NIMs should be considered in the context of credit and interest rate risk
Having a higher NIM makes a bank more profitable.
But how this higher NIM is achieved is important.
Some banks take on more risk than others to achieve higher NIMs, which can potentially lead to larger losses.
Higher NIMs can be a function of higher credit, duration, and/or liquidity risk. Moreover, the operating expenses associated with it can be much higher as well.
For instance, if a bank is more heavily in on consumer credit cards, these receivables carry some of the highest yields available in the banking industry. But they can also incur the highest credit losses as they’re often a source of subprime, unsecured lending.
Loans also normally have a higher margin than securities. But expenses can be higher and liquidity for loans is typically lower.
On the funding side, non-interest bearing (and low cost) deposits are a cheaper source of funding.
This can increase NIM, all else equal.
But it’s also important to factor in the amount of additional operating expenses associated with core deposits, such as branch expenses and others relative to the minimal operating expenses associated with borrowing from wholesale funding sources.
Loans
Loans make up the largest portion of a bank’s assets and NII loan portfolios make up the largest asset type on a bank’s balance sheet.
As a result, they are the greatest contributor to interest income.
Moreover, from a profitability standpoint, banks would prefer to make loans instead of buying securities.
This is because loans normally offer higher returns on a risk-adjusted basis.
However, the issue with loans is that they typically carry a greater amount of credit risk and lack the liquidity that most forms of securities offer.
Over the past several decades in the banking industry, loans have represented about 70 percent of assets and 75 percent of interest income.
Major loan categories
Banks are involved in various different loan types.
Below, we list the major categories:
Real estate
Real estate loans represent the largest loan category for banks, which make up more than half of loans for all commercial banks.
Real estate loans can be broken down into three major categories:
1) closed-end residential real estate (which represent about 25 percent of total loans);
2) revolving home equity (10 percent of total loans); and
3) commercial real estate (about 25 percent of total loans).
Commercial real estate includes construction, land development, and other land, as well as loans that are secured by farmland, multi-family (i.e., 5 or more) residential properties, and nonfarm nonresidential properties.
Commercial & Industrial (C&I)
Loans to businesses represent 20 percent of total loans.
Consumer
Consumer loans are loans to individuals (that aren’t secured by real estate) and include credit cards as well as loans to finance cars, mobile homes and student loans.
Consumer loans make up about 15 percent of total loans outstanding.
Other
Other includes:
- nonbank financial institutions
- unplanned overdrafts
- agricultural production
- foreign governments and foreign banks
- lease financing receivables
- loans for purchasing or carrying securities
- states and political subdivisions
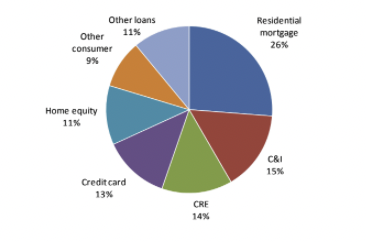
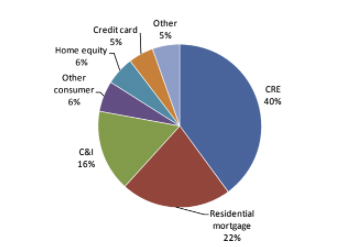
Highlighted in the graphs below are the loan mix of the largest 25 banks and smaller banks.
Smaller banks have meaningfully higher exposure to commercial real estate (CRE) at 40 percent of total loans vs. just 14 percent at the largest banks.
On the other hand, the largest banks have more home equity exposure (11 percent of total loans) versus just 6 percent for smaller banks.
Mix of loans – large banks
Mix of loans – small banks
Securities
Banks hold securities for three primary reasons:
1) as a source of liquidity;
2) to help manage interest rate risk (and potentially other forms of risk); and
3) as an earnings contributor (through both interest income and realizing gains/losses through the sale of securities).
Securities make up about 20 percent of banks’ total assets on average. They contribute a similar amount to interest income.
If loan demand shrinks due to a recession or there’s a steeper yield curve, it would make logical sense for banks to begin increasing their proportion of securities relative to loans.
They can also do so as a means to build capital ratios. This is because most securities require less capital support than most loans do.
This can boost profitability in the near term. But it also increases interest rate risk. This is a negative in a rising rate environment.
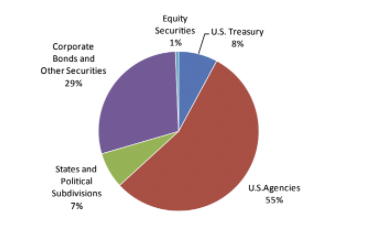
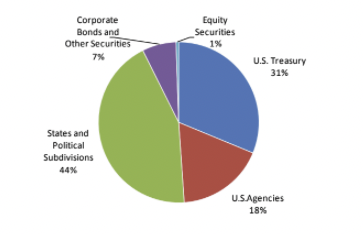
Over the past 40-plus years, due to declining risk-free yields in the United States especially, the mix of securities has shifted as banks have sought out higher yields.
Securities portfolios are now more heavily weighted towards government agency issued securities and corporate bonds with less allocated toward US Treasuries and state and municipal bonds that yield very low in nominal terms and negatively in real terms.
Bank portfolio mix (post-2008)
Bank portfolio mix (1980)
Buying securities during market downturns
Commercial and investment banks are in better shape than they were in 2008, but are unable or uninterested – due to regulation, law, risk management sobriety, or guaranteed profits from borrowing via the Fed discount window – to support asset prices in the event of a sharp downturn in asset markets.
Deposits
Deposits are a key driver of net interest income
By comparing banks’ deposit rates to market interest rates we can get a better understanding of how important deposits are to overall bank profitability.
Looking at the spread between deposit costs at the largest 25 banks and the two-year Treasury yield, the average spread has been about 140bps over the past 25 years.
(Looking at the two-year is a reasonable benchmark because two years is a good estimate of the average duration of bank deposits.)
Deposits not as valuable in a low-rate environment
However, with the low rate environment deposits are not as valuable currently.
More recently, this deposit spread has turned negative, reflecting low interest rates.
This has resulted in market interest rates being lower than deposit costs (which reflects a floor of zero percent on non-interest bearing deposits and longer-dated CDs/brokered deposits having a higher interest cost on average).
However, while there is a negative spread on deposits currently, deposits will become more valuable if and when market interest rates rise high enough.
In addition, as mentioned earlier, core deposits provide a stable source of funding and liquidity.
Deposit repricing may be greater when rates rise than in the past
Historically, deposit repricing has averaged about 40 percent of the increase in the fed funds rate.
However, when interest rates start to increase, deposit repricing may be higher.
This is because customers may seek higher yielding products as rates rise.
On top of that, commercial deposit customers draw down on deposits to invest and grow.
Noninterest Income (i.e., fee revenue)
Noninterest income accounts for about 35 percent of bank revenues.
Fee revenues have increased as a percentage of revenues (from about 18 percent in the late 1970s to their peak of just under 45 percent in 2003).
This increase reflected new fee structures and acquisitions/expansion into fee businesses (asset/wealth management, capital markets, etc).
More recently, non-interest income has been under pressure from regulatory-related changes, much of which came as a result of the 2008 financial crisis (e.g., overdraft/cards), generally weaker capital markets, and less gain on sale (mortgage revenue).
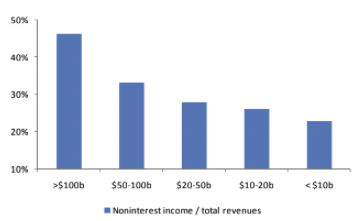
Fee income represents a larger portion of revenues at large banks (40-50 percent on average for banks with assets greater than $100 billion).
Smaller banks are more dependent on net interest income (fees represent less than 30 percent of total revenues for banks with less than $50 billion in assets).
Fees / total revenues by asset size
Deposit service charges
Deposit service charges typically account for the largest portion of banks’ fee revenue.
They represent around 15-20 percent of total non-interest income in for banks with assets of greater than $1 billion and 27 percent of noninterest income for banks with less than $100 million in assets.
Non-sufficient funds (NSF) and overdraft fees
Banks charge customers overdraft/non-sufficient fund (NSF) fees when they make a withdrawal and/or write checks when there are insufficient funds in the account to cover the transaction.
Historically, NSF fees represented about 50 percent of deposit service charges and generated $25-$38 billion of fees per year.
However, given past changes to Regulation E, banks are now required to have customers opt-in to NSF/overdraft programs related to debit cards and ATMs.
This has caused a meaningful decline in service charges at some banks.
Moreover, as part of the regulation passed after the financial crisis of 2008, banks regulated by the FDIC will have to implement additional changes that will reduce NSF fees (related to the order in which transactions are processed, how many NSF fees can be charged per day, and so on).
Expenses
Noninterest expense
Expenses incurred that are unrelated to funding costs. These are also known as operating expenses.
The largest portion is typically personnel expenses (wages, salaries, and other employee benefits), which represent about 40 percent of noninterest expenses.
Efficiency ratio
The efficiency ratio measures how efficiently a bank is managed.
The ratio is non-interest expense (ex expenses associated with the amortization of intangibles and goodwill impairments) divided by total revenue (i.e., net interest income (FTE) and noninterest income, excluding securities gains and other one-time items).
The average efficiency ratio for the banking industry going back to 1934 is slightly less than 65 percent.
Efficiency ratios have increased in the past few years given lower revenues and higher expenses related to higher environmental costs (including credit related, higher FDIC premiums, etc.).
For example, coming out of the 2008 financial crisis, 2010 benefited from some one-time gains at large banks.
Efficiency ratios tend to decline as asset size increases. Generally, the larger a firm gets the more it will have to tap into lower ROI opportunities.
However, this is the case only to a certain point. Banks with assets greater than $100 billion have higher efficiency ratios than banks with assets between $50-$100 billion.
However, part of this could be a difference in business mix – i.e., higher capital markets revenues, etc.
Credit expenses are currently elevated and are likely to remain so for some time
In addition to pressure from higher net charge-offs and building of loan loss reserves, banks are also faced with higher credit related costs that show up in noninterest expense, such as:
- other real estate costs related to foreclosed property
- credit and collection costs
- reserves for unfunded commitments
- mortgage application fraud and
- mortgage insurance
What is OREO/OREO expense?
Other real estate owned (OREO) is a property that is acquired through foreclosure or other types of legal proceedings.
Through the foreclosure process, real estate is marked down to its fair value and held on banks’ balance sheets as such.
OREO expense classification includes:
- any further gains or losses upon disposal
- increases/decreases in valuation allowance, or
- write-down subsequent to repossession
This expense is sometimes recorded as:
- ‘other real estate expense’
- ‘gain/loss on sale of foreclosed assets’ (or similar line item) or in some cases
- lumped into ‘other income/expense’
All of these different reporting procedures make it difficult to measure.
Banks can generally hold OREO for up to five years, but can hold it for up to an additional five years with the approval of state and federal regulators if they have made good faith efforts to dispose of the property.
OREO was more relevant after the financial crisis than it is now, but the accounting term is still widely used.
Summary – How does a bank make money?
A bank’s revenues can be broken down into two major components.
The first is net interest income, which represents about 65 percent of total bank revenue and is produced from making loans and investing in securities (and earning a spread on this over a bank’s cost of funds, mostly deposits).
The second is fee revenue, which most commonly includes deposit service charges, capital markets/asset management, mortgage and loan fees, among others. This represents the remaining 35 percent of revenue.
Total revenue is then deducted for expenses, which can be separated into interest expense (the cost of deposits and other borrowings) and noninterest expenses.
Noninterest expenses are further broken down into personnel costs and other operating expenses, the latter of which includes items such as foreclosed property costs, credit related costs, and so on.
The efficiency ratio is a measure of how well a bank is managed, with a lower ratio indicating a more efficient bank. The average efficiency ratio for the banking industry is slightly less than 65 percent.
Larger banks tend to have higher efficiency ratios, but this difference levels off at around $100 billion in assets.