List of Risk Premia


Risk premia refer to various forms of risk-taking that have positive expected compensation in markets over time.
Below we list out widely recognized risk premia.
We cover what they do, their common correlations, and how to get access to them.
Key Takeaways – List of Risk Premia
Core Macroeconomic and Market Premia
- Equity Risk Premium
- Credit Risk Premium
- Term (Duration) Premium
- Inflation Risk Premium
- Liquidity Risk Premium
- Volatility Risk Premium
Fixed Income and Credit Structure Premia
- Default Risk Premium
- Liquidity-Adjusted Credit Premium
- Curve Roll-Down Premium
- Callable / Prepayment Risk Premium
- Sovereign Risk Premium
Equity Style and Cross-Sectional Premia
- Value Premium
- Size (Small-Cap) Premium
- Momentum Premium
- Quality / Profitability Premium
- Low Volatility Premium
- Dividend Yield Premium
- Earnings Yield Premium
Derivatives, Options, and Volatility-Related Premia
- Variance Risk Premium
- Skewness Risk Premium
- Crash Risk Premium
- Tail Risk Premium
- Gamma Risk Premium
Carry, Relative Value, and Strategy-Based Premia
- Carry Premium
- Curve Carry Premium
- FX Carry Premium
- Commodity Backwardation / Contango Premium
- Roll Yield Premium
Alternative/Macro Strategy Premia
- Trend-Following (Time-Series Momentum) Premium
- Mean Reversion Premium
- Global Macro Risk Premium
- Liquidity Provision Premium
- Convergence / Arbitrage Premium
Behavioral and Structural Premia
- Illiquidity Premium
- Complexity Premium
- Leverage Aversion Premium
- Regulatory Capital Premium
- Forced Seller / Distress Premium
Real Assets and Idiosyncratic Premia
- Real Estate Risk Premium
- Infrastructure Premium
- Commodity Scarcity Premium
- Political / Geopolitical Risk Premium
- Country Risk Premium
Core Macroeconomic and Market Premia
Equity Risk Premium
The equity risk premium is the excess return that market participants expect for holding equities instead of risk-free assets.
It’s the most popular out of everything on this list.
It compensates for earnings volatility, drawdowns, and the long-duration cash flow uncertainty.
Over long horizons, this premium is driven by productivity, real economic growth (productivity + expansion in labor/inputs), and profitability.
Correlations
The equity risk premium is positively correlated with the credit risk premium during expansions.
It’s negatively correlated with the volatility risk premium during stress periods.
It also embeds an implicit term premium because equities behave like very long-duration assets. (The P/E ratio is commonly an effective proxy for a stock’s duration.)
Correlations tend to rise sharply in crises, which reduces diversification benefits.
Access
The most direct exposure is broad equity index ETFs such as total market or large cap funds. VOO, VT, VTI, SPY, and similar.
Factor tilts like value or profitability can modify the premium’s cyclicality, albeit imperfectly.
Skill is required mainly in risk management and valuation awareness for those who actively trade.
Security selection is generally not important to capture this premium since you can buy indexes (ETFs).
Credit Risk Premium
The credit risk premium compensates market participants for bearing default risk, downgrade risk, and the spread volatility inherent in corporate and structured debt.
It reflects both expected credit losses and the cyclicality of corporate balance sheets.
This premium is strongest when balance sheets are improving and weakest late cycle when spreads are tight.
Credit risk premiums tend to spike in recessions and compress during stronger market periods.

(Sources: Board of Governors of the Federal Reserve System (US); Ice Data Indices, LLC via FRED®)
Correlations
Credit risk is highly correlated with the equity risk premium since both depend on corporate cash flows.
It’s negatively correlated with the volatility risk premium during stress.
Credit also overlaps with liquidity premia. Spreads widen when funding conditions tighten.
Access
You commonly get exposure through investment-grade or high-yield bond ETFs, individual bonds, leveraged loan funds, or private credit vehicles.
LQD for investment-grade and HYG or JNK for high-yield are common.
Advanced access requires credit analysis.
Passive exposure gives you beta, while excess returns require avoiding defaults and forced sellers.
Term (Duration) Premium
The term premium compensates investors for holding longer-maturity bonds instead of rolling short-term bills.
It reflects the unknowns around inflation, growth, and central bank policy over time.
The term premium has been historically positive.
At the same time, the term premium can turn negative during periods of strong demand for safe assets.
This is called an inversion of the yield curve and commonly signals weaker economic growth ahead.
The 10-/2-year curve has been popular for measuring inversions. And for being an imprecise recession forecaster.
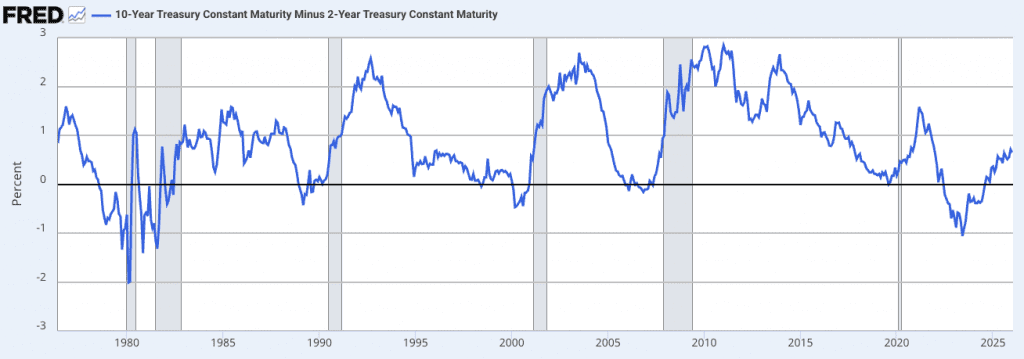
(Source: Federal Reserve Bank of St. Louis via FRED®)
Correlations
The term premium is negatively correlated with the equity risk premium during recessions. This tends to make it a traditional diversifier.
But during inflationary shocks, correlations can flip positive, which can reduce hedging effectiveness. It’s tightly linked to the inflation risk premium.
Access
You can gain exposure through intermediate and long-duration Treasury ETFs or futures.
IEF and TLT are common choices here.
Managing term risk well requires understanding yield curve dynamics, roll down, and convexity.
Active strategies often focus on curve positioning rather than outright duration bets.
Inflation Risk Premium
The inflation risk premium compensates traders for uncertainty in future purchasing power.
Inflation expectations are embedded in nominal assets.
The inflation risk premium has to do with deviations in expectations that are discounted into the pricing.
This premium tends to rise when fiscal dominance (i.e., fiscal policy dominates monetary policy as the primary driver of money and credit flows), supply shocks, or wage pressures increase.
Correlations
Inflation risk is negatively correlated with the term premium during inflationary regimes and negatively correlated with the equity risk premium when margins are squeezed.
It often has low or negative correlation with volatility premia until inflation shocks trigger broader market stress.
Access
Direct access is through inflation-linked bonds, breakeven inflation trades, or real asset exposure such as commodities.
ETFs holding TIPS offer a simple way to get exposure. Examples include TIP, STIP, VTIP.
More advanced exposure involves trading breakevens or inflation swaps, which requires macroeconomic modeling expertise.
Liquidity Risk Premium
The liquidity risk premium compensates for holding assets that can’t be sold quickly without price impact.
You capture it by:
- Accepting lockups or trading frictions
- Maintaining permanent capital
- Avoiding leverage mismatches
- Being able to buy when others are forced to sell
This is why endowments, insurers, and family offices capture more of it than retail investors.
This premium is expected to always be positive but episodic.
Correlations
Liquidity premia are negatively correlated with nearly all other risk premia during stress, as correlations converge toward one.
The liquidity risk premium is:
- Strongly negatively correlated with the volatility risk premium
- Highly correlated with credit and default premia
- Implicitly short volatility and short funding
- Highly correlated across assets in crises (correlation -> 1)
Access
Exposure comes from less liquid assets such as small cap equities, private credit, private equity, real estate, or off-the-run bonds.
ETFs partially capture this via small cap or micro cap exposure, but full access requires tolerance for lockups and mark-to-model risk.
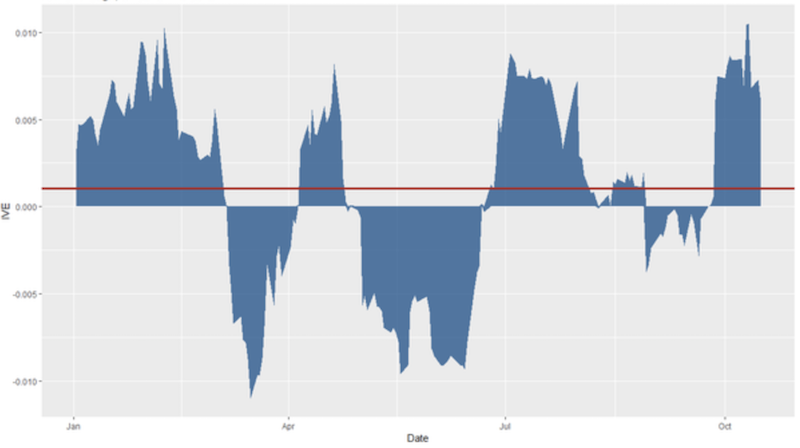
Volatility Risk Premium
The volatility risk premium reflects the tendency for implied volatility to exceed realized volatility because traders pay for downside protection.
Sellers of volatility earn this premium by providing insurance against tail events, though returns are negatively skewed.
In markets, you tend to find that traders are willing to overpay for volatility insurance, causing implied volatility to exceed realized volatility on average.
We can see this, for example, in how Apple’s options traded over most of 2018, for example, with the differential between the red line and zero line being the risk premium.
Correlations
Volatility premia are negatively correlated with the equity risk premium and credit risk premium, especially during crises.
They act as a funding source for other premia in calm markets but reverse violently when risk aversion spikes.
Access
Exposure is obtained by systematically selling options, variance swaps, or via volatility carry ETFs.
Covered call ETFs are also available that mix positive delta with options premium via sold call options.
Capturing the VRP requires strong risk controls, position sizing discipline, and stress testing for tail events.
This premium rewards process and risk management more than forecasting skill.
Related: VRP Portfolio Strategies
Fixed Income and Credit Structure Premia
Default Risk Premium
The default risk premium compensates investors for the probability of issuer failure and the severity of loss given default.
It reflects expected credit losses as well as uncertainty around recovery rates, legal outcomes, and macroeconomic stress.
This premium expands during recessions and contracts aggressively in late cycle environments when balance sheets appear strongest.
Correlations
Default risk is strongly positively correlated with the credit risk premium and equity risk premium, since corporate defaults rise when earnings deteriorate.
It’s sharply negatively correlated with the volatility risk premium and liquidity risk premium during crises. Defaults cluster when market liquidity falls.
Access
Exposure is typically gained through high-yield bond ETFs (e.g., HYG, JNK), leveraged loan funds, or distressed debt strategies.
Passive exposure captures the average loss experience.
Alpha generation requires deep credit analysis, capital structure modeling, covenant analysis, etc., and experience dealing with restructurings and bankruptcy processes (workout experience).
Liquidity-Adjusted Credit Premium
The liquidity-adjusted credit premium compensates traders for holding credit instruments that are costly to trade or finance, beyond pure default risk.
It reflects bid-ask spreads, dealer balance sheet constraints, and regulatory capital requirements.
This premium is persistent and tends to dominate returns during market stress.
Correlations
Liquidity-adjusted credit is highly correlated with the liquidity risk premium and volatility risk premium, especially during funding shocks.
It also amplifies the default risk premium. This is because illiquidity accelerates price declines even when fundamentals are unchanged.
Access
You can access this premium through off-the-run bonds, private credit, structured credit, or smaller issuers not included in major indices.
ETFs provide limited exposure here, unfortunately.
Full access will test your tolerance for episodic drawdowns, lower transparency, expertise in liquidity management, and valuation under stress.
Curve Roll Down Premium
The curve roll down premium comes from holding a bond as it ages and naturally moves down a positively sloped yield curve.
Even if yields don’t change, price appreciation occurs as the bond rolls toward lower yields.
This is a mechanical but economically meaningful source of return in fixed income portfolios.
Correlations
Roll down is moderately correlated with the term premium and can offset duration risk in stable rate environments.
During yield curve inversions, this premium can disappear or turn negative.
It has low correlation with equity risk except during regime shifts in monetary policy.
Access
Exposure is gotten through laddered bond portfolios, constant maturity bond ETFs, or curve steepener strategies.
Effective use requires understanding yield curve shape, rebalancing frequency, and transaction costs rather than credit analysis skill.
Related: Treasury Term Premium Harvesting Strategies
Callable / Prepayment Risk Premium
The callable or prepayment risk premium compensates for uncertainty in cash flow timing due to issuer call options or borrower refinancing behavior.
When rates fall, traders face reinvestment risk as higher-yielding bonds are redeemed early.
Since they’re probably going to want to own something similar to what they previously owned, they’re looking at a lower-yielding bond.
When rates rise, extension risk increases duration unexpectedly.
Correlations
This premium is closely tied to the term premium.
Prepayment behavior accelerates when rate volatility rises.
It has weak direct correlation with equity risk but can amplify losses during rate-driven sell-offs.
Access
You can access this premium through mortgage-backed securities ETFs (e.g., MUB), callable corporate bonds, and structured products that might be available at your broker.
Capturing it effectively requires option-adjusted spread (OAS) analysis, prepayment modeling, scenario-based interest rate expertise, and related specialized skills.
Sovereign Risk Premium
The sovereign risk premium compensates you for political instability, fiscal stress, currency risk, and the possibility of default by governments.
Unlike corporate credit, being company-specific, sovereign risk is heavily influenced by institutional credibility and monetary sovereignty.
For example, the US, Canada, and western Europe are primarily known for having some of the world’s safest government credit.
Emerging markets have riskier credit, and it varies a lot depending on said market.
Correlations
Sovereign risk in emerging markets is correlated with the global liquidity premium and US dollar cycles.
During global risk-off episodes, correlations with equity and credit premia increase sharply.
Developed market sovereign risk tends to hedge equity risk, while emerging market sovereign risk doesn’t.
Access
Exposure is obtained through emerging market debt ETFs and local currency bond funds.
Some are in FX (e.g., EMLC, EMB) while some are in USD (e.g., VWOMB).
Expertise is required in political analysis, balance of payments assessment, and currency regime dynamics to manage tail risks effectively.
Equity Style and Cross-Sectional Premia
Value Premium
The value premium reflects the tendency of stocks with low prices relative to fundamentals – e.g., low P/E, low P/B – to outperform more expensive peers over long horizons.
It compensates investors for exposure to distressed, cyclical, or structurally challenged businesses that the market discounts aggressively.
Returns are highly regime dependent and often require long holding periods.
Correlations
Value is positively correlated with the equity risk premium and credit risk premium.
It’s negatively correlated with momentum during growth-driven markets.
It tends to underperform when real rates fall sharply – this benefits long-duration names – or when intangible capital dominates returns.
Access
Exposure is commonly achieved through value factor ETFs or systematic multi-factor funds.
Stock-picking is common here too, looking for “down and out” names for “deep value” or companies with high earnings relative to its price for standard value considerations.
Capturing the premium will require patience, diversification, tolerance for drawdowns, and elongated periods of simply things not working out like you hoped.
Active value investing requires deep fundamental analysis and cycle awareness.
Size (Small Cap) Premium
The size premium compensates investors for holding smaller companies with less stable earnings, limited access to capital, limited sell-side coverage (i.e., essentially marketing for the stock/company), and higher business risk.
Historically, small caps have delivered higher average returns but with greater volatility and drawdowns.
We covered here that the size premium has fallen in recent years.
We think this is probably due to better market efficiency (better information) and factor crowding (i.e., factors becoming more widely known).
Correlations
Size is positively correlated with the liquidity risk premium and equity risk premium.
And it’s negatively correlated with the low volatility premium.
It performs best in early cycle recoveries and poorly during liquidity contractions.
Access
Investors typically gain exposure through small cap equity ETFs or dedicated indices.
Examples would be IWM, VB, VBR (value-focused), and VTWO.
Full access to the premium requires broad diversification, rebalancing discipline, and tolerance for higher turnover and transaction costs.
Momentum Premium
The “what goes up keeps going up” phenomenon…
The momentum premium comes from the tendency of assets with strong recent performance to continue outperforming over intermediate horizons.
It generally has to do with behavioral biases, institutional constraints, and risk-based compensation for crash/unwind risk, rather than fundamental valuation.
It’s been proven across decades of data (since the late 1800s) and pervasive across multiple asset classes: stocks, bonds, commodities, currencies, index futures.
- Long winners, short losers
- Equity-centric historically
- Relative returns matter, not absolute direction
- Typically equity-factor based
This premium is procyclical and can crash during sharp reversals.
Correlations
Momentum often has low or negative correlation with value and can act as a partial hedge during equity drawdowns.
But it’s vulnerable to sharp reversals during market regime shifts.
This makes indirectly exposed to volatility risk.
For a fuller chart of factor correations, we have this chart here, with momentum highlighted:
Factor Correlations: International Markets ex US
| Factor | Key | Rm-Rf | SMB | SMB5 | HML | MOM | RMW | CMA | Annualized Return | Annualized Standard Deviation |
|---|---|---|---|---|---|---|---|---|---|---|
| Market | FF-MKT-RF | 1.00 | -0.16 | -0.19 | -0.06 | -0.30 | -0.26 | -0.30 | 3.65% | 15.96% |
| Size (FF3) | FF-SMB | -0.16 | 1.00 | 0.99 | -0.09 | 0.13 | -0.02 | -0.07 | -0.44% | 6.68% |
| Size (FF5) | FF-SMB5 | -0.19 | 0.99 | 1.00 | 0.03 | 0.11 | -0.04 | 0.02 | 0.48% | 6.60% |
| Value | FF-HML | -0.06 | -0.09 | 0.03 | 1.00 | -0.27 | -0.42 | 0.64 | 4.53% | 8.09% |
| Momentum | FF-MOM | -0.30 | 0.13 | 0.11 | -0.27 | 1.00 | 0.35 | -0.05 | 7.36% | 11.70% |
| Profitability | FF-RMW | -0.26 | -0.02 | -0.04 | -0.42 | 0.35 | 1.00 | -0.34 | 3.37% | 4.75% |
| Investment | FF-CMA | -0.30 | -0.07 | 0.02 | 0.64 | -0.05 | -0.34 | 1.00 | 1.68% | 6.09% |
| Factor correlations and returns statistics from November 1990 to August 2025 | ||||||||||
Access
Exposure is available through momentum factor ETFs or systematic trend strategies.
Momentum captures involves following strict rules*, frequent rebalancing, and acceptance of episodic crashes.
Forecasting skill is less important than process discipline.
* Momentum is usually measured using past 12-month performance, excluding the most recent month to avoid short-term noise.
Quality / Profitability Premium
The quality or profitability premium rewards firms with strong balance sheets, stable earnings, and high return on capital (ROC).
It reflects preference for safety and endurance in cash flows, particularly during uncertain economic conditions.
Correlations
Quality is moderately negatively correlated with value and positively correlated with the low volatility premium.
It tends to outperform when growth slows and credit conditions tighten, acting as a defensive equity factor.
Access
Investors access this premium via quality factor ETFs or profitability-screened indices.
Active strategies often focus on accounting analysis, earnings sustainability, and capital allocation discipline to improve returns.
Low Volatility Premium
The low volatility premium describes the empirical tendency for lower risk stocks to deliver comparable or superior risk-adjusted returns than higher volatility stocks.
The higher vol stocks might expect to get you more return over the long run – like the NASDAQ outperforming the S&P 500 by about ~2% per year but with 50% higher volatility.
But it generally doesn’t give you fair compensation on the basis of packing the most return into each unit of risk
It’s often attributed to leverage constraints and behavioral preferences for lottery-like payoffs, especially among retail traders.
Correlations
Low volatility is negatively correlated with the equity risk premium in strong bull markets and positively correlated during drawdowns.
It overlaps with quality and dividend factors.
Access
Exposure is commonly achieved through low volatility or minimum variance ETFs.
USMV and SPLV are examples of minimum variance ETFs.
Here you need to understand concentration risks and interest rate sensitivity embedded in these portfolios.
Dividend Yield Premium
The dividend yield premium compensates you for holding stocks that return capital through cash distributions.
It’s both a) an income preference and b) the perceived maturity or stability of the underlying businesses.
Correlations
Dividend yield overlaps with value and low volatility premia and is sensitive to the term premium, as dividend stocks often trade like long-duration assets – i.e., relative to bonds and fixed income.
Rising rates can compress valuations.
Access
You gain exposure through high dividend yield ETFs (e.g., VYM) or income oriented equity funds.
Effective use requires awareness of sector concentration and payout sustainability.
Earnings Yield Premium
The earnings yield premium has to do with the tendency for stocks with high earnings relative to price to outperform over time.
Doesn’t this sound like value?
It is closely related to value, but it focuses explicitly on current profitability rather than book metrics like P/B.
Correlations
Earnings yield is positively correlated with value and negatively correlated with momentum during speculative phases.
It performs best when profitability is rewarded over growth narratives.
This often happens late cycle.
It can even perform well as a pair trade during equity drawdowns when shorting out the opposite (companies that don’t yield much relative to their price).
An example would be long VTV/short VUG.
Access
Exposure is available through value-oriented ETFs (e.g., VTV) or earnings-weighted indices.
Active strategies emphasize normalized earnings analysis to avoid cyclical distortions.
Derivatives and Volatility-Related Premia
Variance Risk Premium
The variance risk premium reflects the systematic difference between implied variance priced into options and realized variance that subsequently occurs.
Isn’t this the same as the volatility risk premium?
Here’s how they differ:
| Aspect | Variance Risk Premium | Volatility Risk Premium |
| Precision | Exact, model-based | Conceptual, aggregate |
| Tradability | Variance swaps | Options, VIX products |
| Includes tails | No | Yes |
| Squared risk | Yes | Not necessarily |
| Used in | Academic pricing, systematic strategies | Asset allocation, hedge fund risk premia |
The volatility risk premium (VRP) includes:
- Variance risk premium
- Skewness risk premium
- Tail risk premium
- Gamma risk premium
- Crash insurance demand
Variance is the first moment of volatility pricing. The volatility risk premium includes higher-order risks.
Sellers of variance earn this spread but accept exposure to sudden volatility spikes.
Correlations
The variance risk premium is negatively correlated with the equity risk premium and credit risk premium, particularly during market stress when implied volatility rises a lot.
It’s closely related to the broader volatility risk premium and tends to collapse when liquidity deteriorates.
Access
Exposure is obtained through systematic option- or derivative-selling strategies, variance swaps (traditionally), or volatility carry ETFs.
Effective implementation requires strong risk controls, position sizing, and an understanding of variance term structure rather than market direction.
Skewness Risk Premium
The skewness risk premium compensates for bearing asymmetric downside risk – most notably exposure to left tail events.
Equity markets typically price downside protection at a premium, reflected in higher prices for out-of-the-money put options relative to calls.
Correlations
Skewness premia are negatively correlated with the equity risk premium during crises.
They’re positively correlated with the tail risk premium.
They are sensitive to changes in investor fear and crash expectations.
They often rise before broader volatility measures.
Access
You gain exposure by selling downside skew through put spreads or structured option strategies.
Capturing this premium requires expertise in option pricing, tail risk modeling, and careful management of extreme event exposure.
Crash Risk Premium
The crash risk premium compensates traders for exposure to rare, but severe, market drawdowns.
This premium exists because market participants consistently pay up to hedge against sudden collapses driven by leverage, forced deleveraging, or systemic shocks.
Correlations
Crash risk is strongly negatively correlated with the equity risk premium and liquidity risk premium during stress.
It overlaps with skewness and tail risk premia.
But it’s more concentrated in discrete, extreme outcomes.
Access
Exposure is typically obtained by selling deep out-of-the-money put options or doing carry trades that are vulnerable to crashes.
Successful participation in this requires strict risk limits.
Diversification across maturities and awareness of macro regime shifts help as well.
Tail Risk Premium
The tail risk premium reflects the compensation required for bearing losses in extreme, low probability scenarios.
Unlike variance or skewness premia, tail risk focuses on the far ends of the return distribution rather than day to day volatility.
Correlations
Tail risk premia are negatively correlated with nearly all growth-oriented premia during crises, as tail events tend to coincide with spikes in volatility, illiquidity, and credit stress.
They’re closely linked to crash risk and skewness premia.
Access
You gain access to this premium through systematic option selling, catastrophe bonds, or strategies that warehouse tail exposure.
Gamma Risk Premium
The gamma risk premium compensates investors for providing liquidity to option markets by being short gamma.
Short gamma positions lose when markets move fast (against the position) and gain when prices are stable.
They effectively monetizing market calm when short gamma.
Correlations
Gamma premia are negatively correlated with the volatility risk premium and amplify losses during sharp directional moves.
They’re positively correlated with carry strategies and perform best in low volatility environments.
Though low vol tends to beget lower priced vol going forward, which lowers the compensation.
Access
Exposure is achieved through delta-hedged option selling or market-making style strategies.
This premium requires continuous monitoring and operational expertise.
This makes it less suitable for passive investors. It’s more applicable for sophisticated active traders.
Carry, Relative Value, and Strategy-Based Premia
Carry Premium
The carry premium is the return earned from holding an asset with a positive yield or income while prices remain unchanged.
It’s fundamentally compensation for bearing funding risk, drawdown risk, and exposure to sudden regime shifts.
Carry tends to perform steadily in stable environments and fails abruptly during stress.
For example, a 5% carry strategy may gain ~28% in 5 years (not 25% because of compounding), but then lose it all in a month when the market falls a lot during a major risk-off event (e.g., 2008, Covid).
Correlations
Carry strategies are positively correlated with the equity risk premium and credit risk premium in benign conditions and sharply negatively correlated with the volatility risk premium during shocks.
Carry is effectively short volatility and short liquidity.
Access
Exposure is obtained through systematic carry strategies across rates, credit, FX, or commodities.
ETFs capture some forms, but full access typically requires futures, swaps, and disciplined risk management frameworks.
Curve Carry Premium
The curve carry premium is earned by holding positions that benefit from the shape of the yield curve, independent of outright rate moves.
This includes roll down effects and spread carry between maturities. It reflects compensation for exposure to curve reshaping risk.
Correlations
Curve carry is closely related to the term premium.
It’s sensitive to monetary policy expectations.
It has low correlation with equity risk in stable environments. But it can turn negatively correlated during aggressive tightening cycles.
Access
You gain exposure through yield curve steepener or flattener trades using Treasury futures or swaps.
Expertise in yield curve dynamics, macro policy, rates strategies, and position sizing is essential here.
FX Carry Premium
The FX carry premium comes from borrowing in low interest rate currencies and investing in higher-yielding currencies.
Returns are driven by interest rate differentials but are vulnerable to sudden currency depreciations during global risk-off episodes.
Related: FX Carry Strategy
Correlations
FX carry is positively correlated with the global equity risk premium.
Also positively correlated to liquidity conditions.
It’s strongly negatively correlated with the volatility risk premium – as a lot of these are – as currency crashes tend to coincide with volatility spikes.
Access
Exposure is available through FX carry ETFs or systematic currency baskets.
Professional access often uses forwards or swaps.
Doing this well generally requires diversification across currencies and macro awareness.
Commodity Backwardation / Contango Premium
The commodity backwardation or contango premium reflects returns driven by the shape of futures curves.
Backwardation rewards holders through positive roll yield. (Oil is commonly, but not always, backwardated.)
Contango imposes a cost as contracts are rolled forward. (Gold and stocks are almost always in contango.)
Correlations
This premium is influenced by inventory cycles and supply constraints rather than equity markets, giving it lower correlation with the equity risk premium.
However, it can become correlated during inflationary shocks.
Access:
You access this premium via commodity futures ETFs or roll optimized commodity indices/ETFs.
Understanding storage economics, seasonality, and curve structure is important for effective exposure.
Related: Backwardation and Contango Convergence Strategies
Roll Yield Premium
The roll yield premium is the gain or loss from rolling futures contracts as they approach expiration.
It has to do with the convergence of futures prices toward spot prices over time and is a core driver of returns in futures-based strategies.
Correlations
Roll yield overlaps with carry and curve premia and is sensitive to liquidity and volatility conditions.
Negative roll yield often coincides with periods of excess supply or weak demand.
Access
Exposure is obtained through futures-based ETFs across commodities, rates, or volatility.
Active roll management and contract selection improve outcomes.
So, this is very much process-driven rather than forecast-driven.
Alternative and Macro Strategy Premia
Trend-Following (Time-Series Momentum) Premium
The trend-following or time-series momentum premium has to do with the tendency of assets with persistent price trends to continue moving in the same direction across multiple asset classes.
Isn’t this the same as momentum?
Short answer: no. But they’re closely related and often confused.
Trend-following and the momentum premium share a common behavioral root.
But they are distinct premia with different mechanics and portfolio roles.
This premium tends to perform best during sustained macroeconomic drivers.
For example, when Europe was engaging in a long-term bond-buying program and the US was actively shedding bonds from its balance sheets, that led to a sustained rise in the USD against the EUR.
So, the trend-following premium refers to absolute price endurance within the same asset over time. The strategy goes long or short based on whether an asset’s own past returns are positive or negative.
- Directional exposure
- Long or short the same asset
- Cross-asset and macro-driven
- Can involve shorting
Correlations
Trend-following often shows low or negative correlation with the equity risk premium.
It can be positively correlated with the volatility risk premium in stress periods, as large price moves create strong trends.
Access
You can access this premium through managed futures/CTA funds and trend-following ETFs like CTA or DBMF, or systematic futures strategies.
It involves rules-based systems and diversification across asset classes.
Mean Reversion Premium
The mean reversion premium comes from the tendency of prices or spreads to revert toward historical averages after dislocations or elongated runs in one direction or another.
Correlations
Mean reversion is negatively correlated with trend-following and somewhat positively correlated with the liquidity risk premium.
It can perform well in range-bound markets but suffers during regime shifts and momentum crashes.
Access
Exposure is available through relative value strategies, stat arb, or short-term trading systems.
Expertise in signal decay (e.g., trend exhaustion) can be valuable.
Global Macro Risk Premium
The global macro risk premium reflects returns earned from positioning across asset classes based on macroeconomic themes such as growth, inflation, political strife, and policy divergence.
It’s less a single factor and more a synthesis of multiple underlying premia.
It’s about monetizing big-picture global factors.
Correlations
Global macro strategies have variable correlations depending on positioning.
They can be diversifying relative to equity risk.
But they often embed exposure to carry, trend, and term premia.
Access
Investors access this premium through discretionary or systematic macro funds and ETFs.
HFGM and ALLW are example ETFs to obtain access.
Effective participation requires strong macro training and frameworks (if you’re doing it on your own), scenario analysis, and risk budgeting.
It’s less about security selection.
Liquidity Provision Premium
The liquidity provision premium compensates for providing immediacy during periods of market stress.
Market makers and contrarian traders earn this premium by absorbing order flow when others are forced to transact.
Correlations
Liquidity provision is negatively correlated with the volatility risk premium and liquidity risk premium during stress.
Returns are lumpy and concentrated during dislocations.
Access
Exposure is gained through market making strategies, short term mean reversion, or providing bids in stressed markets.
This premium requires operational expertise and a strong balance sheet.
Convergence / Arbitrage Premium
The convergence or arbitrage premium comes from pricing discrepancies between related securities that are expected to converge over time.
Examples include merger arbitrage, pairs trading, and capital structure arbitrage.
Correlations
Convergence strategies are generally low correlation to equity markets in normal conditions.
But they can become correlated during systemic stress when funding dries up.
They’re highly sensitive to the liquidity risk premium.
Access
Investors access this premium via hedge funds, event-driven ETFs, or highlight specialized vehicles.
ARB is one such ETF example pertaining to merger arbitrage.
Success here requires legal expertise, funding stability, and risk management to withstand delayed convergence.
Behavioral and Structural Premia
Illiquidity Premium
The illiquidity premium compensates investors for holding assets that cannot be quickly converted to cash without significant price impact.
It arises from trading frictions, limited market depth, and the opportunity cost of capital being locked up.
This premium is persistent and increases sharply during periods of market stress.
Correlations
Illiquidity is positively correlated with size, credit, and default risk premia.
It’s negatively correlated with the volatility risk premium (like a lot of things) during crises as correlations converge.
It also overlaps materially with the liquidity-adjusted credit premium.
The lack of continuous pricing makes valuation hard to judge.
But not seeing the price shouldn’t be confused for safety.
Access
Exposure is obtained through private equity, private credit, real estate, microcap equities, and off-the-run bonds.
ETFs capture only partial exposure.
Full access requires long time horizons, long lockups, permanent capital, tolerance for valuation opacity, and liquidity planning discipline.
For those short on funds, this can also mean starting your own side projects.
Complexity Premium
The complexity premium compensates you for analyzing and holding securities with complicated structures, cash flows, or legal features.
Many avoid complexity due to operational, regulatory, time, or skill-based constraints.
This, in turn, creates the mispricing.
Also, algorithms have difficulty with these types of products, so it’s a good avenue for discretionary traders/investors.
In short, it’s compensation for being willing and able to understand something others can’t/won’t take the time to learn.
Example
So, this premium is more abstruse than others, so let’s give examples where this might be relevant:
- Bank trust preferred securities
- Convertible preferreds with contingent features
- CLO mezzanine tranches
- Structured notes with embedded options (one of the most popular)
- Capital structure arbitrage situations
- Insurance-linked securities with bespoke triggers
Example Security: Non-Agency Residential Mortgage-Backed Security (Legacy RMBS)
A non-agency RMBS issued before the GFC and still trading today is a textbook complexity-premium instrument.
Features:
- Cash flows depend on thousands of underlying mortgages with heterogeneous borrower characteristics
- Prepayment behavior is path-dependent and interest-rate sensitive
- Credit losses depend on housing prices, regional employment, and loan vintage
- Tranche structure introduces waterfall mechanics, trigger tests, and loss allocation rules
- Legal rights depend on pooling and servicing agreements that must be interpreted and aren’t easy to model
This combination makes the security opaque to simple factor models and algorithms.
It’s also unattractive to investors who can’t underwrite cash flows loan by loan.
Correlations
Complexity premia have low correlation with the equity risk premium but are positively correlated with liquidity and regulatory capital premia.
During stress, complexity is often punished as transparency becomes paramount.
The excess return isn’t compensation for equity beta. It comes from:
- Modeling effort and legal analysis
- Operational friction and data costs
- Balance sheet and regulatory constraints on banks
- Investor aversion to mark-to-model assets
Access
Investors gain exposure through structured products, asset-backed securities, preferred securities, and esoteric credit.
Capturing this premium requires specialized analytical expertise, legal understanding, operational infrastructure, and so on, depending on what exactly you’re analyzing.
Leverage Aversion Premium
The leverage aversion premium comes from the fact that many market participants are restricted from using leverage.
The way this behavior plays out in markets is that they therefore overpay for high beta assets while underpricing low beta assets.
This creates excess returns for leveraged low-risk portfolios.
Correlations
This premium underlies the low volatility and quality equity premia and is inversely correlated with the equity risk premium during strong bull markets.
It interacts closely with the term premium in fixed income.
Access
Traders access this premium by combining low volatility assets with modest leverage. Or via minimum variance equity strategies.
Disciplined leverage management and strong drawdown controls are important.
Regulatory Capital Premium
The regulatory capital premium compensates traders for holding assets that are penalized under bank and insurance capital frameworks.
These assets trade at discounts because regulated institutions can’t hold them efficiently.
Correlations
Regulatory capital premia are positively correlated with credit and liquidity premia and tend to widen during periods of regulatory tightening or balance sheet stress.
Access
Exposure is obtained through securitized credit, subordinated bank debt, and off-balance sheet exposures.
Expertise in regulatory regimes and capital rules is essential to avoid unintended risk concentrations.
Forced Seller / Distress Premium
The forced seller or distress premium comes from when investors must liquidate assets regardless of price due to margin calls, redemptions, or regulatory constraints.
Buyers willing to provide capital earn excess returns for absorbing this supply.
Correlations
This premium is negatively correlated with the volatility risk premium and positively correlated with the liquidity provision premium.
It spikes during crises when correlations across assets increase.
Access
You can access this premium through distressed debt, special situations, or tactical rebalancing into stressed assets when markets are down.
Success requires dry powder and patience.
Real Assets and Idiosyncratic Premia
Real Estate Risk Premium
The real estate risk premium compensates you for bearing property-specific risks, including leverage, cyclicality in rents, vacancy risk, and sensitivity to financing conditions.
Returns are driven by income yield, inflation linkage, and local supply constraints rather than pure economic growth.
Correlations
Real estate has moderate positive correlation with the equity risk premium and strong sensitivity to the term premium due to financing costs.
During inflationary environments, correlations with commodities can rise. Liquidity stress increases downside risk.
Access
You can gain exposure through REIT ETFs, private real estate funds, or direct property ownership.
Private markets offer higher illiquidity premia but require expertise in underwriting, local market dynamics, and leverage management.
Infrastructure Premium
The infrastructure premium gives compensation for long-lived, capital-intensive assets with regulated or contracted cash flows.
These assets offer relatively stable income streams.
But they carry political, regulatory, and refinancing risks.
They also have long lead times.
Correlations
Infrastructure often has lower correlation with the equity risk premium than general equities but remains sensitive to interest rate risk and regulatory changes.
It can overlap with the inflation risk premium when revenues are indexed.
Access
Exposure is obtained through listed infrastructure ETFs (e.g., IGF) or private infrastructure funds.
Here you’re going to need to know regulatory frameworks and long-duration cash flow modeling.
Commodity Scarcity Premium
The commodity scarcity premium compensates you for exposure to physical supply constraints, long development cycles, and inventory drawdowns.
Prices respond asymmetrically to shortages, creating episodic but strong returns.
Correlations
Scarcity premia have low correlation with equities in normal times but rise sharply during inflationary or geopolitical shocks.
For example, in oil the start of the Gulf War in January 1991 and the bombing of the Al-Abqaiq processing plant in September 2019 were huge upward price shocks.
They are closely linked to the inflation risk premium and can somewhat hedge monetary debasement.
Access
You can access this premium through commodity futures ETFs (e.g., GSG, COMT), producers’ equities, or physical holdings.
Futures based exposure requires managing roll yield and curve structure dynamics.
Political / Geopolitical Risk Premium
The political or geopolitical risk premium has to do with compensation for uncertainty that come from policy shifts, conflict, sanctions, and regime instability.
This premium is unevenly distributed and often underpriced until events materialize.
Correlations
Geopolitical risk tends to spike alongside the volatility risk premium and can cause sudden correlation breakdowns across assets.
It often benefits safe haven assets like gold while harming risk-sensitive premia like credit or equities.
Access
Exposure is indirect and typically managed through diversification, options, or selective exposure to defense, energy, or safe-haven assets.
Expertise requires geopolitical analysis and scenario planning rather than pure financial modeling.
Country Risk Premium
The country risk premium compensates investors for macroeconomic instability, institutional weakness, currency risk, and capital controls in specific jurisdictions.
It’s distinct from corporate credit risk and often dominates returns in emerging markets.
Correlations
Country risk is highly correlated with the global liquidity premium and US dollar cycles.
During risk-off periods, correlations with equity and credit premia increase sharply.
Access
You can gain exposure through emerging market equity and bond ETFs or country-specific funds.
Direct investment is a possibility if you have access.
Managing this premium requires political analysis and diversification across regions.