Hedging Smarter: Using Ratio Spreads to Finance Protection


Let’s say you’re trading a market and you want the upside, but want to limit the downside, but don’t want to pay an arm and a leg to protect against it.
What do you do?
In this article, we provide one idea.
Key Takeaways – Using Ratio Spreads to Finance Protection
- Goal: keep most upside, limit downside, avoid high protection costs.
- Structure: +1 stock, -2 calls @+23%, +1 call @+46%, +1 put @~spot or slightly below, -2 puts @-15%.
- Payoff:
- Stock-like gains up to 800 (≈ +23%).
- Peak profit at 800.
- First ~15% down cushioned by put spread.
- Losses flatten below 550 if a deep put is added.
- Risk zones: extreme rallies (+40% or more) or sharp crashes beyond -20%.
- Edge: ratio spreads finance the hedge, reducing cost.
- Works best in range-bound, mildly bullish markets.
Probability Distribution of Stocks
Here are some things we generally know is true of stocks.
They go up in around 76% of the years.
They average around 6-10% returns per year.
Up years rarely run more than 30% per year.
When they fall, they generally don’t fall more than 20% per year, though obvious exceptions exist.
And we more or less see this discounted in the probability distribution.
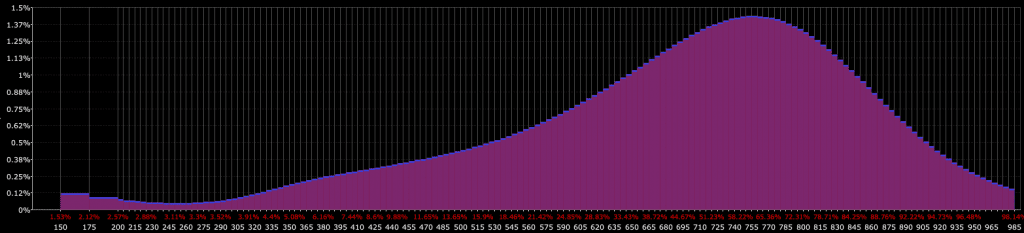
So instead of having a purely linear exposure to the stock market, can we improve on this?
Here’s an example…
Legs of the Trade
Let’s say the stock/index you’re trading is at $650.
- +1 Stock (long underlying)
- -2 Calls @ 800 (~23% above spot)
- +1 Call @ 950 (~46% above spot)
- +1 Put @ 640 (roughly at spot or just below)
- -2 Puts @ 550 (~15% below spot – i.e., your first 15% in losses are roughly protected)
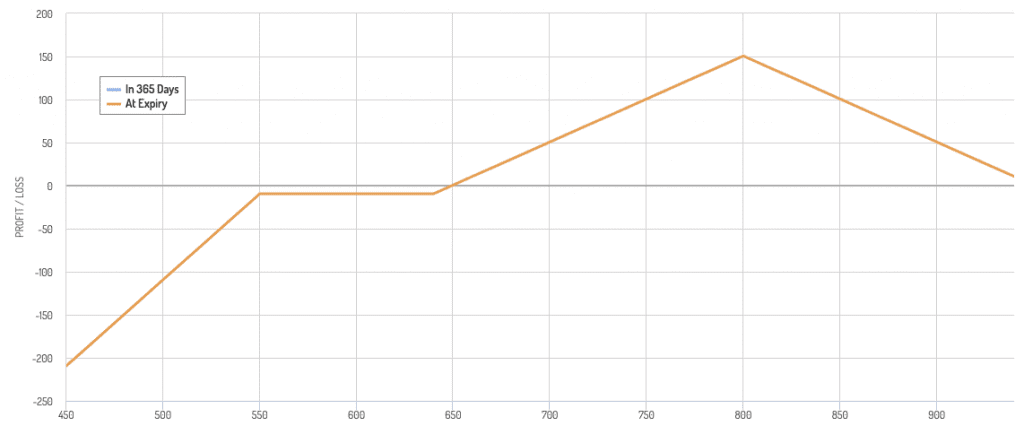
It looks like this:
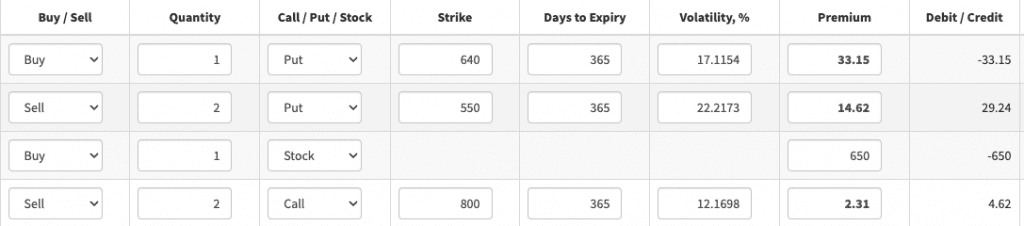
Plus, the one 950 call (optional).
To cap downside, you can also buy one 450 put.
Step-by-step Intuition
The stock leg (+1 underlying)
In isolation, it gives you unlimited upside and full downside risk.
The call structure (-2C800 +1C950)
This is essentially a short call spread with extra risk. By itself:
- After 800, the short 2 calls dominate, pulling payoff down.
- The risk can be capped by going long a 950 call.
The put structure (+1P640 -2P550)
This is a put ratio spread:
- Acts as insurance if price falls below 640.
- Below 550, losses continue.
Combined effect
- Below 550: Payoff continues at a defined loss
- Between 550 and 640: The long put dominates, protecting you from bigger drops.
- 650 to 800: You ride stock gains, net positive.
- At 800: Peak profit (about +150).
- After 800 -> 950: Profit declines because of short calls.
- After 950: Losses/eroding profits capped.
Breakeven Points and Risk Zones
This structure creates a sweet spot, but also two danger zones if things move too far.
Here’s our graph again for easy reference:
Starting at 650, the trade makes money steadily up to 800, where it peaks. Beyond 800, gains shrink, and by roughly 920 (about +40% from spot) you’re back near breakeven.
If the stock runs too far, the extra short call drags you down.
On the downside, protection begins below 640, but the real floor is around 550 (about -15% from spot). Past that, losses flatten near -200 if you buy a 450 put.
In between, from 550 to 800, you have positive or limited-risk exposure.
Most of the Time This Works Well: How Often Does It Not?
So, this strategy would work well most of the time, when it stays range-bound.
How often does it not?
Declines
Since 1950, the S&P 500 index has declined by 20% or more on 13 different occasions over a 75-year period (1950-2025).
This works out to roughly 17% of years experiencing crashes of -20% or more.
Bear markets (declines of 20% or more) happen approximately twice a decade, which aligns with the frequency data showing about 13 occurrences since 1950.
Rallies
For extreme rallies of +40% or more within one year, this is less common, but historically these are much rarer than crashes.
Based on historical S&P 500 data, years with gains of 40% or more have occurred roughly 3-5 times since 1950, making them occur in approximately 4-7% of years.
Combined Frequency
When you add both extreme movements together, you’re looking at roughly 20-25% of years experiencing either extreme rallies (+40% or more) or sharp crashes (beyond -20%).
It’s worth noting that 30%, 40%, and 50% declines are progressively less common. But they do still occur. And the same pattern applies to extreme rallies (the higher the threshold, naturally the rarer these events become).
This means that in any given year, there’s roughly a 1-in-4 to 1-in-5 chance of experiencing either an extreme rally or a significant crash in the US stock market, specifically, which would not be a great environment for this particular strategy.
Why Not Just Buy Puts?
When traders think about protecting downside risk, the simplest idea is to buy a put.
A long put gives you the right to sell the stock at a chosen strike, which caps your losses.
It’s straightforward, but there’s a problem: cost.
The Expense of Protection
Outright puts aren’t cheap.
If you buy them regularly as insurance, the premiums stack up.
Over time, those costs can drag performance far below the market.
For example, protecting a stock index with one-year puts at-the-money can eat several percentage points of expected annual returns.
Probability vs. Cost
Markets price puts based on the chance of big declines.
But as we know, most years stocks don’t fall 20% or more.
That means you’re often paying for insurance that goes unused.
The mismatch between the average cost of puts and the actual frequency of crashes makes straight put buying unattractive as a long-term solution.
Smarter Alternatives
The structure we’ve outlined does something different.
Instead of bleeding premium every year, it offsets the cost of protection by selling options where the odds favor you.
The short calls and short puts help finance the long put, turning what would otherwise be an expensive hedge into a balanced position.
You still get downside protection, but without surrendering a large chunk of expected return.
Comparing Payoffs to Simple Stock Ownership
When you own stock outright, your exposure is linear.
If the stock rises, you gain point for point. If it falls, you lose point for point.
This is simple, but it also leaves you fully exposed to both big drawdowns and runaway upside.
The strategy we’re discussing reshapes that line into something more controlled.
We’re looking for something that takes into account that the big gains generally don’t happen, especially when stocks are trading at high levels and there’s not a lot of slack in the economy (i.e., near full employment, so less stimulation for risk assets).
Not that they can’t, just less likely.
Straight Stock Exposure
Think of a stock at 650. If it rises to 750, you’re up 100. If it falls to 550, you’re down 100.
There’s no limit in either direction.
For long-term investors, that unlimited upside is attractive, but the downside risk can be painful, especially in steep corrections.
Owning stock is essentially agreeing to the full rollercoaster.
The Modified Exposure
Now compare that with the combined position of stock, puts, and calls.
Between 650 and 800, your payoff looks similar to long stock, climbing steadily higher. But at 800, things change.
Instead of continuing up forever, your profits then decline because of the short call spread.
On the downside, below 640, the long put kicks in, softening losses.
Below 550, the losses continue.
The Key Difference
The result is a curve rather than a straight line. You still participate in gains up to a point, but you avoid the first ~15% of losses on the downside.
The trade sacrifices unlimited upside for cost efficiency and controlled risk.
Why This Matters
That balance (keeping most of the upside while protecting the downside) is what can make this structure attractive compared to simply holding the stock.
Let’s sum up what we just covered:
| Aspect | Straight Stock Ownership | Modified Exposure (Stock + Options) |
| Payoff Shape | Linear: gains/losses point for point | Curved: gains to a certain level, then capped; downside cushioned |
| Upside Potential | Unlimited, full participation in rallies | Strong up to +23% (in this example), then profits flatten/decline |
| Downside Risk | Unlimited losses | First ~15% drop cushioned, losses then continue but could flatten below with an extra sold OTM put |
| Typical Outcome | Big gains or steep corrections, full volatility | Moderate gains, limited drawdowns, smoother exposure |
| Economic Context | Works if large rallies are common | Suited for range-bound or modest upside markets |
| Trade-off | Unlimited upside, unlimited downside | Limited upside, cheaper protection, capped risk |
Ratio Spreads in Hedging
Ratio spreads are not talked about as much as other option strategies.
But they let traders shift risk and cost without paying large upfront premiums.
In this structure, both the call side and the put side use ratios to change the shape of exposure.
How a Ratio Spread Works
A ratio spread usually means buying one option and selling more than one against it.
For example, like in this example, you might buy one put and sell two lower-strike puts.
The sale of the extra option finances most, and sometimes all, of the cost of the long option.
This turns what would normally be a debit trade into a cheaper position. Or in certain cases, even a credit position.
The trade-off is that if the market moves too far, the extra short option can create new risks.
Shaping the Downside
In the trade we’re analyzing, the +1 put at 640 and -2 puts at 550 form a put ratio spread.
The long 640 put gives protection once the stock drops below that level, but the extra short puts offset the cost.
The result is a controlled loss region; you also don’t pay high premiums for pure insurance.
Shaping the Upside
On the upside, the -2 calls at 800 and +1 call at 950 form a call ratio spread.
Here, the financing effect is similar: selling the extra call helps reduce cost. But it also caps gains.
You profit if the stock rallies toward 800, yet if it keeps running, the second short call tilts the payoff back down.
But the trader in this circumstance is okay with that because it’s less likely to happen.
This balancing act, lower cost but reshaped risk, is the essence of ratio spreads in hedging.
How Time Decay Affects the Position
Options are wasting assets, and that decay works differently depending on where the underlying sits.
With this structure, for much of the payoff region, it works in your favor.
If the stock drifts sideways near current levels, the short options (the -2 calls at 800 and -2 puts at 550) lose value faster than the long ones.
That gradual erosion helps the position, since you sold more options than you bought. The decay of those shorts offsets the carrying cost of protection, letting you keep exposure at relatively low net cost.
The exception is if you “close the tails” by buying a call at 950 (to limit upside risk – i.e., price going too far) and buying a put at 450 to close the left-tail risk.
As expiry approaches, though, the trade sharpens.
The payoff “triangle” around 800 becomes more defined, and the risk zones become clearer.
One year in, you’ll see that the protection below 640 is intact, and the cap on gains above 800 is firm. By expiration, there’s no more smoothing from time value, only the raw payoff line remains.
In practice, this means the strategy benefits from time decay in stable markets but has to be managed carefully if the stock trends hard in either direction.
Volatility and Market Assumptions
Options don’t just respond to price, but also to volatility.
Changes in implied volatility (IV) can move this structure’s value even if the stock price goes nowhere. Understanding that effect is key.
On the downside, the long 640 put gains when volatility rises, since protective puts become more expensive in turbulent markets. That helps cushion the portfolio during corrections.
At the same time, the two short 550 puts also inflate in value when IV spikes, creating offsetting pressure.
Because the ratio spread is structured with more shorts than longs, extreme volatility can temporarily make the position look worse before the protective floor kicks in at expiry.
On the upside, the short 800 calls dominate. If volatility rises while the stock is near 800, those calls get pricier, which hurts.
But if volatility falls, holding price constant, the short calls cheapen, which works in your favor. The long 950 call, meanwhile, offers little help unless the stock runs much higher.
Overall, the trade assumes a moderate volatility environment: not too high, not too low.
A sudden spike in implied volatility can create mark-to-market pain, while a steady or declining IV backdrop makes the structure more forgiving and efficient.
When This Strategy Works Best
This structure is designed for markets where you expect moderate upside, not runaway rallies or deep crashes.
It thrives in conditions where the stock or index grinds higher but stays within a reasonable range.
The sweet spot is a move of about +15% to +25% from spot, taking the underlying from 650 toward the 800 level.
In that range, the position mirrors long stock exposure but with less risk of a sharp drawdown.
You collect most of the gains without paying much for downside insurance, because the short options help fund the trade. If the market stalls or drifts slightly lower, the protection from the 640 put helps keep losses in check.
Where it struggles is in the tails. If the market collapses beyond -20%, the position loses money.
More importantly, if the market surges far past 800 (say +40% or more), the short calls take over, and your payoff declines.
That’s why, as mentioned, this setup is best suited for environments where you see limited upside potential, perhaps after a strong rally, or when valuations already look stretched.
In short, this is a range-bound bullish strategy. It works best when you expect steady, contained gains rather than extreme outcomes.
You’re trading off unlimited upside for efficiency:
- controlled costs
- capped risk, and
- strong participation in the middle of the distribution
Alternatives and Variations
The beauty of option structures like this one is that they’re flexible.
Adjusting strikes, ratios, and/or calls/puts helps reshape the entire risk-reward profile.
Here are a few variations worth considering.
Shifting the Call Strikes
Instead of selling calls at 800, you might move them higher, say 850.
This gives you more upside before the payoff peaks, though you collect less premium.
Conversely, selling closer calls, like 780, increases premium income but caps profits earlier.
The spacing between the short and long calls is essentially a dial you can turn to adjust how much upside you want to keep.
Changing the Ratio
The standard version sells two options against one.
You could make it more conservative by selling just one, which lowers risk on extreme moves but costs more upfront.
Or, for a more aggressive stance, you might go 3-to-1 (i.e., what we’ve called an “option wall“), which reduces cost further but increases the chance of losses if the stock breaks out too far.
Altering the Put Spread
On the downside, the distance between the long 640 put and the short 550 puts defines your protection band.
Narrowing that gap creates tighter, cheaper protection, while widening it provides a broader safety net.
The exact strikes can be tailored depending on how much downside you’re willing to stomach.
Using Calls Only
Some traders skip the put side altogether and just run the stock plus call ratio spread.
This simplifies the structure but leaves you with raw downside exposure, so it’s only appropriate if you’re comfortable with deeper drawdowns.
Adding Time Stagger
Another twist is to use different expirations for the long and short legs.
This “calendarized” version changes how time decay and volatility affect the trade, potentially making it more resilient in choppier markets.
Each tweak shifts cost, risk, and payoff. The right version depends on your outlook and tolerance for extreme outcomes.
Related: Calendar Spread