Anatomy of a Bear Market


Falls in equity markets and the general anatomy of a bear market and their bottoms typically occur in a sequence.
3 Factors That Determine Equity Returns
There are three main factors in terms of decomposing equity returns:
- discounted earnings (cash flows)
- discounted interest rates, and
- risk premiums
Risk premiums are simply the type of compensation investors demand for holding a risky asset relative to something safer or less volatile, like cash or a government bond.
Lower discounted earnings, higher discounted interest rates, and higher risk premiums are all bad for risk assets like stocks, and vice versa.
Many think that stocks fall when things are “bad” but it’s first-level thinking because everything that’s known in already discounted into markets.
Accordingly, it’s about how things transpire relative to what’s already baked into their prices.
The Sequence of How Equity Markets Fall
The basic sequence in equity markets falling is:
- Interest rates go up faster than discounted, which drags down equity prices via the present value effect on future earnings.
- The higher interest rates and lower discounted economic growth pull money out of riskier assets, so equity prices fall further via a rise in risk premiums.
- The combination of rising discount rates, rising risk premiums, and declining asset prices leads to declining economic activity and earnings (corporate profits), which creates more downward pressure on equities.
How Equity Markets Bottom
The bottom occurs when there’s been enough of a fall in equities prices such that:
- the weakness in the economy is discounted and…
- risk premiums are high (i.e., the demanded yield on equities relative to safer assets like cash and bonds), which…
- sets up conditions for the trough once the central bank eases enough to…
- offset the combination of the falling discounted earnings and rising risk premiums.
When the central bank cuts interest rates, they are:
- cutting the return on cash (and usually bonds), which…
- incentivizes credit and money creation by lenders and banks of all forms, which…
- pushes more liquidity into risk assets, whose prices begin rising again.
Archetypical Progression of an Inflationary Bear Market
This chart below decomposes the archetypical progression of an inflationary bear market in terms of those three factors (discounted earnings (cash flows), discounted interest rates, and risk premiums).
An “inflationary bear market” simply means a fall in equity prices due to the central banks raising interest rates to fight inflation.
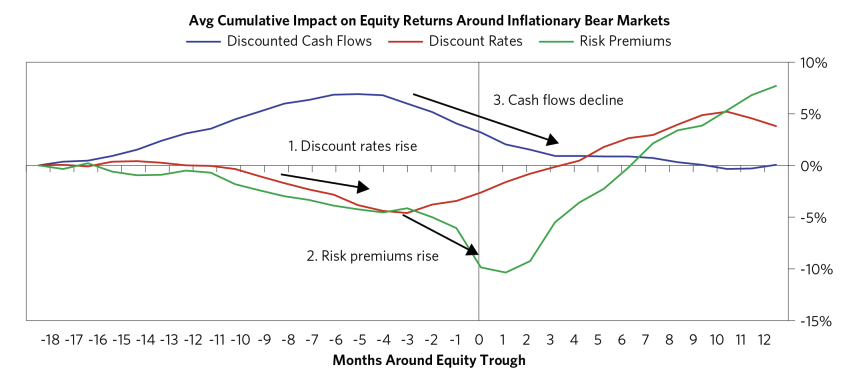
What this chart shows
What it basically shows is that:
- discounted earnings start falling 4-7 months before the bottom
- a discounted easing of interest rates occurs 3-5 months before the bottom
- risk premiums begin falling either at the bottom of the market or just after it
- discounted cash flows (discounted earnings) start rising 8-12 months after the bottom
Other implications:
- Markets don’t typically bottom simply when interest rates are priced to start easing. Even though this is a positive factor for equity prices, it’s being offset by the discounted fall in earnings plus the continued rise in risk premiums.
- Markets lead the real economy. The bottom in markets occurs before the bottom in the economy (commonly 8-12 months, but it depends). You see this when discounted earnings keep falling after the bottom in equity markets because this fall in earnings is offset by falling interest rates and a fall in risk premiums.
This means in order to get the bottom in equity markets you first generally need to see a meaningful increase in risk premiums (or an expected rise in equity returns in excess of cash, as it’s measured in this case).
Interest rates and risk premiums normally rise and fall together.
The biggest divergence seen between the two is in the lead-ups and months after the bottoms and tops of markets.
This type of dynamic of 1) falling interest rates and 2) rising risk premiums you see in the 0-3 months before the bottom in equity markets is because investors need to be coaxed back into equities and out of safe assets following a period of losses.
Bottoms in markets are often a result of extrapolation of the bad times continuing
In other words, investors inappropriately extrapolate the good times and the bad times more than what’s warranted.
For example, in this past cycle, many forms of real estate went to such high levels that they had about a 3 percent cap rate ($3 in net operating income for every $100 in valuation).
Because their prices had risen a lot they extrapolated those price increases into the future even though the opposite is more likely – i.e., because the earnings they throw off are low relative to the valuations and risks, and relative to the returns available in safer assets.
So if cap rates were to expand back out to, e.g., 6% in these properties, that means half of the equity was effectively lost holding net operating income constant.
In turn, because they were burned buying at such high prices, they will tend to demand more compensation relative to cash and safe assets compared to when they were willing to buy toward the top.
This requires the central bank to ease enough to offset the falling discounted earnings and rising risk premiums to get the bottoms in those markets.
Should individual investors sell (or short) when things are “bad”?
At the same time, it’s generally imprudent for non-professional traders/investors to try to be tactical about it because it’s probably going to go poorly based on how much you need to know and the processes you need to have in place in order to do that well.
In the quotes below is a citation from an article published in April 2020 about who Fidelity’s best-performing investors are/were (Fidelity is a retail brokerage).
Their best investors were the dead or inactive ones because they’re not in a position to do things that are usually counterproductive (e.g., get spooked out of markets when they fall, trying to time things, racking up transactions costs or taxable events, or other popular momentum-driven habits of individual investors that are typically value-destructive rather than value-additive):
“A news item that has gotten a lot of attention recently concerned an internal performance review of Fidelity accounts to determine which type of investors received the best returns between 2003 and 2013. The customer account audit revealed that the best investors were either dead or inactive—the people who switched jobs and “forgot” about an old 401(k) leaving the current options in place, or the people who died and the assets were frozen while the estate handled the assets.”
Growth and inflation on the values of equities
At the macro level, two forces have the biggest influence on asset pricing:
- economic growth
- inflation
Sometimes one or the other dominates.
Example: 2022-23 bear market
During this period, you see that “spot” inflation rates are falling and falling more than discounted, causing a rally in asset markets.
Central bankers, who have the biggest lever over the money and credit that influences asset prices and the economy, see this and say in their speeches that they’re likely to moderate the pace of how fast to bring up interest rates.
So basically what they’re doing is they’re extrapolating the fall the inflation from its peak, which causes markets to rally.
And the act of markets rallying supports growth (because the financial system is what provides the money and credit that feeds into the real economy), which in turn is likely to support higher inflation rates or preempt the expected decline in inflation.
So in cases like that, what that means is that their extrapolation of falling inflation is likely to be wrong, which means they have to go back in to provide another round of tightening, which will weaken asset prices.
And most importantly, that additional round of tightening isn’t priced into markets (markets priced interest rate cuts in the second half of 2023 through the end of 2024).
And with weaker asset prices, you get:
- weaker credit creation, which means…
- weaker spending growth, which feeds into…
- weaker income growth
- lower corporate margins
- lower corporate discretionary spending, then…
- hiring freezes, then…
- layoffs to finally cut labor growth and…
- wage growth will need to slow enough to engineer a lower core inflation rate
If labor growth is about zero and wage growth is 5-6%, that’s a 5-6% core inflation rate.
If you need 2%, that means you need some combination of a contraction in labor growth and lower wage growth in order to get that 2%, e.g., -2% labor growth and 4% wage growth or something like that.
If getting that 2% is too painful for the markets and real economy, then they could just accept a higher inflation rate, which means you could get higher asset prices in equilibrium.
That’s a possibility too.
How to defeat inflation to eventually get markets to bottom
As a policymaker you have to take away enough spending power (money, credit, and income) to get inflation back to where you want it.
That means you have to engineer enough of a weakening in asset prices to set into motion the things previously mentioned.
And if you measure the lag between changes in interest rates to the impact on the labor market (labor growth + wages) it’s about 18 months or so depending on the speed and magnitude of the policy response.
The decline in earnings required to get wage growth down and drive the unemployment rate up isn’t discounted in the equity markets either.
Then you also have other issues that are bad for the earnings picture, such as the redoing of supply chains to build more self-sufficiency (between the US and China and other countries), which is spending that doesn’t result in much new productivity growth.
Why bear markets are accompanied by higher volatility and big rallies
So these rallies and falls in asset markets are a result of policymakers’ “starts and stops” between:
a) “we see inflation falling a bit so we can start to take our foot off the brake” and
b) (in the future) “upon closer inspection we see that inflation isn’t falling as much as we thought so we need to step on the brake a bit more.”
Because they need those 18 months or so in terms of the lag between tightening monetary policy to when they see the wage growth come down to get the inflation rate down.
And if they don’t keep the economy weak enough for long enough they’re not likely to achieve that goal.
And so wage inflation and overall inflation becomes more entrenched because they’re not doing enough to shrink the dollars chasing labor relative to the quantity supplied by enough to get back to a 2% overall growth level.
By extension, it strings out the amount of time it’s going to take policymakers to achieve their policy objectives (2% inflation) such that they can pivot policy from tightening to neutral or easing relative to what’s discounted. That would in turn eventually get the bottom in the equity markets once risk premiums start to fall in conjunction and by enough to offset the fall in discounted growth.
It might take a while because they’re trying to straddle between two competing objectives – making sure growth is okay while trying to get inflation down – and not really achieving either.
Currency/FX impact during bear markets
Another important dynamic that can support asset markets is a fall in the local currency.
We saw this, for example, in 2022 in Japan when the yen fall a lot but supported the Japanese equity markets in local currency terms. The USD had a period like this in 2022 as well in November when had its worst month since 2010.
The act of the dollar or currency falling supports asset markets in local currency terms that doesn’t have anything to do with the fundamentals of the assets themselves.
The currency mechanics are tangential to just talking purely about the equity markets, but they matter in terms of the nominal price level.
However, in a country where there is still more tightening to go to bring down inflation and the growth picture is better in comparison to most other developed markets (currency pricing is measured relative to other currencies), then currency strength is likely not over – i.e., other countries are likely to see their currencies perform worse because they won’t be able to get their interest rates up much relative to local rates. This is bearish for asset prices.
Policymakers and 2% inflation
Two percent inflation is commonly targeted because that’s the level that most policymakers agree is tolerable without producing a negative effect on productivity.
For a US policymaker looking at the picture at the end of 2022, and being committed to getting core inflation back to 2%, you could be looking to bring asset prices down, on aggregate, another 25-30% to get to equilibrium levels given where real interest rates are and where earnings are likely to bottom out.
And how they tighten policy also matters.
There’s both short-term interest rate targeting and longer-term interest rate targeting, the latter of which is done by selling off assets from the Fed balance sheet in a process known as quantitative tightening, or QT.
If they do more short-term interest rate increases, then they need less QT, and vice versa.
Doing more QT is generally better for tightening financial conditions (e.g., getting equity prices down, credit spreads higher, stronger dollar) because of how much debt in the US is priced off of these longer term rates.
But it varies a lot by country. For instance, if you take the housing market as an example, the US housing market is driven heavily by longer-term interest rates because most mortgages are fixed-rate 30-years, whereas in the Canadian housing market they have shorter-term mortgages and UK (and other European) housing markets commonly have rate resets built into their mortgages every 2-5 years or so, so those markets are more heavily driven by short-term interest rates than they are in the US.
But back to the main point, if policymakers are okay with 3-4% inflation, then less of a decline in asset prices is necessary.
In turn, those best equipped to have success through this coming period are the ones that are:
- tactically short the equities and credits that have low earnings yields, unhealthy/leveraged balanced sheets, and cyclical demand for their products or services and
- long the risk assets with comparatively stable demand for what they sell, high earnings yields, and clean balance sheets.
They’ll also have inflation protection built into their portfolios in the event policymakers aren’t comfortable dealing that kind of a blow to financial markets, economic growth, and labor markets in order to get the inflation rate down.