Momentum Factor


The momentum factor is an isolated characteristic of assets that shows that, on average, winners keep winning.
The evidence for momentum is supported by decades of academic and practitioner research. Studies have shown momentum as a far explaining asset returns in the US as far back as the late 1800s and early 1900s.
The evidence has shown that momentum works across various asset classes, including foreign stocks, bonds, commodities, currencies, and index futures.
We’ll look at the momentum factor in this article.
Key Takeaways – Momentum Factor
- Momentum means the tendency in markets for winners to keep winning.
- Stocks with strong recent returns tend to outperform laggards.
- Proven across decades of data (since the late 1800s) and pervasive across multiple asset classes: stocks, bonds, commodities, currencies, index futures.
- Supported by research from Jegadeesh & Titman (1993) and later global studies confirming consistent excess returns.
- Typically measured using past 12-month performance, excluding the most recent month to avoid short-term noise.
- Momentum portfolios go long recent winners and short recent losers, isolating the trend premium and nullifying beta (i.e., market-neutral).
- Momentum, like other isolated factors with decades of history, work due to behavioral biases (underreaction, herding, the way they can underperform for years) and risk-based compensation for crash/unwind risk.
- It’s a complement to value and quality factors in diversified, multi-factor portfolios.
- Often used as overlays in portfolios.
- We provide an example allocation.
Defining Momentum Indices
The investment firm AQR has developed methodologies for US and international markets that capture the momentum factor according to defined rules:
- The investment universe is screened based on market capitalization, liquidity, and other considerations.
- The stocks in the investment universe are ranked by their total return over the prior twelve months, excluding the last month.
- The top 33% of stocks with the highest rank are included, and weighted based on their market capitalization.
- The index is reconstituted quarterly.
Of course, there are other constructions that are possible, but that captures the essence.
Why Momentum Works
Behavioral Explanations (Psychology and Biases)
Momentum exists largely because investors don’t react to information instantly or rationally.
When good news arrives, markets tend to underreact. Traders/investors update their expectations slowly, causing prices to drift upward over time.
The same happens in reverse with bad news, as investors often anchor to outdated information or hope for a turnaround.
In a separate article, we explored this further.
Part of it has to do with the dual systematic/instantaneous and discretionary/slower analysis aspect of who participates in markets.
Algorithms are very good at integrating information faster and less emotionally than humans. But they can’t capture everything, as they only capture what they’re programmed to capture.
This is when human analysis comes in and has influence on prices.
Other biases compound this effect.
Herding behavior causes traders to chase recent winners, reinforcing trends.
Stocks are supposed to be the present value of future cash flows, but that’s theoretical. Marketing is a big component and a rising stock creates more attention.
Confirmation bias also makes them interpret new data in ways that justify what they already think.
These psychological quirks cause stock prices to move gradually rather than adjusting all at once, allowing trends to persist far longer than they should in an efficient market.
Risk-Based Explanations
An alternative view/reason is that momentum rewards investors for taking on unique forms of risk.
If there is perpetual risk compensation, then that means factors aren’t simply arbed away.
Momentum portfolios often tactically tilt/load on stocks that are high-beta, cyclical, or sensitive to liquidity conditions.
When markets fall, these same stocks can reverse sharply – often more than a standard index – which creates the “momentum crash” phenomenon.
In this sense, the momentum premium compensates investors for bearing higher crash risk, much like the equity risk premium compensates for the extra volatility and less certain cash flows relative to bonds.
Evidence from Decades of Research
Momentum is one of the most persistent and well-documented market anomalies.
First formally identified by Jegadeesh and Titman (1993), it has since been confirmed across nearly every major asset class: stocks, bonds, commodities, and currencies.
Studies show that stocks in the top decile of past 6-12 month performance tend to outperform laggards by roughly 6-12% annually, even after accounting for transaction costs.
The factor’s resilience across time periods, geographies, and asset classes suggests it’s not a statistical fluke.
Instead, momentum likely reflects a blend of behavioral biases and rational risk-taking, an enduring, exploitable pattern in how investors collectively process information.
How Momentum Is Measured and Implemented
Measuring Past Returns (Typical 12-Month Lookback)
Momentum is viewed a bit differently than how short-term traders look at it.
It’s typically measured using a stock’s past 12-month return.
The most recent month is excluded to avoid short-term reversals that can distort signals.
Stocks are ranked by their trailing performance, with recent winners (top decile) and losers (bottom decile) forming the basis for momentum portfolios.
This method helps to get at the persistent behavioral and informational trends that drive momentum’s returns across markets.
Building a Long–Short Momentum Portfolio
A long-short momentum strategy isolates the factor’s return stream by taking opposing positions in top- and bottom-performing stocks.
The trader goes long high-momentum stocks and short low-momentum ones.
They might weight equally or by relative strength or volatility.
This approach neutralizes broad market risk (beta) and focuses on the relative return spread between winners and losers.
For example, within a large-cap universe, one might buy the top 10% of performers and short the bottom 10%, and rebalance monthly or quarterly.
Long-short portfolios can deliver strong risk-adjusted returns, though they’re prone to sharp reversals when trends suddenly shift, such as after major market inflection points.
Long-Only Momentum Tilts for Everyday Investors
For most, a long-only momentum tilt is a more accessible and lower-risk way to harness the factor – though it limits the diversificaiton potential (since you have the beta component).
Rather than shorting, the portfolio simply overweights high-momentum stocks while underweighting laggards within a diversified equity mix.
This can be done using momentum ETFs (like iShares MTUM or Invesco MOM) or through systematic screening for strong recent performers.
While long-only approaches don’t give the same diversification value as long-short versions because there’s so much market beta, they can still get you some of the same behavioral edge driving the momentum premium.
Momentum in Practice
Real-World Performance and Volatility
Momentum has delivered strong long-term returns across markets, often outperforming other equity factors.
But it nonetheless comes with higher volatility and occasional sharp drawdowns.
Momentum does best in trending markets but can struggle when leadership changes abruptly, as trends reverse and past winners lose favor.
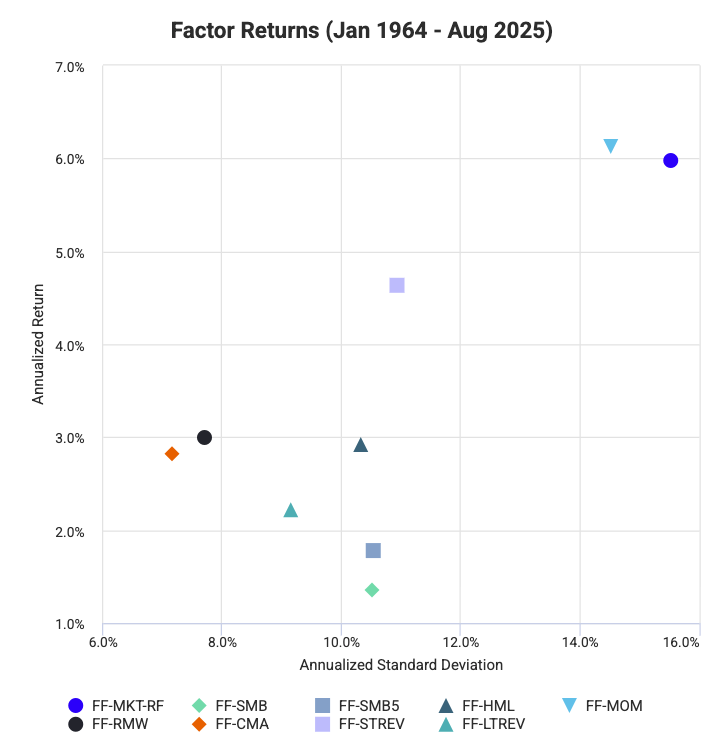
In our article on factor statistics, we found that momentum delivers excess returns of 6.1% at 14.5% volatility for Fama-French, though it depends on the exact construction.
Factor Correlations: United States
| Factor | Key | Rm-Rf | SMB | SMB5 | HML | MOM | RMW | CMA | STREV | LTREV | Annualized Return | Annualized Standard Deviation |
|---|---|---|---|---|---|---|---|---|---|---|---|---|
| Market | FF-MKT-RF | 1.00 | 0.30 | 0.28 | -0.21 | -0.18 | -0.19 | -0.35 | 0.30 | -0.01 | 5.98% | 15.53% |
| Size (FF3) | FF-SMB | 0.30 | 1.00 | 0.98 | -0.14 | -0.05 | -0.41 | -0.17 | 0.17 | 0.25 | 1.35% | 10.53% |
| Size (FF5) | FF-SMB5 | 0.28 | 0.98 | 1.00 | 0.01 | -0.08 | -0.35 | -0.09 | 0.17 | 0.32 | 1.78% | 10.54% |
| Value | FF-HML | -0.21 | -0.14 | 0.01 | 1.00 | -0.19 | 0.09 | 0.68 | 0.02 | 0.52 | 2.92% | 10.33% |
| Momentum | FF-MOM | -0.18 | -0.05 | -0.08 | -0.19 | 1.00 | 0.08 | -0.01 | -0.31 | -0.09 | 6.13% | 14.53% |
| Profitability | FF-RMW | -0.19 | -0.41 | -0.35 | 0.09 | 0.08 | 1.00 | -0.00 | -0.08 | -0.26 | 3.00% | 7.70% |
| Investment | FF-CMA | -0.35 | -0.17 | -0.09 | 0.68 | -0.01 | -0.00 | 1.00 | -0.14 | 0.51 | 2.82% | 7.15% |
| Short Term Reversal | FF-STREV | 0.30 | 0.17 | 0.17 | 0.02 | -0.31 | -0.08 | -0.14 | 1.00 | 0.10 | 4.63% | 10.93% |
| Long Term Reversal | FF-LTREV | -0.01 | 0.25 | 0.32 | 0.52 | -0.09 | -0.26 | 0.51 | 0.10 | 1.00 | 2.22% | 9.16% |
It has similar risk-reward properties as the market factor (i.e., simply buying a stock index):
In international markets, it’s been more pronounced:
Factor Correlations: International Markets ex US
| Factor | Key | Rm-Rf | SMB | SMB5 | HML | MOM | RMW | CMA | Annualized Return | Annualized Standard Deviation |
|---|---|---|---|---|---|---|---|---|---|---|
| Market | FF-MKT-RF | 1.00 | -0.16 | -0.19 | -0.06 | -0.30 | -0.26 | -0.30 | 3.65% | 15.96% |
| Size (FF3) | FF-SMB | -0.16 | 1.00 | 0.99 | -0.09 | 0.13 | -0.02 | -0.07 | -0.44% | 6.68% |
| Size (FF5) | FF-SMB5 | -0.19 | 0.99 | 1.00 | 0.03 | 0.11 | -0.04 | 0.02 | 0.48% | 6.60% |
| Value | FF-HML | -0.06 | -0.09 | 0.03 | 1.00 | -0.27 | -0.42 | 0.64 | 4.53% | 8.09% |
| Momentum | FF-MOM | -0.30 | 0.13 | 0.11 | -0.27 | 1.00 | 0.35 | -0.05 | 7.36% | 11.70% |
| Profitability | FF-RMW | -0.26 | -0.02 | -0.04 | -0.42 | 0.35 | 1.00 | -0.34 | 3.37% | 4.75% |
| Investment | FF-CMA | -0.30 | -0.07 | 0.02 | 0.64 | -0.05 | -0.34 | 1.00 | 1.68% | 6.09% |
| Factor correlations and returns statistics from November 1990 to August 2025 | ||||||||||
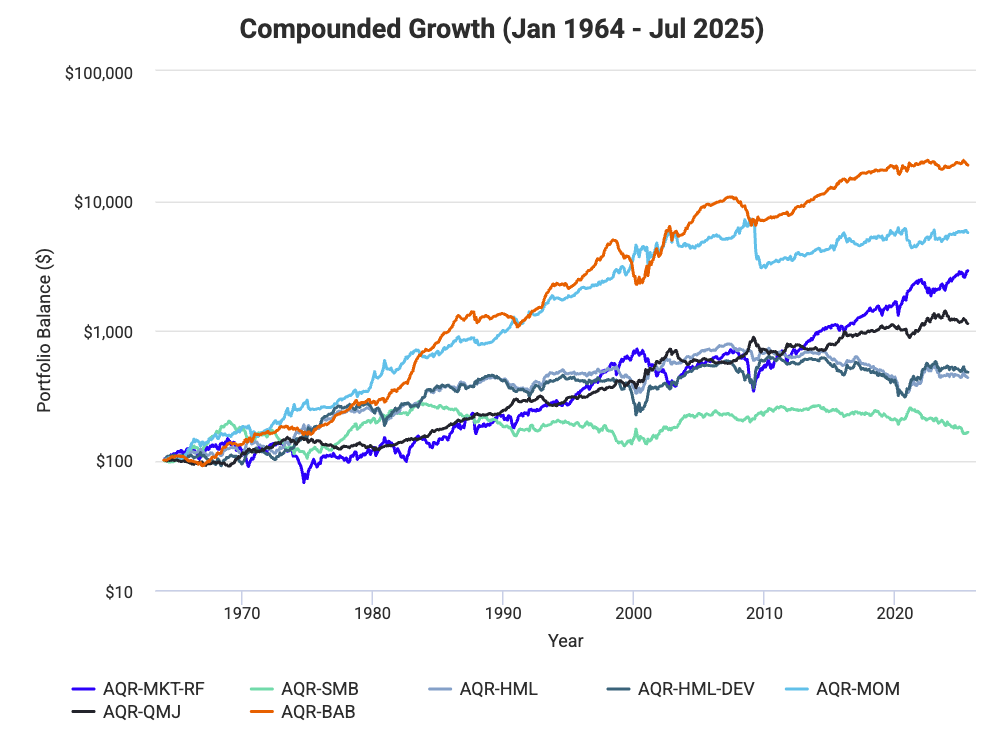
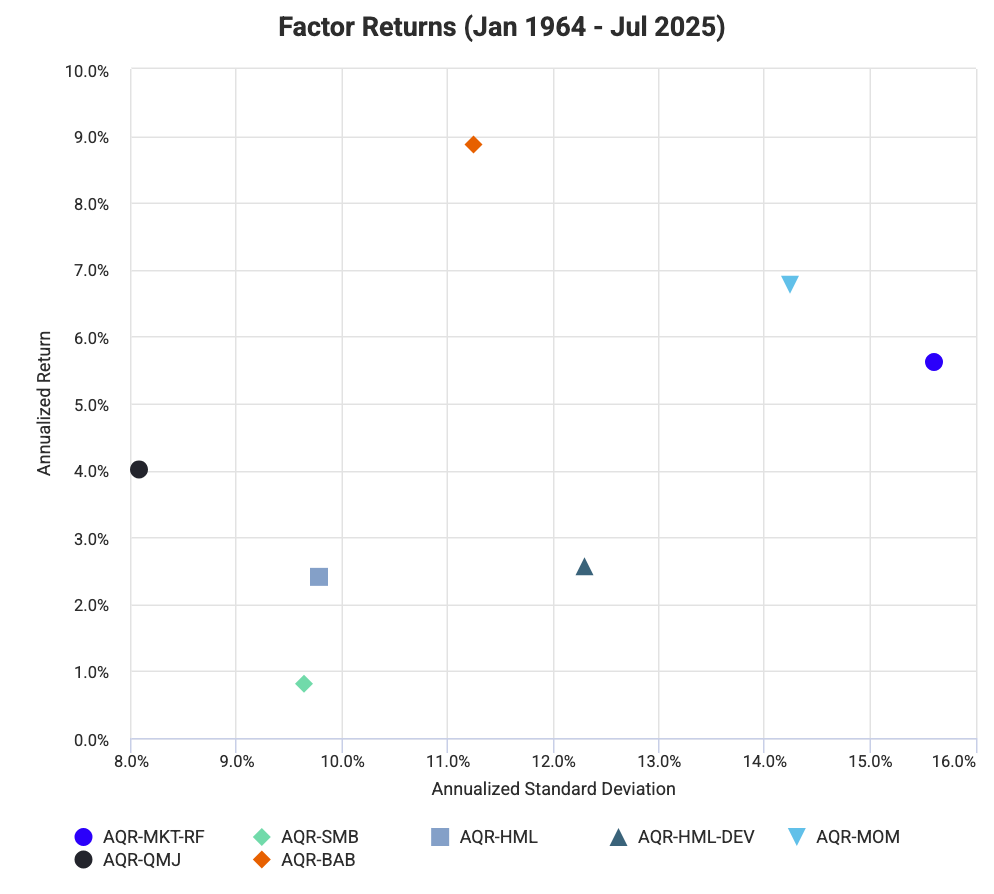
In AQR’s construction, we see something similar to Fama-French in US markets:
Factor Correlations: United States
| Factor | Key | Rm-Rf | SMB | HML | HML-DEV | MOM | QMJ | BAB | Annualized Return | Annualized Standard Deviation |
|---|---|---|---|---|---|---|---|---|---|---|
| Market | AQR-MKT-RF | 1.00 | 0.31 | -0.23 | -0.06 | -0.19 | -0.53 | -0.09 | 5.62% | 15.61% |
| Size | AQR-SMB | 0.31 | 1.00 | -0.08 | 0.02 | -0.14 | -0.52 | -0.04 | 0.81% | 9.64% |
| Value | AQR-HML | -0.23 | -0.08 | 1.00 | 0.79 | -0.14 | -0.06 | 0.35 | 2.41% | 9.79% |
| Value | AQR-HML-DEV | -0.06 | 0.02 | 0.79 | 1.00 | -0.64 | -0.23 | 0.11 | 2.57% | 12.29% |
| Momentum | AQR-MOM | -0.19 | -0.14 | -0.14 | -0.64 | 1.00 | 0.31 | 0.21 | 6.77% | 14.24% |
| Quality | AQR-QMJ | -0.53 | -0.52 | -0.06 | -0.23 | 0.31 | 1.00 | 0.20 | 4.01% | 8.08% |
| Bet Against Beta | AQR-BAB | -0.09 | -0.04 | 0.35 | 0.11 | 0.21 | 0.20 | 1.00 | 8.87% | 11.24% |
| Factor correlations and returns statistics from January 1964 to July 2025 | ||||||||||
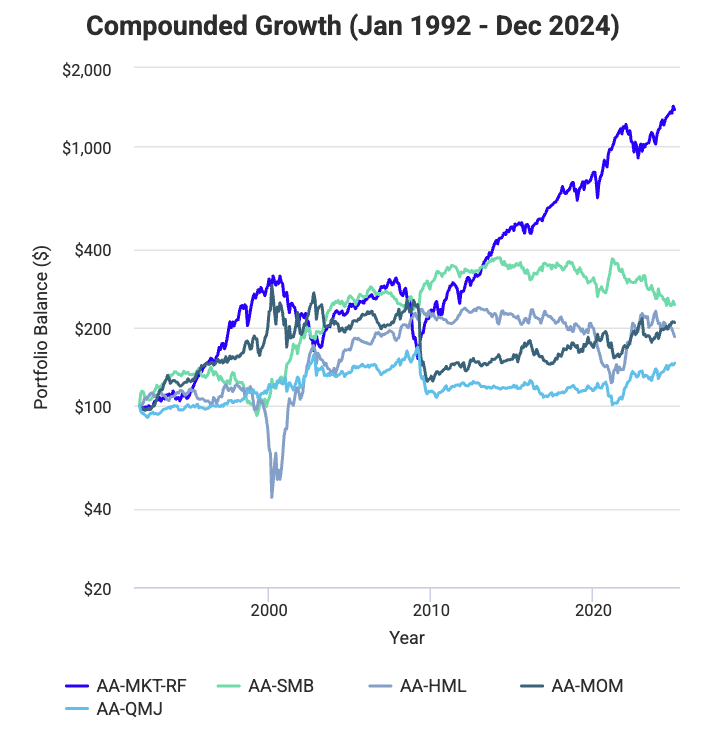
Based on the Alpha Architect construction, which runs from the early 1990s, the momentum factor has been less influential:
Factor Correlations: United States
| Factor | Key | Rm-Rf | SMB | HML | MOM | QMJ | Annualized Return | Annualized Standard Deviation |
|---|---|---|---|---|---|---|---|---|
| Market | AA-MKT-RF | 1.00 | 0.27 | -0.32 | -0.25 | -0.34 | 8.28% | 15.03% |
| Size | AA-SMB | 0.27 | 1.00 | -0.27 | -0.19 | -0.40 | 2.75% | 11.15% |
| Value | AA-HML | -0.32 | -0.27 | 1.00 | -0.30 | 0.12 | 1.87% | 15.52% |
| Momentum | AA-MOM | -0.25 | -0.19 | -0.30 | 1.00 | 0.73 | 2.26% | 15.46% |
| Quality | AA-QMJ | -0.34 | -0.40 | 0.12 | 0.73 | 1.00 | 1.15% | 8.87% |
| Factor correlations and returns statistics from January 1992 to December 2024 | ||||||||
Factor Correlations: International Markets ex US
| Factor | Key | Rm-Rf | SMB | HML | MOM | QMJ | Annualized Return | Annualized Standard Deviation |
|---|---|---|---|---|---|---|---|---|
| Market | AA-MKT-RF | 1.00 | -0.04 | -0.24 | -0.27 | -0.42 | 3.24% | 16.55% |
| Size | AA-SMB | -0.04 | 1.00 | 0.01 | -0.21 | -0.16 | 0.15% | 6.21% |
| Value | AA-HML | -0.24 | 0.01 | 1.00 | -0.28 | -0.07 | 4.14% | 7.85% |
| Momentum | AA-MOM | -0.27 | -0.21 | -0.28 | 1.00 | 0.71 | 3.71% | 14.12% |
| Quality | AA-QMJ | -0.42 | -0.16 | -0.07 | 0.71 | 1.00 | 2.59% | 7.66% |
| Factor correlations and returns statistics from January 1992 to December 2024 | ||||||||
When Momentum Breaks Down (Reversals and Crowding)
Momentum can falter during sudden market reversals or crowded trades, when too many traders are chasing the same trends.
These periods often trigger rapid unwinds (e.g., 2008 GFC).
So it’s best that momentum isn’t the entire portfolio and to rebalance when necessary.
Momentum and Other Factors
How It Interacts with Value and Quality
Factor investing expert Cliff Asness has stated, “Value and momentum, to me, are the two most interesting anomalies… The key is that they are very different from each other.”
Momentum often behaves as the mirror image of value.
While value looks for cheap, out-of-favor stocks, momentum favors recent winners, often growth-oriented or highly valued firms.
This negative correlation (typically) makes them diversifying complements: when value underperforms, momentum usually excels, and vice versa.
Quality factors, like profitability and balance sheet strength, tend to overlap partially with momentum since profitable, efficient firms often sustain positive trends longer.
You can see it in some of the positive correlations above.
However, quality can also temper some of momentum’s volatility, and provide stability when high-flyers lose steam.
The combination of value, quality, and momentum captures multiple sides of market behavior (mean reversion, trend persistence, and fundamental strength), and help to create a balanced portfolio foundation.
Why Momentum Complements Defensive Factors
Momentum pairs well with defensive factors such as low volatility, quality, and profitability.
Their low correlations when constructed as long-short baskets can improve diversification and risk-adjusted returns.
For instance, a portfolio blending momentum and low volatility can ride market strength but also softening drawdowns.
Overall, institutional multi-factor models often rely on momentum as a return engine in the context of a long/short equity portfolio and defensive factors as the stabilizing core.
The Human Side of Momentum
Why Traders Chase Trends
Momentum persists largely because of how humans process risk and reward.
Investors and traders tend to chase performance and tend to bandwagon onto what’s worked.
They extrapolate recent success into the future. If something goes up, it must mean it’s good (not literally, but in terms of the bias).
When prices rise, confidence builds, fueling further buying, creating a feedback loop that sustains upward trends.
Similarly, in falling markets, fear and loss aversion drive selling, deepening declines.
These behaviors stem from cognitive biases like overconfidence, anchoring, and recency bias, which cause investors to overweight recent data and underreact to new information.
Momentum, therefore, isn’t just a mechanical effect.
It’s a byproduct of human emotion and the tendency to follow what has recently worked, even when valuations no longer justify it.
The Role of Herding and Slow Information Diffusion
Another key driver of momentum is herding, where traders collectively move in the same direction, reinforcing price trends.
Institutional investors, benchmark-driven managers, and algorithmic funds often pile into the same trades, which can amplify existing moves.
Also, information diffusion, the gradual spread of fundamental news, means markets don’t instantly reflect all relevant data. As covered, markets can overreact but also underreact.
It takes time for earnings surprises, innovations, or macro shifts to be fully priced in.
This slow adjustment process allows momentum strategies to profit from the lag between new information and what eventually needs to be priced in – essentially exploiting inefficiencies born from human and institutional behavior.
Using Momentum in a Diversified Portfolio
Strategic Role in Multi-Factor Investing
Momentum has an offensive role within a diversified, multi-factor portfolio.
It complements defensive styles like value, quality, and low volatility, offering something during strong returns during rising markets.
Because momentum’s correlation with most other factors is low or negative, it improves diversification and can improve overall risk-adjusted performance.
Most institutional investors combine momentum with value and quality exposures. This balances trend-following strength with fundamental stability for long-term excess returns.
Overlays
Many factor sleeves are used as overlays on top of standard market exposure.
Because factors are long/short constructions traditionally, the beta nets out and many are uncorrelated, which means as overlays they can be return-enhancing and risk-reducing.
Overlays are often referred to as “return stacking.”
Example of Momentum Factor in a Portfolio
Here, the objective is to improve returns and reduce drawdowns by combining low-correlated factor premia on top of core market exposure — essentially, a return stacking approach.
Base Portfolio:
- 100% Market Factor Exposure – broad equity index (e.g., S&P 500 or MSCI World; SPY, VOO, or VT type funds)
Overlays (stacked on top of the market):
- +30% Momentum Factor (long-short) – the return spread between recent winners and losers
- +30% Value Factor (long-short) – adds exposure to cheap vs. expensive stocks
- +15% Quality Factor (long-short) – favors profitable, stable, low-debt firms
- +15% Low Volatility / Bet Against Beta (long-short) – tilts toward defensive, low-beta names
- +10% Multi-Asset Trend Following – diversifies across bonds, commodities, and FX
Total Gross Exposure: ~200%
- Net beta ≈ 1.0 (market-neutral overlays offset each other)