Size Factor


Why have small-cap stocks historically outperformed large caps? And does this still hold true today?
That’s the basis of the size factor, nested in the broader area of finance known as factor investing.
Factor investing fundamentally is about isolating specific characteristics of assets – e.g., size, value, quality, low volatility – to harvest either:
- outperformance relative to a standard benchmark
- a preferred source of return
Moreover, factors tend to exist because of two main factors:
- risk compensation
- behavioral and psychological biases (e.g., they can be hard to stick with over long time horizons)
The size factor is one of the classic Fama-French factors.
We’ll look at the historical and theoretical roots of the size factor and do some backtests to look at its relative performance over a multi-decade horizon.
Key Takeaways – Size Factor
- The Size Factor originates from evidence that small-cap stocks often outperform large-cap stocks over time.
- It reflects both risk compensation-based and behavioral explanations.
- Example include higher volatility, credit risk, investor neglect, and limited liquidity.
- The Fama-French Three-Factor Model formalized size as a distinct driver of returns, measured through the SMB (Small Minus Big) portfolio.
- The size premium has weakened in recent decades, partly due to better market efficiency and factor crowding (i.e., factors becoming more widely known).
- Quality, value, and profitability filters improve results by separating strong small firms from weak ones.
- The factor performs best during economic recoveries when risk appetite and liquidity rise.
- Smart traders/investors use size as part of a diversified multi-factor strategy, not as a standalone bet.
- The size effect is still relevant, but its edge depends on thoughtful portfolio design.
- We do some backtests below.
Historical Background
The Spark: Rolf Banz’s 1981 Discovery
In 1981, finance researcher Rolf Banz uncovered something that would disrupt modern portfolio theory.
Analyzing decades of NYSE data, he noticed that small-cap stocks consistently outperformed large-cap stocks, even when risk adjustments were applied.
This wasn’t supposed to happen under the Capital Asset Pricing Model, which claimed that expected returns were solely tied to market risk, measured by beta.
Yet, Banz’s data told a different story.
The “small-firm effect” suggested there was another hidden dimension to equity returns, one that size itself seemed to capture.
For many, it was a wake-up call that markets might not be as perfectly efficient as commonly thought.
Early Ripples Across Academia
The discovery triggered academic curiosity.
Economists began examining whether this anomaly was a quirk of US markets or something universal.
Studies in Canada, Japan, and Europe soon found similar results: smaller companies, on average, produced higher returns over long periods.
These findings hinted that the size premium wasn’t an isolated fluke but a global pattern in equity behavior.
It forced researchers to rethink how risk was defined and measured.
Fama and French Bring Order to Chaos
In 1993, Eugene Fama and Kenneth French provided a structured explanation.
They introduced the Three-Factor Model, which expanded on CAPM by adding two new factors: Size (SMB: Small Minus Big) and Value (HML: High Minus Low).
The size factor quantified the return difference between small and large firms, which effectively institutionalized the small-cap premium into financial modeling.
This model became a cornerstone of modern quantitative investing and academic finance, giving investors a framework to measure the systematic sources of return beyond market exposure.
Debate and Enduring Significance
Despite decades of research, scholars still argue about why the size effect exists.
Some believe it’s compensation for higher risks. Others see it as a product of market inefficiency, illiquidity, or investor neglect.
On this last point, it’s well-known that sell-side research covers larger public companies more than smaller ones.
Institutional capital also often can’t enter small caps for liquidity reasons (they’re too small to make the trade worth it).
Whatever the reason, the size factor reshaped both theory and practice, and has influenced small-cap investment strategies.
Theoretical Rationale
Risk-Based Explanations
The simplest explanation for the size effect is also the most intuitive: small companies are riskier.
They have less access to credit, narrower product lines, and smaller cash reserves.
They also tend to be more domestic and have less international diversification.
During recessions or financial stress, these firms face greater threats of bankruptcy or severe revenue drops.
So allocators, recognizing this added vulnerability, demand higher long-term returns as compensation.
Historically, small-cap performance has been more volatile, with sharper drawdowns during market downturns and stronger rebounds during recoveries.
This cyclical behavior supports the idea that the size premium is a risk premium paid to those willing to endure more short-term pain for long-term reward.
Sensitivity to the Business Cycle
The performance of small companies tends to mirror the health of the broader economy.
During expansions, they often outperform as credit conditions improve and risk appetite grows.
When liquidity dries up, they suffer disproportionately. This connection to economic cycles is one reason why the size factor may persist.
It captures an element of macroeconomic risk that larger firms are better able to withstand.
Behavioral and Market-Structure Explanations
Beyond risk, psychology and market structure also are important.
Smaller firms don’t receive as much analyst coverage and less attention from institutional investors.
There is a bit of marketing involved with stock prices. If fewer people know, it limits demand.
For example, the S&P 500 is the world’s most popular stock index that’s owned by pensions, sovereign wealth funds, and a host of institutional capital.
Other indexes/funds/ETFs are built off of it, which inspires massive derivatives markets, etc.
S&P inclusion is a huge boost to the demand for the stock, but even the smallest S&P 500 companies are huge (tens of billions in market cap).
For smaller firms, this neglect can lead to persistent mispricings, and undervalued companies can stay under the radar until rediscovered.
Behavioral biases also amplify these effects. Investors often overreact to bad news or avoid illiquid stocks altogether.
In turn, this can leave opportunities for patient capital.
Liquidity as a Hidden Driver
Liquidity risk may be the bridge between both theories.
Small stocks are harder to trade, and during market stress, transaction costs spike.
The market rewards those willing to provide liquidity when others retreat, reinforcing why size remains one of the most studied and debated factors in finance.
Measuring the Size Factor
Market Capitalization: The Core Metric
Market capitalization is the total value of a company’s outstanding shares.
It reflects not only a firm’s scale but also how the market perceives its overall stability and growth potential.
In factor investing, stocks are grouped into portfolios based on their market cap, typically dividing the universe into “small” and “big” categories.
A small cap stock, for example, is typically between $300 million and $2 billion in market cap.
This classification helps quantify how much of a portfolio’s return comes from exposure to smaller versus larger firms.
The SMB Portfolio
To isolate the size effect, Fama and French introduced the SMB (Small Minus Big) portfolio.
SMB measures the performance difference between small-cap and large-cap stocks.
Each month, portfolios are rebalanced to maintain consistent exposure.
The SMB value rises when small stocks outperform and falls when large stocks lead.
This simple spread captures the economic force behind the size factor and allows researchers to track its behavior over time.
Breakpoints and Sorting Methods
In academic models, breakpoints are usually defined by the median NYSE market capitalization. This prevents extreme outliers from dominating results.
Some studies refine this approach by adjusting for regional differences or sector weights, so that comparisons remain meaningful across time and markets.
Correlations and Cross-Factor Interactions
The size factor – and good outcomes associated with it – often correlates with value, profitability, and investment factors.
Understanding these correlations helps traders/investors identify whether they’re really capturing size exposure (or reported outperformance is due to the size factor itself) or unintentionally mixing multiple factor bets.
Empirical Performance
Long-Term Historical Returns
Over the long run, small-cap stocks have outperformed large caps by roughly 2 to 3 percent annually, according to data spanning nearly a century.
This performance edge has appeared in US, European, and emerging markets.
Recent Decades and Shifting Trends
Since the early 2000s, however, the size premium has weakened or appeared inconsistently.
The S&P 500 has actually outperformed smaller stocks.
Improved market efficiency, lower trading costs, and broader institutional access have likely narrowed the gap.
Even so, periods of strong small-cap outperformance still occur, particularly during early expansion phases or during periods of strength for the domestic currency.
Backtests
Let’s run some backtests.
Example #1: Large Caps vs. Mid Caps vs. Small Caps
US Large Cap
| Asset Class | Allocation |
|---|---|
| US Large Cap | 100.00% |
US Mid Cap
| Asset Class | Allocation |
|---|---|
| US Mid Cap | 100.00% |
US Small Cap
| Asset Class | Allocation |
|---|---|
| US Small Cap | 100.00% |
Performance Summary (1972 to Present)
| Metric | US Large Cap | US Mid Cap | US Small Cap |
|---|---|---|---|
| Start Balance | $10,000 | $10,000 | $10,000 |
| End Balance | $2,582,005 | $4,070,695 | $3,377,384 |
| Annualized Return (CAGR) | 10.89% | 11.83% | 11.44% |
| Standard Deviation | 15.31% | 17.36% | 19.62% |
| Best Year | 37.45% | 48.69% | 55.13% |
| Worst Year | -37.02% | -41.82% | -36.07% |
| Maximum Drawdown | -50.97% | -54.14% | -53.95% |
| Sharpe Ratio | 0.46 | 0.48 | 0.43 |
| Sortino Ratio | 0.68 | 0.70 | 0.62 |
Here, we see that mid caps returns almost a full percentage point higher (annualized) than large caps, but small caps underperformed mid caps by 40bps annualized.
We also see the volatility naturally go up as the size decreases.
So, the evidence over more than 50 years is that small caps have given greater return, but not by much and necessarily after adjusting for risk (see the Sharpe and Sortino ratios).
Example #2: Mid Caps vs. Micro Caps
What happens if we add micro caps?
Since mid caps had the highest return of the previous example, let’s compare them to micro caps.
US Mid Cap
| Asset Class | Allocation |
| US Mid Cap | 100.00% |
US Micro Cap
| Asset Class | Allocation |
| US Micro Cap | 100.00% |
Performance Summary (1972 to Present)
| Metric | US Mid Cap | US Micro Cap |
| Start Balance | $10,000 | $10,000 |
| End Balance | $4,070,695 | $4,714,168 |
| Annualized Return (CAGR) | 11.83% | 12.13% |
| Standard Deviation | 17.36% | 21.07% |
| Best Year | 48.69% | 80.98% |
| Worst Year | -41.82% | -39.86% |
| Maximum Drawdown | -54.14% | -61.91% |
| Sharpe Ratio | 0.48 | 0.44 |
| Sortino Ratio | 0.70 | 0.66 |
Micro caps won here on total return by 30bps, 12.13% vs. 11.83% annually.
However, the risk-adjusted metrics were worse, with a larger maximum drawdown.
Example #3
What happens if we mix size with value?
Generally value is a more reliable contributor to performance over time than size.
By adding value to each size, we might also better isolate the size factor.
US Large Cap Value
| Asset Class | Allocation |
| US Large Cap Value | 100.00% |
US Mid Cap Value
| Asset Class | Allocation |
| US Mid Cap Value | 100.00% |
US Small Cap Value
| Asset Class | Allocation |
| US Small Cap Value | 100.00% |
Performance Summary
| Metric | US Large Cap Value | US Mid Cap Value | US Small Cap Value |
| Start Balance | $10,000 | $10,000 | $10,000 |
| End Balance | $3,090,531 | $5,811,691 | $8,862,393 |
| Annualized Return (CAGR) | 11.26% | 12.57% | 13.46% |
| Standard Deviation | 14.92% | 16.76% | 18.39% |
| Best Year | 40.67% | 56.79% | 54.78% |
| Worst Year | -35.97% | -36.64% | -32.05% |
| Maximum Drawdown | -54.85% | -56.51% | -56.13% |
| Sharpe Ratio | 0.49 | 0.53 | 0.54 |
| Sortino Ratio | 0.73 | 0.78 | 0.80 |
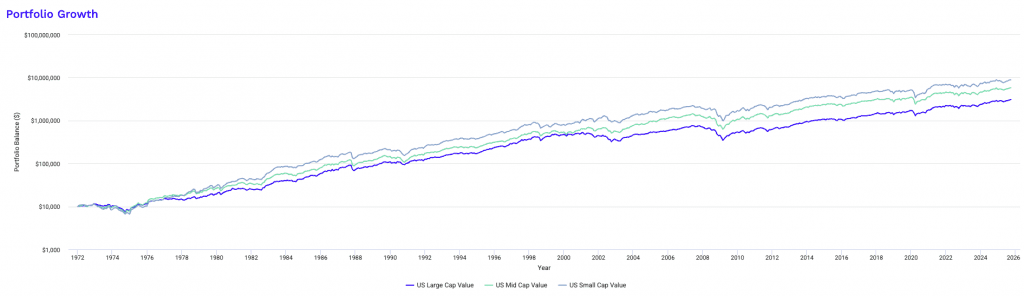
Here the effect was more influential.
Mid cap value outperformed large cap value, and small cap value outperformed mid cap value.
Example #3: Part B – Has This Held Up This Century?
Size has struggled more this century, as it’s reported in the financial literature.
So, let’s go from 2000 to the present, starting right before the dot-com crash (it’s helpful to include crashes in backtest data as a stress test).
Performance Summary
| Metric | US Large Cap Value | US Mid Cap Value | US Small Cap Value |
| Start Balance | $10,000 | $10,000 | $10,000 |
| End Balance | $64,553 | $107,288 | $108,640 |
| Annualized Return (CAGR) | 7.51% | 9.65% | 9.71% |
| Standard Deviation | 15.25% | 17.22% | 19.34% |
| Best Year | 32.87% | 37.94% | 37.19% |
| Worst Year | -35.97% | -36.64% | -32.05% |
| Maximum Drawdown | -54.85% | -56.51% | -56.13% |
| Sharpe Ratio | 0.43 | 0.51 | 0.48 |
| Sortino Ratio | 0.62 | 0.74 | 0.70 |
The answer is yes, but only slightly has size has held up well this century, with small cap value producing flat results over mid cap value and 220bps over large cap value (annualized).
Mid cap value performs the best on a risk-adjusted basis.
Example #3: Part C – Has This Held Up Since the 2008 Crash?
How about since the start of 2009?
Performance Summary
| Metric | US Large Cap Value | US Mid Cap Value | US Small Cap Value |
| Start Balance | $10,000 | $10,000 | $10,000 |
| End Balance | $68,286 | $73,967 | $67,500 |
| Annualized Return (CAGR) | 12.15% | 12.69% | 12.08% |
| Standard Deviation | 15.03% | 17.20% | 19.82% |
| Best Year | 32.87% | 37.61% | 36.41% |
| Worst Year | -5.55% | -12.53% | -12.34% |
| Maximum Drawdown | -25.00% | -31.38% | -35.29% |
| Sharpe Ratio | 0.76 | 0.71 | 0.61 |
| Sortino Ratio | 1.17 | 1.09 | 0.94 |
The answer is not much difference in terms of returns.
Small cap value does the worst on a risk-adjusted basis.
This is part of factor investing. Results may underperform for long periods.
Interactions with Other Factors
The Overlap Between Size and Value
Small companies often share traits with value stocks: lower price-to-book ratios, higher perceived risk, and more variable earnings.
This overlap means that part of the size premium historically credited to market capitalization might actually stem from value exposure.
Researchers have shown that when you adjust for valuation, the pure size effect weakens.
Yet, many still view the combination of small and value as a strong mix, as shown above, offering both long-term return potential.
The “Junk Small Cap” Problem
Not all small-cap stocks deliver superior returns.
Many are financially fragile, with poor profitability, high leverage, or weak cash flow.
These “junk” small caps tend to drag down performance during volatile markets.
Modern factor research, including studies from AQR (the link cited in the text immediately above) and Fama-French’s five-factor model, highlights that quality and profitability explain a large portion of why certain small firms outperform while others fail.
The best results tend to come from small but strong companies, not just any business with a low market cap.
Momentum and Cyclical Behavior
The momentum factor also interacts with size.
Small-cap leaders often experience sharper price trends, but they can reverse just as quickly.
Historically, the size premium has been strongest during early bull markets, when risk appetite and liquidity surge.
Factor Timing and Portfolio Balance
Size is rarely a standalone bet in institutional portfolios.
It’s combined with value, quality, and momentum to reduce concentration risk and improve consistency.
Understanding how these factors move together helps allocators avoid overlap and build more balanced portfolios.
Implementation in Portfolios
Practical Access to the Size Premium
Investors today can gain exposure to the size factor in many ways, from simple small-cap index funds (e.g., VB, SCHA, IWM, VBR) to more sophisticated factor-based ETFs (e.g., AQWX, LRGF, AVUS).
Traditional small-cap benchmarks, like the Russell 2000 or MSCI Small Cap Index, provide broad coverage. At the same time, they might not fully capture the academic definition of the size premium.
Factor funds, by contrast – if size is part of it – try to isolate the specific return source linked to small-cap risk and inefficiency.
Asset managers such as Dimensional Fund Advisors and AQR have built long records constructing portfolios designed to capture this effect in a more disciplined, evidence-based manner. (Their white papers on this are recommended if you’re interested further.)
For individual investors, low-cost ETFs now make it easy to include size exposure in a diversified portfolio.
The key lies in understanding that owning small caps is not the same as owning the size factor.
Many small-cap funds are dominated by lower-quality or highly cyclical firms, which may dilute the intended benefit.
Purpose-built factor strategies often tilt toward profitable, liquid small firms to improve long-term consistency.
Challenges of Trading and Liquidity
Implementing the size premium in practice involves real-world frictions.
Small stocks have wider bid-ask spreads, lower trading volume, and higher market impact costs. These issues can erode much of the theoretical alpha seen in historical studies.
Institutional managers overcome this by trading patiently, using algorithms to spread orders over time and minimize slippage.
For smaller investors, simply holding a diversified small-cap ETF avoids most of these costs, though it also limits the ability to fine-tune exposure.
Portfolio Construction and Weighting Choices
Another major consideration is how to weight holdings.
Market-cap weighting favors larger firms even within a small-cap index, while equal weighting gives more influence to truly small names.
Equal-weighted approaches often enhance the size effect but come with greater volatility and turnover.
The optimal design depends on the investor’s tolerance for fluctuation and transaction costs.
Many professional portfolios use a hybrid method, maintaining small-cap exposure without overconcentrating in illiquid microcaps.
Risk Management and Diversification
The size premium tends to shine in specific environments, particularly during early economic recoveries when credit conditions improve and risk appetite returns.
In downturns, however, small caps can fall faster than the broad market.
That volatility makes it important to view size exposure as one component of a multi-factor strategy, balanced by value, momentum, and quality factors.
Diversifying across multiple risk dimensions smooths the ride.
And not only that, but risk-balancing with different asset classes as well.
Current Debates and Future Outlook
Questioning the Persistence of the Premium
The size premium is no longer taken for granted.
Many studies suggest that once returns are adjusted for quality or liquidity, the advantage of small firms shrinks.
Some argue that the easy money from this factor has been arbitraged away as investors crowded in.
Regime Dependence
The strength of the size factor often depends on the economic climate.
Periods of rising inflation, tightening credit, or low risk tolerance tend to favor large firms, while small caps thrive in early expansions.
Small caps fell by a larger degree in 2008 and 2020, for example.
The Size Factor’s Evolution
Researchers now treat size as a conditional effect rather than a permanent edge.
Its value lies in timing (e.g., early expansion), diversification (e.g., part of a “whole market” strategy rather than just large cap), and disciplined exposure rather than blind faith in history.
Why Doesn’t the Size Factor Get Arbed Out?
The size factor exists because small firms carry higher risks (less liquidity, weaker balance sheets, and greater sensitivity to economic downturns) so investors demand extra return to hold them.
It also persists due to structural frictions: transaction costs, limited institutional access, and behavioral neglect.
Large funds can’t easily scale into small or micro caps without moving prices, and retail investors often avoid them (they generally aren’t popular and many aren’t recognizable companies).
These constraints prevent full arbitrage.
The result is a persistent premium that compensates for illiquidity, volatility, and information scarcity.
Accordingly, this makes the size effect one of the most durable yet hard-to-exploit anomalies in global equity markets.
Conclusion
The size factor remains one of the most debated yet enduring ideas in modern finance.
It began with the simple observation that smaller firms often outperform.
But over time, it evolved into a complex blend of risk, behavior, and structural market forces.
The factor’s power lies not in “guaranteed alpha” but in its ability to add distinct exposure that behaves differently from large-cap equities.
It’s more about using size as a strategic ingredient, and combining it with quality, value, and momentum to build a quality stock portfolio.
When used thoughtfully, the size factor still reflects why we participate in markets: accepting risk to pursue long-term reward.
Article Sources
- Banz, R. W. (1981). “The Relationship Between Return and Market Value of Common Stocks.” Journal of Financial Economics.
- Fama, E. F., & French, K. R. (1993). “Common Risk Factors in the Returns on Stocks and Bonds.” Journal of Financial Economics.
- Asness, C. S., et al. (2015). “Size Matters, If You Control Your Junk.” Journal of Financial Economics.
- Dimensional Fund Advisors and AQR white papers on the size premium.
The writing and editorial team at DayTrading.com use credible sources to support their work. These include government agencies, white papers, research institutes, and engagement with industry professionals. Content is written free from bias and is fact-checked where appropriate. Learn more about why you can trust DayTrading.com