Global Investment Returns Yearbook Summarized (125 Years of Financial History)


The UBS Global Investment Returns Yearbook covers a 125-year dataset of financial returns over 35 markets and multiple asset classes.
It’s useful to investors and long-term allocators because it provides insights into what kind of returns can be expected and how to go about making portfolios more resilient.
For traders and shorter-term allocators, this is also useful information because it’s important to understand what kind of returns are realistic and if our trading is adding value.
It also sheds insight into factors and the different components of portfolios.
We summarize its findings.
Key Takeaways – Global Investment Returns Yearbook Summarized
- Over 125 years and 35 markets, equities delivered the highest long-term rewards.
- US stocks compounded $1 into over $107,000 by 2025, far outpacing bonds ($268) and bills ($67).
- Bonds provided income and stability but only ~0.9% real annual returns.
- Bonds smooth volatility and mostly hang on to purchasing power on net. (Also factor in taxes.)
- Major market crashes took years or decades (e.g. Japan 1989 to mid-2020s) to recover.
- For the average investors (and most professional investors) time in the market beats timing the market.
- Diversification (across asset classes, regions, and inflation regimes) consistently reduced drawdowns and improved Sharpe ratios/risk-adjusted metrics.
- Inflation erodes purchasing power: $1 in 1900 = $37 today, so it’s important than a portfolio is at least protecting purchasing power.
- Think of returns in real terms, not nominal terms.
- Gold and commodities hedge inflation but are imperfect.
- 5-15% allocations can better balance portfolios.
- We like at why certain factors deliver outperformance (it’s heavily related to risk compensation).
- Value, momentum, quality, and low volatility factors have tended to historically outperform in factor investing strategies.
- We do 3 short analyses of the size and value factors.
- The enduring message: stay diversified, patient, and realistic.
- Related: 500 Years of Financial History and Lessons for Today’s Portfolios
How Markets Change Over Time
From Railways to Microchips
If an investor from 1900 could step into today’s markets, they wouldn’t recognize much.
At the dawn of the twentieth century, railroads were a key investment trend.
In the United States, they made up over 60% of total stock market value, while in Britain, coal, steel, and textile companies drove the industrial economy.
Markets were tied to physical infrastructure and tangible production. The rhythm of progress was measured by the speed of trains and the weight of steel output.
Fast forward to today, and the market’s pulse is heavily digital.
Technology, healthcare, and energy dominate global equity value, industries that barely existed or were irrelevant to investors a century ago.
A single cloud computing or biotech firm can now reach a valuation larger than entire national exchanges from the early 1900s.
This shows how innovation consistently rewrites what counts as “productive capital.”
Innovation and the Rise of New Titans
Every generation sees its own industrial revolution.
Investors often fall in love with the dominant companies of their era, believing their reign will last forever. But history shows otherwise.
While Google, Microsoft, Facebook/Meta, and Apple have been the dominant companies in the first part of the 21st century, it’s more likely than not that other companies will come up to replace them.
Railroad barons gave way to automotive giants, which in turn ceded dominance to technology firms.
What’s consistent isn’t the winners, but the process of change itself.
This is why stock-picking isn’t easy and why buying indexes – that naturally take up winners and throw out losers that meet or don’t meet certain criteria – is so widely practiced today.
It’s almost like an automated way to stay up to date.
The Age of Concentration
Today, the top ten – by market cap – global companies represent about a quarter of the world’s entire stock market capitalization.
A handful of tech-driven megacaps have redefined global equity leadership, and their individual movements are highly influential on overall index moves.
For investors, this creates risk, as an index becomes increasingly driven by fewer components.
For example, if the top 7 companies in the S&P 500 account for 35% of its valuation, that means they’re each (on average) 38x more influential on its valuation than the other 493.
The Timeless Lesson
Industries rise and fall, but diversifying can protect investors from the illusions of permanence.
What drives the economic engine keeps reinventing itself, but spreading investments across its changing parts tends to be most reliable.
The Power (and Patience) of Equities
A Century-Long Compounding Story
Few numbers tell the story of long-term investing as clearly as this one: a single dollar invested in US stocks in 1900 grew to over $107,000 by 2025.
The same dollar in long-term government bonds reached just $268, and in short-term Treasury bills, only $67.
The difference is the reward for accepting risk, volatility, and uncertainty over an entire century.
Stocks have historically offered an annualized nominal return of 9.7%, far outpacing bonds at 4.6% and bills at 3.4%.
Over time, that small percentage gap compounds significantly, which is why equities are so popular.
The Price of Long-Term Reward
Of course, equity investors have earned those rewards the hard way. Markets have never moved in straight lines. There were decades of booming optimism and years of painful collapse.
Even the strongest bull runs have been punctuated by sudden corrections that tested conviction. As the saying goes, it can be an escalator ride up and elevator ride down.
Ever since the 2009 lows, the S&P 500 is many multiples off its lows, but there were painful drawdowns in 2018, 2020, 2022, and 2025. (And many other dips along the way.)
This volatility isn’t a flaw of equities, per se, but reflective of the duration of the asset class and variance in many different economic variables (e.g., growth, inflation, interest rates, risk premiums).
The Human Element: Patience and Perspective
The greatest equity premium has always belonged to those who stayed the course.
Selling during panic or chasing hot assets during euphoria has cost traders and investors far more than bear markets themselves.
The behavioral edge (staying patient, disciplined, and focused on the long arc of history) remains the hardest and most valuable trait in investing.
Over 125 years, equities have proven that time in the market beats timing the market.
Short-term trading can add a lot of value for those who know what they’re doing.
But for most, it’s not about predicting, being in and out, choosing what securities are good and bad, being opinionated, etc., but simply continuously saving and investing that leads to good results over time.
Bonds and the Role of Fixed Income
A Middle-Ground Asset
Bonds aren’t cash and they’re not stocks. They return somewhere in the middle and have risk somewhere in the middle.
So, they’ve never been the most glamorous part of investing.
They don’t make headlines for spectacular returns, and few investors brag about their bond portfolios.
Yet, for more than a century, fixed income has been a key source of stability and income in a portfolio.
Across 125 years of data, government bonds delivered an average real (inflation-adjusted) return of about 0.9% per year.
That number is relatively small next to equity gains, but bonds can better smooth the ride when equities are turbulent and provide a sense of predictability that many depend on.
Also, in modern financial engineering contexts, bonds can be made competitive with stocks as we know the return relative to the risk is about equal between the two. (This is done with certain leverage and leverage-like techniques.)
The Limits of Safety
That safety has a trade-off.
Bonds protect from short-term market swings but may not always protect against the slow grind of rising prices. The post-pandemic years reminded investors of this reality.
In 2022, stocks and bonds fell together, ending a long period when the two often moved in opposite directions.
Inflation became the main macro driver of changes in asset prices rather than growth, which caused a change in correlations.
That sudden correlation break challenged one of modern portfolio theory’s core assumptions: that bonds offset equity risk.
Sometimes they don’t.
Rethinking the 60/40 Model
For a long time, the traditional 60/40 portfolio (60% equities, 40% bonds) was considered a balanced-ish formula.
It worked well in eras of moderate inflation and declining interest rates.
Yet today, where there’s more threat of yields and inflation rising, it’s not as solid as it once was.
- For one, equities still dominate 85-90% of the risk because equities have structurally longer duration.
- And two, stocks and bonds can fall together.
They’re no longer assumed to be the automatic diversifier they once were. A portfolio isn’t necessarily just one asset (stocks or bonds) or two (stocks and bonds).
Instead, they must be combined with other stabilizers such as cash-like assets (e.g., gold), commodities, or better global exposure.
With better global exposure, a portfolio isn’t just concentrated in dollars (or domestic currency) or tied excessively to one economy or economic cycle, a certain set of policies, etc.
The Real Role of Bonds
In the end, bonds remain what they’ve always been: peace of mind, income stability, and – because of their limited duration (and hence reduced price risk) – flexibility during crises.
Enduring Lessons on Volatility and Recovery
Every Crash Has a Story
Market history has many dramatic downturns that have tested every investor’s resolve.
The Great Depression saw stocks fall so deeply (89%) that it took 25 years to recover in nominal terms.
The Oil Shock of 1973–74 dragged markets down for over a decade.
The Dot-Com Collapse of 2000 erased trillions in paper wealth and needed seven and a half years for a full rebound in the S&P 500 and 16 years for the NASDAQ to recover (also both in nominal terms).
Even the Global Financial Crisis of 2008, though severe, required about four years before markets regained their footing.
In Japan, markets took approximately 35 years to recover in nominal terms, showing the effects of a devastatingly overblown bubble.
The Investor’s Real Test
Volatility is a normal figment of progress.
Those who stayed invested eventually saw their patience rewarded – and continuous contributions along the way help significantly.
Those who fled to safety often missed the turn upward that defines long-term success.
Wisdom From the Past
The English poets Byron and Wordsworth once wrote that the best guide to the future is found in the lessons of the past.
The same is true for investing. Markets fall, recover, and rise again.
The constant is that sticking to it with a well-diversified portfolio, not prediction, wins in the end.
Diversification Across and Within Markets
Spreading Risk
Over 125 years of global market data, diversification has consistently reduced risk without sacrificing much in long-term reward. (Especially if risk-weighted, like in risk parity portfolios, but that’s a more advanced concept.)
When one market struggled, another often thrived. When bonds faltered, equities or commodities/gold frequently surged or at least did better.
That financial assets will outperform cash is one of the most reliable assumptions in markets. Cash can outperform over short time horizons, but the capitalist system doesn’t work well when that’s not true for long horizons.
At its core, diversification isn’t just about owning many assets, but about owning assets that fundamentally behave differently.
In the United States, they found that the long-run stock-bond correlation has averaged only 0.19, while globally it has been about 0.33.
That low relationship between the two means that both equity and debt/credit claims are building blocks within a portfolio.
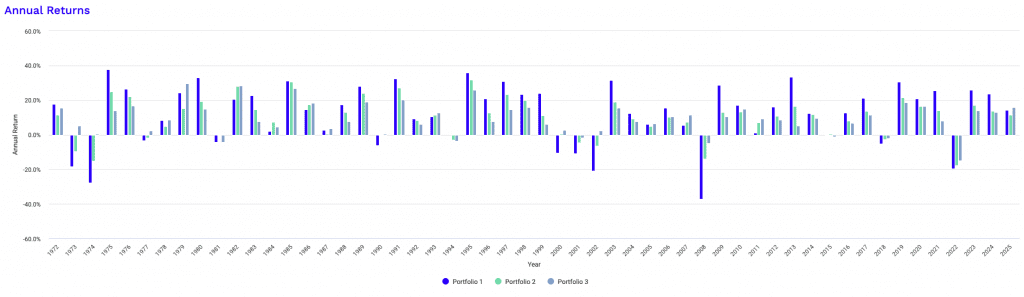
For example, let’s look at 3 different portfolios:
Portfolio 1
| Asset Class | Allocation |
| US Stock Market | 100.00% |
Portfolio 2
| Asset Class | Allocation |
| US Stock Market | 60.00% |
| 10-year Treasury | 40.00% |
Portfolio 3
| Asset Class | Allocation |
| US Stock Market | 40.00% |
| 10-year Treasury | 45.00% |
| Gold | 15.00% |
Performance Summary
| Metric | Stocks | 60/40 | Diversified |
| Start Balance | $10,000 | $10,000 | $10,000 |
| End Balance | $2,552,156 | $1,319,501 | $1,200,000 |
| Annualized Return (CAGR) | 10.86% | 9.51% | 9.32% |
| Standard Deviation | 15.65% | 10.11% | 8.23% |
| Best Year | 37.82% | 31.69% | 29.50% |
| Worst Year | -37.04% | -17.84% | -14.79% |
| Maximum Drawdown | -50.89% | -28.54% | -18.46% |
| Sharpe Ratio | 0.45 | 0.51 | 0.58 |
| Sortino Ratio | 0.66 | 0.76 | 0.90 |
Key Takeaways = Combining different returns streams provides a smoother path with fewer and more shallow drawdowns and better risk-adjusted metrics.
Below, the each of the portfolio’s individual performances year-by-year.
When Correlations Shift
From the late 1990s through 2021, investors enjoyed an era where stocks and bonds often moved in opposite directions.
This negative correlation gave the classic multi-asset portfolio its golden reputation.
Then came 2022, when both markets fell sharply together, which shattered the illusion that diversification always works the same way.
That year was a turning point. It reminded traders and investors that correlations are fleeting byproducts of assets’ environmental biases and that these patterns aren’t fixed or reliable.
They rise and fall with inflation, growth, policy changes, and global shocks. True diversification means being prepared for those shifts, not assuming that recent history will repeat.
Global Investing: Home Bias or Global Reach?
Diversifying across countries tells a similar story.
Over the past 50 years, global portfolios produced higher Sharpe ratios, better risk-adjusted returns, than purely domestic ones in nearly every country.
The only major exception was the United States, where staying home happened to outperform. But that success shouldn’t be mistaken for a universal rule that should be extrapolated and is likely to change at some point.
No one can predict which market will lead the next century, just as few in 1900 could have imagined the US’s dominance.
Investing globally widens opportunity and shields against local crises, political risk, and currency and industry concentration.
The Timeless Lesson
Diversification will never eliminate drawdowns, but it softens their blow, reduces the underwater periods, and keeps you in the game long enough to benefit from recovery.
Inflation and the Real Value of Money
When a Dollar Shrinks Over Time
Inflation is the quiet thief of investing. It doesn’t make headlines every day, but it constantly erodes the value of money.
A single dollar from 1900 now has the purchasing power of about $37.
So beyond what’s needed for short-term transactional purposes, it can’t be held in yield-less cash (paper money) or something that doesn’t keep pace with inflation and taxes on the interest.
Equities and the Battle Against Inflation
Over long periods, stocks have done the best job of outpacing inflation.
They represent ownership in companies that can raise prices, innovate, and grow earnings faster than the cost of living.
History shows that equities tend to perform especially well when inflation is low and stable.
High inflation, however, is a different story. It eats into real returns, raises interest rates (which lower valuations through the present value effect), and creates uncertainty that markets dislike.
Bonds fare even worse in these periods, as their fixed payments lose real value.
Why No Single Asset Can Save You
It’s tempting to look for a perfect hedge, but none exists.
Gold may hold value when currencies weaken, and commodities help protect against inflation risks, but both come with volatility and timing risk.
The truth is that the best protection against inflation is a balanced, diversified portfolio that includes assets capable of adapting to different economic climates.
- Stocks do well when growth is above expectation and inflation is steady or falling relative to expectations.
- Nominal-rate government bonds do well when growth and inflation are below expectation.
- Commodities do well when growth and inflation are above expectation.
- Cash does best when money and credit are tight.
The Lasting Lesson
It’s a reminder that money is a moving target. The value of something requires context.
They often say that a gallon of gas was only $0.25 during some parts of the first half of the 20th century. But in terms of buying power, that doesn’t mean it’s cheaper today.
A house that was only $100,000 in 1970 and $835,000 today has simply increased with inflation and there’s no real return in that figure (plus factor in operating costs, transaction costs, and other relevant costs).
Over 125 years, the investors who thrived were those who accepted that prices change, value shifts, and wealth must be actively protected. Staying diversified and long-term focused is still the most reliable defense against the slow, invisible tax that inflation always collects.
Gold, Commodities, and Inflation Hedges
The Allure of the Timeless Metal
Gold has fascinated investors for centuries.
Not because gold itself changes, but because everything else does.
When currencies lose value, real rates fall, and/or governments overspend, gold tends to shine.
Over the past fifty years, it has delivered an average annual return of about 7.5%. Its correlation with inflation, around 0.34, is stronger than most asset classes, but still imperfect.
That relationship means when prices rise, gold often does too. Still, gold isn’t perfect.
It also depends on the source of inflation. It’ll tend to do better during a monetary inflation rather than a cost-push or demand-pull type of inflation.
Between 1980 and 2000, it lost more than 40% of its real value. Like any asset, context matters.
It has an environment where it does well and an environment where it does poorly.
Commodities and the Inflation Connection
Commodities as a group have also served as inflation hedges, though imperfect ones.
Their average inflation correlation is 0.21, which makes them useful when price pressures are occurring, especially if commodities themselves are a source of that.
Energy and metals tend to lead the charge in those moments.
During the 1970s, for example, commodity indexes tripled while inflation averaged nearly 9% a year.
However, over longer periods, commodities often lag equities because they lack earnings or compounding. They also contain more volatility.
For this reason, they tend to be a lower allocations in portfolios.
Using Hedges Wisely
The lesson from a century-plus of data is that gold and commodities can be valuable, but not the main anchors in a portfolio.
They work best when paired with productive assets like equities and bonds that generate income and growth.
Having 5-15% of a portfolio in these inflation-sensitive assets can make sense for balance and protection.
The Bottom Line
Gold and commodities are similar to insurance policies, not necessarily strong engines of growth.
The Factor Investing Story
Understanding What Drives Returns
Behind every stock market index lies a set of patterns that explain why some investments outperform others.
These patterns are known as factors – namely, broad, persistent sources of return that go beyond market exposure.
The most studied include size, value, quality, momentum, income (or yield), and low volatility.
Each captures a specific behavioral or structural feature of markets.
And like many things in finance and trading/investing, there are trade-offs. For example, small companies often grow faster but carry more risk.
Value stocks, which trade cheaply relative to fundamentals like earnings, reward investors for taking on the uncertainty (e.g., business models no longer working as well, lower growth).
Momentum reflects the tendency of winning stocks to keep rising in the short to medium term, while low-volatility stocks show that slow and steady can sometimes outperform high-flyers and offer better risk-adjusted returns.
Summary of the Factors
1. Value (V)
Value means buying assets (stocks, bonds, currencies) that are cheap relative to their fundamental value.
Example metrics would be low Price-to-Earnings, low Price-to-Book, or high Dividend Yield.
Historically, cheap stocks tend to outperform expensive stocks over the long term.
2. Momentum (M)
Buying assets that have performed well recently (relative winners) and selling or shorting assets that have performed poorly recently (relative losers).
Captures the tendency for recent performance to persist in the short to medium term.
3. Quality / Profitability (Q)
This means favoring companies that are highly profitable, stable, financially healthy, and possess low operational risk.
For example, a high return on equity, stable earnings, and low debt.
Profitable, high-quality companies tend to be safer and produce better long-term returns than lower-quality peers.
4. Low Volatility / Defensive (LV)
Favoring stocks or assets that exhibit lower historical volatility, lower beta, and greater predictability.
Counter-intuitively, less risky, lower-volatility stocks often produce higher risk-adjusted returns than high-volatility stocks.
5. Size (S)
Favoring smaller capitalization stocks.
While size (Small Cap) was a cornerstone of early factor models, the size premium has actually been fairly weak or nonexistent in developed markets in recent decades. But it’s still included in foundational models.
This is something to keep in mind. While smaller companies may have more room to grow and achieve higher returns they also have less scale and don’t have some of the unique advantages of larger companies.
Let’s do some examples:
Example #1: Size
Let’s look at three portfolios:
- 100% Large Cap US Stocks
- 100% Small Cap US Stocks
- 100% Micro Cap US Stocks
The results:
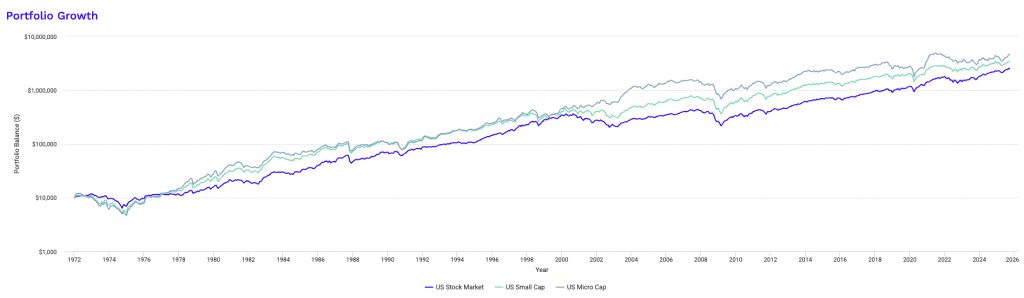
Performance Summary (1972-Present)
| Metric | US Stock Market | US Small Cap | US Micro Cap |
|---|---|---|---|
| Start Balance | $10,000 | $10,000 | $10,000 |
| End Balance | $2,552,156 | $3,377,384 | $4,714,168 |
| Annualized Return (CAGR) | 10.86% | 11.44% | 12.13% |
| Standard Deviation | 15.65% | 19.62% | 21.07% |
| Best Year | 37.82% | 55.13% | 80.98% |
| Worst Year | -37.04% | -36.07% | -39.86% |
| Maximum Drawdown | -50.89% | -53.95% | -61.91% |
| Sharpe Ratio | 0.45 | 0.43 | 0.44 |
| Sortino Ratio | 0.66 | 0.62 | 0.66 |
We can see that the smaller size aided returns long-term, at the trade-off of more volatility and deeper drawdowns.
Example #2: Size
Now let’s look at size, but separated using just the “value” components.
Let’s look at three portfolios:
- 100% Large Cap Value US Stocks
- 100% Mid Cap Value US Stocks
- 100% Small Cap Value US Stocks
And we see similar results:
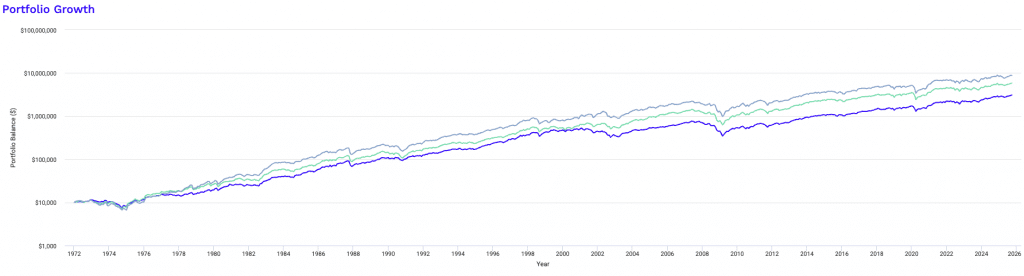
Performance Summary
| Metric | US Large Cap Value | US Mid Cap Value | US Small Cap Value |
|---|---|---|---|
| Start Balance | $10,000 | $10,000 | $10,000 |
| End Balance | $3,090,531 | $5,811,691 | $8,862,393 |
| Annualized Return (CAGR) | 11.26% | 12.57% | 13.46% |
| Standard Deviation | 14.92% | 16.76% | 18.39% |
| Best Year | 40.67% | 56.79% | 54.78% |
| Worst Year | -35.97% | -36.64% | -32.05% |
| Maximum Drawdown | -54.85% | -56.51% | -56.13% |
| Sharpe Ratio | 0.49 | 0.53 | 0.54 |
| Sortino Ratio | 0.73 | 0.78 | 0.80 |
Visually:
Example #3: Value
Now let’s compare two portfolios:
- 100% Large Cap US Stocks
- 100% Large Cap Value US Stocks
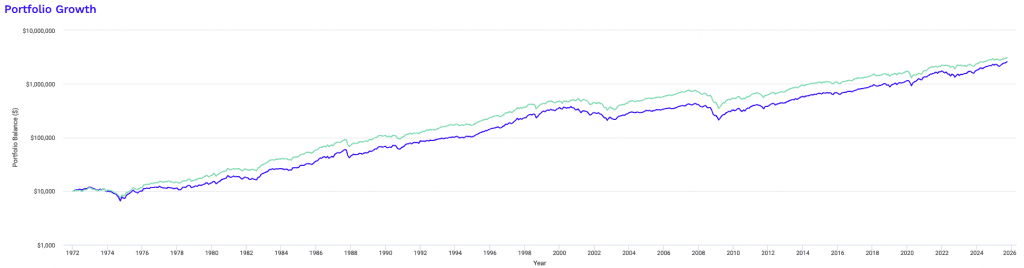
Performance Summary
| Metric | US Large Cap | US Large Cap Value |
|---|---|---|
| Start Balance | $10,000 | $10,000 |
| End Balance | $2,582,005 | $3,090,531 |
| Annualized Return (CAGR) | 10.89% | 11.26% |
| Standard Deviation | 15.31% | 14.92% |
| Best Year | 37.45% | 40.67% |
| Worst Year | -37.02% | -35.97% |
| Maximum Drawdown | -50.97% | -54.85% |
| Sharpe Ratio | 0.46 | 0.49 |
| Sortino Ratio | 0.68 | 0.73 |
And we see improvements in the value component slightly – and also with less volatility and better risk-adjusted ratios (though a larger maximum drawdown).
A Century of Evidence
Over 100 years of data, factor premiums have persisted across markets and asset classes.
Historically, global value and size factors have delivered average annual excess returns of 3-4% above the market.
Momentum has been even stronger in some periods, especially in the United States, where it contributed more than 5 percent per year during the late twentieth century.
But these rewards aren’t steady.
The value factor, for instance, lagged badly during the 2010s as growth stocks dominated, then rebounded sharply in 2022 when inflation and rates rose. Factor investing generally requires decades, not years.
Why Factors Exist
What we know about factors is that they persist because they’re tied to either risk compensation or human behavior.
Some strategies can be psychologically difficult to stick to long-term (e.g., value, small cap drawdowns).
Investors dislike short-term pain, so they often abandon strategies when they underperform, even if history suggests they eventually recover.
Behavioral biases (overconfidence, herding, and loss aversion) create the inefficiencies that factors exploit.
In other words, factors work because most investors can’t stick with them.
Using Factors in Modern Portfolios
Today, factor exposure can be built through ETFs or systematic strategies at very low cost.
Chasing recent winners usually backfires because you’re buying at higher prices.
It’s like gold’s run in 2025. Many new buyers bought it simply because it went up a lot, which to many signaled that it’s more valuable.
A diversified factor mix (spanning value, momentum, quality, and low volatility) tends to provide smoother returns.
The Key Takeaway
Value, momentum, quality, and low volatility factors have tended to historically outperform in factor investing strategies. Minus the momentum part, almost Warren Buffett-like.
Overall, factor investing isn’t some type of abstruse shortcut to beating the market.
It’s a disciplined framework for understanding where returns come from and how to capture them patiently over time.
Looking Ahead – The Future Through the Lens of the Past
Markets change, but human behavior rarely does.
The first quarter-century of the 21st century delivered 3.5% real annual equity returns, lower than the 20th century’s golden era, yet stocks still outperformed every other asset.
And 3.5% real returns seems low, but we also have to remember that we had two really big crashes in the first decade.
We were only 2-3 months into the new century when markets fell significantly – especially tech – starting in March 2000. 2000, 2001, and 2002 were all down years for equities.
2008 was another 1929 type of dynamic.
The main lesson: patience and diversification remain key pillars.
Equities reward long-term conviction.
Diversification reduces pain but not all loss.
Inflation is the silent tax that punishes complacency. Find multiple ways to hedge against it, whether it’s stocks, reducing reliance on nominal bonds, using inflation-indexed bonds for a portion of your fixed-income exposure, gold, commodities, and international exposure.
Above all, perspective matters. History shows that wealth belongs to those who stay invested through uncertainty, adapt when environments shift, and never confuse volatility with failure.
The future will test investors differently. Every crisis has different characteristics. But the principles that built fortunes over 125 years remain the same.