Stock Market Facts & Statistics


In this article, we have an era-by-era compendium of stock-market-relevant facts and statistics.
We go from ancient antecedents and early joint-stock experiments, through the Dutch birth of the modern exchange, to today’s high-speed, ETF-soaked, options-heavy markets.
Ancient and Medieval Antecedents (to 1500)
In classical Athens (5th-4th c. BCE), private bankers (trapezitai) took deposits, made loans, and transferred funds.
These were the early building blocks of capital markets. While there was no equity market as we know it today, contractual profit-sharing and maritime loans created tradable claims on future proceeds.
In the Roman Republic and Empire (2nd c. BCE onward), the societates publicanorum (private companies that farmed taxes and state contracts) issued partes (shares) that could be bought and sold among Roman elites. This is often cited as the closest ancient analogue to equity shares: transferable ownership claims in a profit-seeking enterprise performing public functions.
Medieval Europe’s bills of exchange (13th-15th c.) and long-distance merchant finance laid the plumbing for liquid markets: standardization of contracts, transferable claims, and the idea that risk can be priced and sold.
By the late 1500s, commodity bourses (e.g., Antwerp) featured organized, repeated trading sessions and price discovery across merchants. These proto-marketplaces normalized the concept of standardized trading venues.
The Dutch Golden Age and the Birth of Modern Securities Markets (1600–1700)
1602
The Dutch East India Company (VOC) becomes the world’s first widely held, permanent joint-stock company with freely transferable shares, and the Amsterdam Stock Exchange is generally recognized as the world’s first formal securities exchange.
The VOC’s charter explicitly opened share purchases to residents of the Dutch Republic; trading quickly moved to a secondary, organized market in Amsterdam.
First “IPO”
The VOC’s 1602 public share subscription is widely described as the world’s first initial public offering.
While not an IPO in today’s regulatory sense, it functioned similarly: citizens subscribed capital to a permanent enterprise with the expectation of dividends and capital gains.
Financial literature is born
In 1688, Joseph de la Vega publishes Confusión de confusiones, the earliest full-length book on stock trading and market psychology, describing bulls, bears, corners, and options in Amsterdam, centuries before CNBC.
Early market microstructure
Amsterdam pioneered short selling, options, forward contracts, and margin arrangements. These techniques are recognizable to modern derivatives traders.
Bubbles Before “The Bubble”: Tulips and the 1720s Manias (1630s–1720s)
1636–1637 Tulipmania
Contracts on rare tulip bulbs in the Dutch Republic experienced an extraordinary price spike and crash.
The extent and mechanics remain debated by historians, but it’s a foundational cautionary tale about leveraged forward contracts, thin collateral, and reflexive expectations.
1720 “The Year of Bubbles”
The South Sea Bubble (London) and Mississippi Bubble (Paris) become the first truly international asset manias.
The South Sea Company’s stock, inflated by debt-equity conversions and speculative fervor, rose from roughly £128½ early in 1720 to £1,000 by August, then collapsed about 80% by year-end. This prompted the Bubble Act and a generation of regulatory caution.
Archival price series for scores of 1720 securities now exist (Yale ICF), letting researchers reconstruct the bubble’s breadth across London, Amsterdam, and Paris.
Isaac Newton’s losses (he “could calculate the motions of the heavenly bodies, but not the madness of people”) symbolize the era’s speculative fever and the better understanding of markets’ probabilistic/non-deterministic nature. Modern scholarship has traced what he actually did during 1720.
1688-1720 market wisdom
De la Vega’s aphorisms (“expectations move markets more than events”) echo in modern behavioral finance.
It also has relevance to today in how companies can have very high valuations not because of profits, but because it’s simply the capitalized present value of an idea – i.e., something that can simply be a long-duration expectation, not profitable output.
Institutionalizing Exchanges (1700s–1800s)
1792 | Buttonwood Agreement (New York)
Twenty-four brokers agreed to trade only with each other at fixed commissions.
This created the seed of what became the New York Stock Exchange (NYSE).
The deal followed the financial panic linked to speculator William Duer, and is commemorated as the NYSE’s founding.
Surviving text shows the 0.25% commission clause and restricted dealing among signatories.
Coffee-house dealing to formal boards
London’s Exchange Alley progressed from coffee-house trading to more formal arrangements.
This mirrored New York’s path from curb trading to organized exchange floors.
Data and disclosure
The 19th century brought telegraph-assisted price dissemination, ticker tape (1867), and more standardized corporate accounts.
The Long-Run Return Canon (1900–Present)
The definitive source on century-plus returns across countries is the Global Investment Returns Yearbook (Dimson, Marsh, Staunton; now UBS).
It tracks 35 markets (23 back to 1900), with global composites for world, world ex-US, developed, and emerging markets.
Its long-run evidence underpins the modern view that equities earn a positive real (i.e., inflation-adjusted) premium over bonds and bills, though future returns are likely below the 20th-century heyday.
Rule of thumb (from DMS/“Triumph of the Optimists”)
Global equities have earned mid-single-digit real returns since 1900 (roughly ~5% real), beating government bonds (≈~2% real) and bills (≈~0.5–1% real).
- $1 invested in US stocks in 1900 -> ~$80,000 in real terms by 2025 (≈6.5% annual real return)
- $1 in bonds -> ~$300
- $1 in T-bills -> ~$20
Implication
Over long spans, equity outperformance compounds dramatically.
But the premium arrives unevenly, with the trade-off comes in the form of deep drawdowns, regime shifts, and multi-decade valuation cycles.
Global Scale and Composition
- Public company count worldwide: ≈58,000 listed firms, down from ~60,000 in 2017
- NYSE + Nasdaq combined ≈42% of global market cap
| Year | Global Market Cap (USD trillions) | % of World GDP | # Listed Companies |
| 1900 | ~0.05 | <10% | Few hundred |
| 2000 | ~30 | ~85% | ~51,000 |
| 2025 | ~115 | ~130% | ~58,000 |
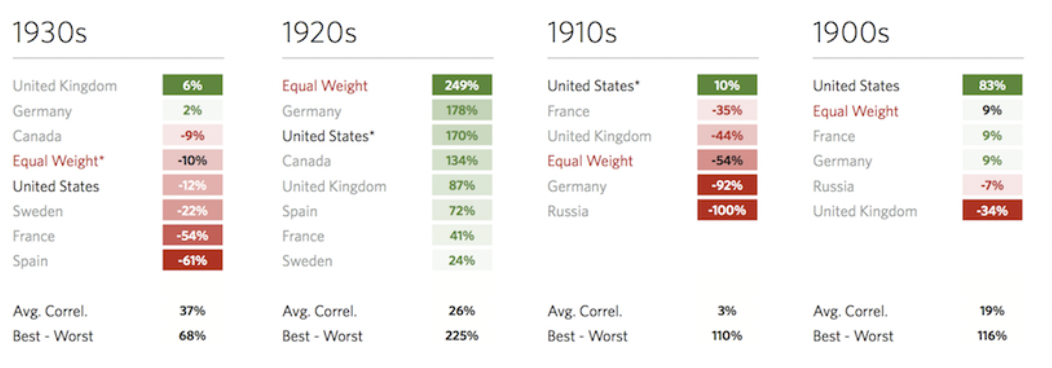
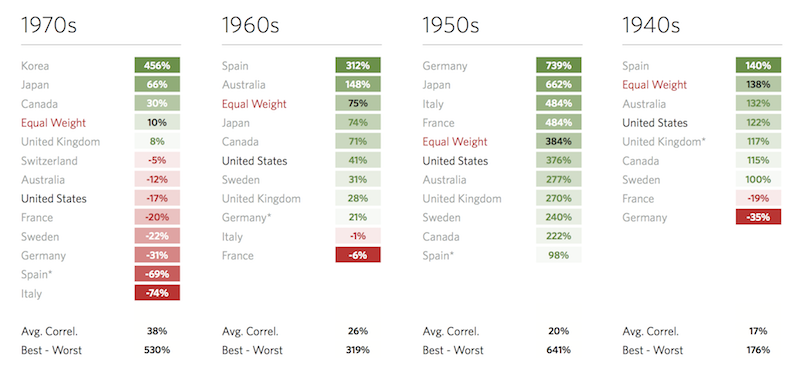
Decade by Decade
As we covered here, below are decade-by-decade returns by major markets:
1900s-1930s
1940s-1970s
1980s-2010s

Great Crashes and Drawdowns
1929–1932 (Great Depression)
After a September 3, 1929 peak (Dow 381), the US market fell to 41 by July 1932, an ~89% collapse.
It didn’t reclaim its 1929 high until 1954 (in nominal terms).
Contemporary and retrospective sources concur on the magnitude and duration of this drawdown.
Black Monday (Oct 19, 1987)
The Dow plunged -22.6% in one session; the S&P 500 lost -20.5%, the worst one-day percentage drop in modern US history.
The episode catalyzed risk controls, portfolio insurance debates, and, ultimately, today’s market-wide circuit breakers.
2008–2009 GFC
Peak-to-trough, the S&P 500 fell ~-57% (Oct 2007-Mar 2009), dividends dipped, and correlation spikes under stress were re-learned.
- Peak: October 9, 2007 — S&P 500 at 1,565.15
- Bottom: March 9, 2009 — S&P 500 at 676.53
COVID shock (Feb–Mar 2020)
The S&P 500 fell 34% in 33 days (the fastest bear market on record, even faster than 1929 during the onset of the Great Depression).
This triggered multiple Level 1 circuit breakers.
The post-2008 architecture of market-wide and single-stock halts (LULD) was road-tested and broadly worked as designed. More on this in a later section.
Valuations: CAPE and the Big Cycles
CAPE (Shiller P/E)
Robert Shiller’s database (monthly since 1871) computes the cyclically adjusted P/E.
Peak readings occur at major euphoria points: ~44 at the 2000 dot-com peak; high-30s/low-40s at various points in the 2020s. (Source)
Shiller’s original data remain the primary reference for valuation history; third-party dashboards track the live value.
Using CAPE
High CAPEs correlate with lower subsequent long-term real returns. There’s wide dispersion in the short run.
Both short-term and long-term P/E are a wind-direction indicator, not a timer.
The United States’ Market Share of the World
The US remains the largest equity market by free-float market cap.
UBS’s Yearbook overview notes the breadth of US listings and the prevalence of US firms in global benchmarks; recent editions and summaries discuss the US share of the world index and its persistence as a mega-weight.
Here are the current top countries by share of global free-float market cap, using the MSCI ACWI (free-float-adjusted, large & mid caps) as of June 30, 2025:
- United States – 64.13%
- Japan – 4.83%
- United Kingdom – 3.26%
- China – 2.95%
- Canada – 2.86%
- France – 2.47%
- Germany – 2.31%
- Switzerland – 2.13%
- Taiwan – 1.97%
- India – 1.88%
Going forward, expect the US’ weight to fall and China’s and India’s to rise.
In terms of emerging market and frontier market share:
- Emerging market share of world cap is ≈11%
- Frontier market stats (market cap <1% global)
Sector & Industry Composition
Top sectors by global weight (Information Technology ≈23%, Financials ≈15%, Health Care ≈12%).
Sector rotation over time:
- 1900s: railroads, banks, mining.
- 1950s–70s: industrials, energy.
- 1990s–2020s: tech & communication.
Historical S&P 500 sector weight changes (Technology 6% -> 35%).
Macro and Wealth Ratios
- Equity Market Cap / Global GDP ratio: 2025 ≈130% (vs. 40% in 1990)
- Market Cap / GDP by Country (US ≈160%, Japan ≈120%, India ≈100%, China ≈70%)
- Corporate profits / GDP share trend (US: 5% in 1950s → ~12% in 2020s)
Global Wealth & Participation
- Estimated global household equity ownership: ~56% of adults own stocks in US; it’s <10% in most emerging markets.
- Equity ownership by demographic: 1% of US investors hold ~54% of equity wealth
Volatility and Risk Measures
- Long-run average annual volatility for major indices (S&P 500 ≈ 15-17%; MSCI EM ≈ 22%).
- Historical VIX averages (mean ≈ 19 since 1990).
- Max drawdowns beyond 1929 (1973-74 oil shock: -48%; 2000-02 tech bust: -49%; 2008: -57%; 2022 inflation bear: -25%).
- Average frequency of bear markets (every 5–6 years historically).
How the Microstructure Changed: From Fractions to Speed, and the Rise of Halts
Decimalization (2001) replaced fractional quotes (e.g., eighths) with pennies, compressing spreads and changing dealer economics.
Vestiges of the fractional era can still be seen in various commodities, like corn, cattle, and others.
Circuit breakers (market-wide)
Today, US markets halt at -7% (Level 1) and -13% (Level 2) for 15 minutes during most of the day; -20% (Level 3) halts trading for the rest of the session.
Triggers are based on the prior close of the S&P 500 and are recalculated daily.
LULD (single-stock “limit up/limit down”)
Implemented post-Flash Crash, LULD sets dynamic price bands around a reference price for each NMS stock to prevent executions far away from consensus value.
Academic and SEC analyses find LULD reduced the frequency/magnitude of extreme, short-lived price reversals compared to prior mechanisms.
Technological & Structural Innovations
- Average trade execution latency is now <0.001 sec)
- Daily US equity trade count (≈100–150 million trades/day)
- Global adoption rates of central clearing, dark pools, and ATS volume is now ~40% of US off-exchange
The Passive and ETF Revolutions
Index funds & ETFs
Indexing evolved from niche to dominant allocation channels.
ETFs now span nearly every exposure: country, sector, factors, themes, commodities, volatility, and options overlays.
Dividends & buybacks
For US large caps, total shareholder yield (dividends + net buybacks) is often a better cash-return gauge than dividend yield alone.
In 2024, the S&P 500 set a record $942.5B in buybacks (+18.5% YoY), while aggregate dividends reached a per-share record, showing the structural shift toward repurchases in the 21st century.
Dividend yield drift
The S&P 500 cash dividend yield in the 2010s–2020s has often hovered around ~1-2%, well below mid-20th-century norms.
This is because prefer buybacks and investors are also willing to pay higher multiples for earnings.
Behavioral & Flow Statistics
- Retail investor share of trading volume (≈25-30% in US equities)
- Institutional vs. passive fund ownership (passive ≈45% of US equity AUM)
- ETF share of daily trading volume (≈30-35% US)
Options and the New “Gamma Age”
Record volumes
US-listed options trading notched its fifth straight record year in 2024; the OCC reports 12.22 billion total contracts in 2024 (≈91% equity options).
Cboe’s 2024 report confirms a 12.3B US total. SIFMA tallies show options ADV up ~127% since 2020, with very strong growth in short-dated contracts.
0DTE options (same-day expiry) exploded in popularity.
Because of market makers’ need to hedge options selling intraday, this leads to hedge-based flows and “gamma” dynamics that can amplify index moves, a structural change in intraday liquidity conditions noted by exchanges and market-structure groups. (Trade-press summaries and SIFMA compendium capture the trend.)
High-Frequency and Algorithmic Trading
HFT share
Estimates vary by period and methodology, but multiple public sources (SEC studies, academic work, and market-structure primers) place algorithmic/HFT activity at 50%-70% of US equity volume in the 2010s–2020s.
Flash Crash (2010)
Flash Crash (2010) and subsequent reforms motivated LULD, kill switches, and better cross-market coordination. The SEC’s detailed post-mortem includes time-sliced HFT participation analyses around the event.
Global Market Statistics and Scale
Coverage
The World Federation of Exchanges (WFE) and exchange families (e.g., Euronext, Nasdaq, NYSE/ICE, Cboe) publish market-cap, listings, and turnover series. (WFE data are the standard reference for global counts; Euronext Amsterdam explicitly notes its 1602 roots.)
- Turnover velocity (ratio of annual traded value to market cap): US ≈ 150%, Japan ≈ 60%, Europe ≈ 90%
Amsterdam’s continuity
The Amsterdam exchange, now Euronext Amsterdam, is widely cited as the oldest continuously operating stock exchange.
Modern references link today’s market to the VOC’s 1602 foundation and to de la Vega’s 1688 chronicle of trading practices.
New Listings and Mega-Caps
Largest IPOs
The leaderboard features Saudi Aramco (2019) and Alibaba (2014) among the largest by proceeds, while dozens of tech and state-linked offerings populate the global top-20.
Mega-caps
The first $1T US market-cap milestone came in 2018. Subsequent races to $2T–$5T established a new scale for single issuers’ index weight and buyback firepower, context for why passive ownership and top-heavy concentration matter for portfolio construction.
NYSE and US Market Architecture in Practice
Trading day protection
Market-wide halts at -7%/-13%/-20% are synchronized across exchanges and recalculated each morning. They apply until 3:25 p.m. ET (Level 1/2); after 3:25 p.m., only a Level 3 can halt the market. Single-stock LULD bands throttle trades outside dynamic ranges, reducing “air-pockets.”
Why it matters
2020’s pandemic halts validated the design: fast declines were paused, not frozen; price discovery resumed in orderly auctions with narrower spreads than in 2010.
A Chronological “Stat-Walk” Through Market History
- 1602 — VOC formed; shares publicly subscribed; Amsterdam Stock Exchange becomes the first modern exchange.
- 1600s-1700s — Amsterdam pioneers short selling, options, forward deals; De la Vega (1688) documents market behavior and tactics.
- 1720 — The South Sea and Mississippi bubbles erupt; London passes the Bubble Act. Prices in South Sea stock surge to £1,000 and collapse ~80% by December.
- 1792 — Buttonwood Agreement in New York (24 brokers; 0.25% commissions) after a panic linked to William Duer; the NYSE traces its lineage to this date.
- 1867 — Ticker tape accelerates price dissemination; arbitrage compresses quote discrepancies across venues.
- 1871-present — Shiller’s US price/earnings/dividends/CPI series enables CAPE analysis. CAPE peaks near 44 in 1999–2000, and revisits high-30s/low-40s in the 2020s.
- 1900–present — Global equities deliver a mid-single-digit real return premium across 35 tracked markets in the Global Investment Returns Yearbook; bonds and bills trail.
- 1929-1932 — ~89% peak-to-trough US drawdown; new high not seen until 1954.
- 1987 — Black Monday: -22.6% Dow day; post-crash reforms set the stage for circuit breakers.
- 2001 — Decimalization compresses spreads; high-frequency strategies flourish.
- 2010 — Flash Crash accelerates LULD development.
- 2013 — LULD adopted for single stocks; market-wide breakers standardized on S&P-based 7/13/20% levels.
- 2020 — Pandemic Level 1 (-7%) halts triggered multiple times. Policy backstops arrive and a historic rebound follows.
- 2024 — US options volume hits ~12.2B contracts; buybacks set a $942.5B S&P 500 record; dividend payouts per share record as well (even if dividend yields remain low by comparison).
How to “Read” Market Statistics in Context (A Few Principles)
Regime awareness beats single-number fixation
A “5% real equity premium” is an average across wildly different eras: gold standards, wars, inflation shocks, tech booms, disinflations, and zero-rate decades.
Valuation informs expectations, not timing
High CAPE -> lower forward returns on average, but dispersion is huge.
Structural supply/demand, tax policy, buybacks, and index concentration all modulate realized returns.
Microstructure matters
Decimalization, maker-taker fees, LULD, and auctions shape spreads, depth, and how stress propagates.
Circuit breakers slow stampedes without trying to stop price discovery.
Cash returns now = dividends + buybacks
In the US, buybacks usually exceed dividends.
A portfolio’s income stream increasingly arrives via net reduction in share count rather than cash coupons.
Options flows are a first-order force
The post-2020 surge in short-dated options reshaped intraday dynamics.
This became relevant for interpreting volatility spikes, “pinning,” and end-of-day ramps.
Ownership and concentration change risk
When a handful of mega-caps dominate market-cap-weighted indices, the top names’ earnings, buybacks, and multiple drift drive most investors’ outcomes, statistically and mechanically.
Deeper Cuts: Niche but Fascinating Market Stats
The earliest “options manual”
De la Vega (1688) describes time bargains and puts/calls on VOC shares. Includes colorful vignettes of squeezes, rumors, and bucket shops.
Bubble lawfare
The Bubble Act (1720) attempted to choke off rampant joint-stock promotions by restricting incorporation.
It arguably led to unintended consequences, contributing to stunting Britain’s equity culture for decades. (South Sea chronologies via central bank researchers.)
Market-halt taxonomy
In US rules, Level 1 and Level 2 halts last 15 minutes if triggered between 9:30 a.m. and 3:25 p.m. ET. Level 3 (-20%) ends trading for the day, an underappreciated detail for risk managers modeling tail liquidity.
Options microstat
Short-dated (sub-one-week) options volumes grew >3x since 2018, vastly outpacing total options growth.
This pulled more hedging activity intraday.
Buyback mechanics
The 1% buyback excise tax in the US, instituted in 2023, has had a minor impact on repurchase economics at the index level per S&P DJI’s summary data.
EPS share count continues to trend down among heavy repurchasers.
Dividend and Buyback Ratios
- Dividend share of total return historically (~40-45%).
- Aggregate dividend payout ratio trend (60-70% mid-20th century -> 35% now).
- Global annual dividend payout ($2.0-2.5 trillion, 2024).
- Long-term share count shrinkage for S&P 500 (~1-2% annually since 2010).
“Then vs. Now”
Transferability of ownership
- Then: VOC shares entered a secondary market with paper transfers and coffee-house settlement.
- Now: Dematerialized shares settle T+2 -> T+1 (US), with central clearing, margin nets, and omnibus custodians.
Information flow
- Then: Letters, gazettes, hand-posted prices.
- Now: Microsecond feeds, co-location, smart routers. LULD and auctions cushion data-driven microbursts.
Investor base
- Then: Merchants, nobles, and a small rentier class.
- Now: Households (via funds/ETFs), pensions, sovereign wealth, and global cross-listings.
Risk controls
- Then: Ad hoc suspensions and crown decrees.
- Now: Rule-based circuit breakers and LULD bands, harmonized cross-market.
Cash returns
- Then: Almost all via dividends (VOC was famous for them).
- Now: Dividends + Buybacks dominate the shareholder yield discussion. Buybacks are bigger in the US because of the tax arbitrage (ordinary income vs. capital gains).
For the Data-Hounds: Where to Pull the Raw Series
Global long-run returns
UBS Global Investment Returns Yearbook (Marsh/Staunton/Dimson) is the gold standard for cross-country, 1900-present returns on stocks, bonds, bills, inflation, FX.
The 2024 edition (25th) covers 35 markets with five composites.
US valuation/time series
Shiller’s Yale dataset (monthly since 1871) for price, earnings, dividends, CPI, real returns, and CAPE.
Market structure
SEC/Investor.gov pages on circuit breakers and LULD, plus SEC white papers on the effects of LULD on extreme intraday volatility.
Options
OCC annual totals, Cboe annual report, SIFMA compendia for ADVs and product mix growth (esp. short-dated).
Amsterdam origins
- Euronext Amsterdam history pages.
- Petram’s doctoral thesis on the world’s first stock exchange.
- Curated history portals on the 1602 VOC IPO.
1929 crash
Britannica and Federal Reserve History entries for drawdown magnitudes and timeline.
Bringing It Together: What the Statistics Say About Markets
Markets are social technologies that compound information
From VOC share registers to microsecond quotes, the upward march is toward faster, broader participation and tighter pricing, with new failure modes at each step (manias in 1720, portfolio insurance in 1987, order-routing feedback in 2010, options-gamma shocks in the 2020s).
The stats document the plumbing, not just the payoffs.
Equities have dominated the long run, but the “how” of return delivery changes
The Yearbook’s cross-country record shows a strong real equity premium over a century-plus.
Long-run S&P 500 average annual total return: ~10.4% nominal, ~6.8% real (1926–2025).
Yet the mixture of dividends, buybacks, and multiple expansion constantly evolves.
Post-1982 buyback liberalization and 21st-century mega-cap concentration reshaped how index-level EPS grows.
Protection systems are now rules-based, not discretionary
Circuit breakers and LULD are statistical guardrails embedded in market code.
They’ve been refined by historical failures and tested in live fire (2020).
Liquidity is conditional
Statistics like ADV and spread say little about depth at the price you need in the moment you need it.
Options market growth and HFT participation show how liquidity can be abundant until a feedback loop hits. That’s a statistical lesson markets keep re-teaching.
Valuation matters most when your horizon is long
The CAPE’s value is statistical and horizon-dependent.
High CAPE regimes have, on average, delivered lower forward real returns, information best used for setting expectations and savings rates, not alarms.