Extreme Value Theory (EVT)


Extreme Value Theory (EVT) is a branch of statistics dealing with the extreme deviations from the median of probability distributions.
It focuses on understanding the behavior of the tails of distributions, which is important in finance and risk management.
Key Takeaways – Extreme Value Theory (EVT)
- Risk Assessment
- EVT assesses the risks of rare, extreme events.
- Often used in finance to model market crashes or other tail risks.
- Fat Tails
- It effectively models the tails of distributions.
- Captures the behavior of extreme deviations beyond standard statistical models, relevant for “fat tails” in financial return distributions.
- Predictive Modeling
- Provides a framework for predicting the probability and impact of extreme events.
- Can help with decision-making and risk management strategies.
- Dealing with EVT’s Implications
- Tactics include diversification, tail risk hedging, position sizing, stress testing, and cash buffers
Foundations of EVT
EVT Theory
EVT originated from the field of hydrology and subsequently expanded into finance and insurance.
The central premise is that while most statistical analyses focus on the average or typical cases, EVT is concerned with the rare, extreme cases.
It provides a framework to assess the probability of events that are more extreme than any previously observed.
Key Concepts
The theory is built around two main types of models:
- the Block Maxima Model and
- the Peak Over Threshold Model
The Block Maxima Model focuses on the maximum (or minimum) value observed in a given period.
The Peak Over Threshold Model considers all observations above a certain threshold.
Application in Finance
Risk Management
EVT quantifies the risk of extreme market movements, such as sharp market downturns.
It helps in calculating Value at Risk (VaR) and Expected Shortfall (ES), which are measures for risk assessment in financial institutions.
Portfolio Optimization
EVT can help optimize portfolios by assessing the risk of extreme losses.
This approach is especially relevant for tail-risk hedging strategies.
EVT Strategies
By integrating EVT’s insights, traders can better manage and mitigate the risks of rare but devastating market events.
Applying EVT typically informs strategies such as:
Diversification
Enhancing portfolio diversification by identifying assets or sectors less likely to experience extreme losses simultaneously.
We have many resources on this:
Tail Risk Hedging
Purchasing out-of-the-money (OTM) options or other derivatives as insurance against extreme market movements predicted by EVT.
Dynamic Position Sizing
Adjusting positions based on the estimated risk of extreme price movements.
This reduces exposure to assets with higher tail risk.
An example would be reducing your position sizes on long-duration assets (e.g., riskier equities).
Stress Testing
Conducting stress tests and scenario analyses on portfolios to understand potential losses in extreme market conditions.
Capital Allocation
Setting aside capital reserves (e.g., cash) based on the potential for extreme losses.
This ensures sufficient coverage for unexpected downturns.
Mathematical Framework
Distribution Models
The Generalized Extreme Value (GEV) distribution and the Generalized Pareto Distribution (GPD) are central to EVT.
GEV models the distribution of block maxima, while GPD is used in the Peak Over Threshold approach.
Statistical Estimation
EVT involves estimating the tail index or shape parameter, which determines the heaviness of the tail of the distribution.
Methods like the Hill estimator and maximum likelihood estimation are commonly used.
Extreme Value Theory (EVT) – Python Example
In this simplified model, the Python example illustrates how Extreme Value Theory (EVT) can be applied to understand the drawdowns in a stock using synthetic daily returns.
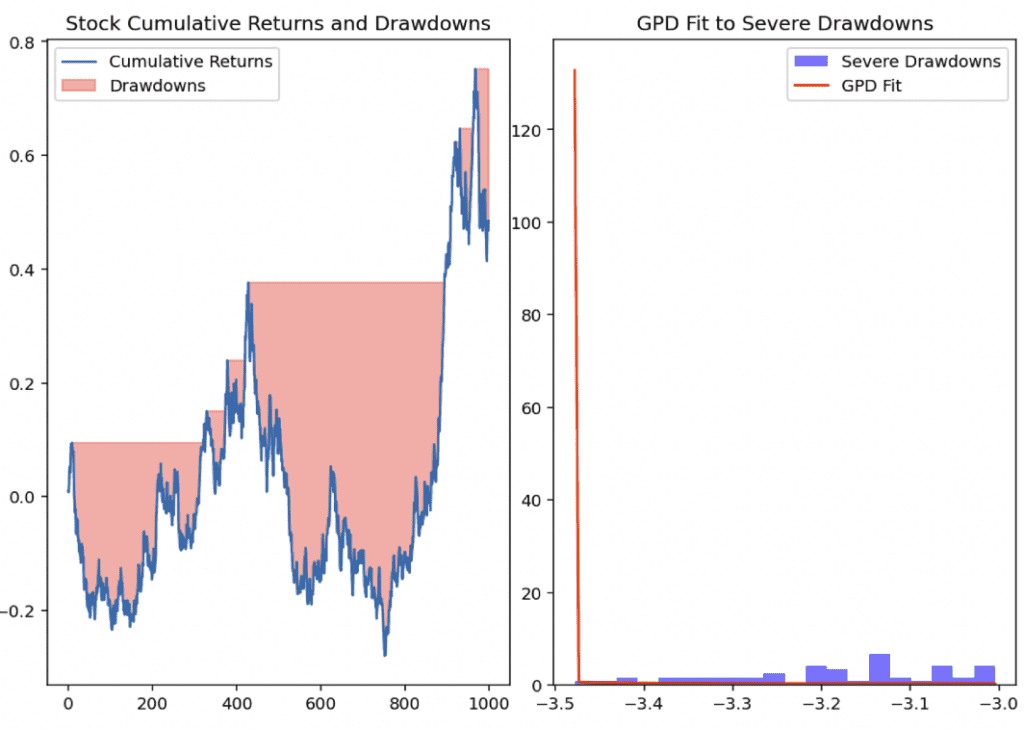
Stock Cumulative Returns and Drawdowns (left diagram below)
The first plot on the left shows the cumulative returns of a stock over time, with the shaded red areas indicating the periods of drawdown.
Drawdowns are calculated as the declines from the running maximum to the current value.
It represents periods where the stock’s price has fallen from its peak.
GPD Fit to Severe Drawdowns (right diagram below)
The second plot on the right focuses on the severe drawdowns, which are defined as the lowest 5% of all drawdowns in this example.
These severe drawdowns are modeled using the Generalized Pareto Distribution (GPD), shown by the red line.
The histogram represents the frequency of severe drawdowns.
The red line illustrates the GPD fit, which shows how well the model captures the tail behavior of extreme stock drawdowns.
This approach, focusing on severe drawdowns with GPD, offers a straightforward way to understand and model the tail risk associated with extreme negative movements in stock prices.
Source Code
import numpy as np
import matplotlib.pyplot as plt
from scipy.stats import genpareto

# Synthetic daily returns for a stock
np.random.seed(55)
daily_returns = np.random.normal(loc=0.0002, scale=0.02, size=1000) # Average daily return with volatility

# Cumulative returns for the stock
cumulative_returns = np.cumprod(1 + daily_returns) - 1

# Daily drawdowns as the decline from the maximum value to date
running_max = np.maximum.accumulate(cumulative_returns)
daily_drawdowns = (cumulative_returns - running_max) / running_max

# Filter for the most severe drawdowns (e.g., below the 5th percentile)
threshold = np.percentile(daily_drawdowns, 5)
severe_drawdowns = daily_drawdowns[daily_drawdowns < threshold]

# Fit GPD to the severe drawdowns
gpd_fit = genpareto.fit(-severe_drawdowns) # Note the negation as GPD is for excesses over the threshold

# Visualization
plt.figure(figsize=(12, 6))

# Now we plot cumulative returns & highlight drawdowns
plt.subplot(1, 2, 1)
plt.plot(cumulative_returns, label="Cumulative Returns")
plt.fill_between(range(len(cumulative_returns)), running_max, cumulative_returns,
where=(cumulative_returns < running_max), color='red', alpha=0.3, label="Drawdowns")
plt.title('Stock Cumulative Returns and Drawdowns')
plt.legend()

# Plot GPD fit to severe drawdowns
plt.subplot(1, 2, 2)
x_gpd = np.linspace(min(severe_drawdowns), max(severe_drawdowns), 100)
plt.hist(severe_drawdowns, bins=20, density=True, alpha=0.5, color='blue', label="Severe Drawdowns")
plt.plot(x_gpd, genpareto.pdf(-x_gpd, *gpd_fit), 'r-', label="GPD Fit")
plt.title('GPD Fit to Severe Drawdowns')
plt.legend()

plt.tight_layout()
plt.show()

Challenges & Limitations
Data Requirements
EVT requires a significant amount of data for accurate estimation of the tail behavior.
The rarity of extreme events is a challenge in collecting sufficient data.
Unlike the physical world, we don’t have a lot of data in finance, especially as it pertains to rare so-called black swan events.
We have only one run through history. And because market participants learn as time goes on, historical data might not be representative of how a future event is likely to play out.
Model Assumptions
The assumptions made in EVT models, such as independence and identical distribution of data points, may not always hold in real-world scenarios.
This can affect the accuracy of predictions.
EVT for Quants – Step-by-Step Implementation
To apply Extreme Value Theory (EVT), follow these specific steps:
1) Data Collection
Gather and preprocess relevant data.
Focus on extreme values such as maximum losses or gains.
2) Model Selection
Choose between:
- the Generalized Extreme Value (GEV) for block maxima or
- Generalized Pareto Distribution (GPD) for peaks-over-threshold models
Will be based on your data characteristics.
3) Threshold/Block Definition
- For GEV, divide data into blocks (e.g., yearly maxima).
- For GPD, define a high threshold to focus on extreme tails.
4) Parameter Estimation
Estimate the model parameters, often using maximum likelihood estimation or other methods like the Hill estimator.
5) Model Fitting and Validation
Fit the chosen model to the data and validate its performance using goodness-of-fit tests or backtesting with historical data.
6) Risk Assessment
Use the fitted model to assess and interpret the risk of extreme events.
Make informed decisions accordingly.
Conclusion
EVT helps in understanding and managing the risks associated with extreme events in finance.
Its application is in creating robust risk management frameworks and optimizing financial portfolios against extreme market movements.