CTA ETFs: Managed Futures for Public Investors

CTA ETFs, or systematic ETFs, offer retail and institutional investors access to managed futures strategies – typically the domain of hedge funds and institutional separate accounts – via a liquid, exchange-traded format.
These ETFs aim to replicate the core features of Commodity Trading Advisor (CTA) strategies: trend-following exposure across asset classes, long/short flexibility, and low correlation to traditional equity and bond portfolios.
They do so through systematic models that trade futures contracts on commodities, currencies, fixed income, and equity indices.
We’ll look at several of them in this article.
Key Takeaways – CTA ETFs
- CTA ETFs provide liquid, low-fee access to hedge-fund-style trend-following across asset classes.
- Summary of Key CTA ETFs:
- DBMF replicates institutional CTA positions;
- KMLM uses transparent, rules-based signals;
- CTA adds option-based volatility hedges;
- FMF applies a multi-factor quantitative model with muted trend exposure.
- Important to weigh signal type, asset coverage, fees, and responsiveness when choosing a CTA ETF.
- Other non-CTA ETFs from the “Alternatives” category explored.
- What are the long-run returns of these ETFs? We explain most likely outcomes (roughly 3-8% per year).
Key CTA ETFs and How They Differ
DBMF – iMGP DBi Managed Futures Strategy ETF
- Manager – Andrew Beer / Dynamic Beta Investments
- Approach – DBMF uses a replication strategy, estimating the aggregate positioning of the largest CTA hedge funds in the SG CTA Index. It then constructs a portfolio of liquid futures designed to mimic those exposures.
- Features – It offers broad, institutional-style managed futures exposure at a relatively low cost (~0.85% expense ratio), with full daily transparency. DBMF has gained popularity as an “alternative diversifier” in portfolios with stocks and bonds
KMLM – KFA Mount Lucas Managed Futures Index ETF
- Manager – KraneShares
- Approach – KMLM tracks the Mount Lucas Managed Futures Index, which applies a classic trend-following system across 11 commodity, currency, and interest rate futures using price signals like moving averages.
- Features – It is rules-based and long/short, with equal risk-weighted allocation across asset classes. It appeals to investors seeking a more traditional, signal-driven CTA exposure without hedge fund layers.
DBMF vs. KMLM
DBMF tries to replicate hedge fund positioning using regression analysis and factor mapping, while KMLM is a direct, transparent rules-based strategy.
DBMF changes positions monthly based on hedge fund activity. KMLM is faster-moving, adjusting as signals shift.
CTA – Simplify Managed Futures Strategy ETF
- Manager – Simplify Asset Management
- Approach – Uses a rules-based trend-following strategy, but overlays option-based hedges and tail-risk overlays to manage downside volatility.
- Features – Combines managed futures with volatility mitigation, which can appeal to advisors seeking smoother ride during volatile markets.
FMF – First Trust Managed Futures Strategy Fund
- Manager – First Trust
- Approach – Uses a proprietary quantitative model to determine long, short, or flat positioning across equities, rates, and commodities.
- Features – Tends to have more muted beta to trend-following indices. It’s a broader multi-factor model, not purely momentum-driven.
Best of the Rest
Other systematic trend ETFs that are available:
- AHLT – American Beacon AHL Trend ETF
- ASMF – Virtus AlphaSimplex Managed Futures ETF
- MFUT – Cambria Chesapeake Pure Trend ETF
- ROPE – Coastal Compass 100 ETF
- TFPN – Blueprint Chesapeake Multi-Asset Trend ETF
- WTFM – WisdomTree Managed Futures Strategy ETF
- FFUT – Fidelity Managed Futures ETF
AHLT – American Beacon AHL Trend ETF
AHLT is sub-advised by Man AHL, which is one of the largest institutional trend-following managers globally.
As is standard, AHLT trades futures across commodities, currencies, rates, and equity indices using systematic momentum signals.
What’s unique is its direct link to a long-running institutional CTA program.
So this gives access to a strategy with decades of live hedge fund implementation experience.
Expense ratio = 0.95%
Over its short history, it’s had higher correlations to equities and gold:
Asset Correlations
| Name | Ticker | AHLT | SPY | TLT | GLD | Annualized Return | Daily Standard Deviation | Monthly Standard Deviation | Annualized Standard Deviation |
|---|---|---|---|---|---|---|---|---|---|
| American Beacon AHL Trend ETF | AHLT | 1.00 | 0.39 | -0.26 | 0.47 | 8.09% | 1.13% | 4.48% | 15.52% |
| State Street SPDR S&P 500 ETF | SPY | 0.39 | 1.00 | 0.11 | 0.10 | 20.25% | 0.98% | 3.42% | 11.84% |
| iShares 20+ Year Treasury Bond ETF | TLT | -0.26 | 0.11 | 1.00 | 0.11 | 1.22% | 0.89% | 4.17% | 14.45% |
| SPDR Gold Shares | GLD | 0.47 | 0.10 | 0.11 | 1.00 | 47.09% | 1.24% | 4.12% | 14.28% |
| Asset correlations for time period 08/31/2023 – 02/20/2026 based on daily returns | |||||||||
ASMF – Virtus AlphaSimplex Managed Futures ETF
ASMF uses AlphaSimplex’s quantitative models, which emphasize adaptive trend signals and risk management.
It dynamically adjusts exposure as volatility changes, rather than just following fixed moving averages.
Its distinguishing feature is the academic foundation.
It blends trend-following with portfolio construction techniques that are designed to reduce whipsaw losses in choppy markets.
What are these techniques?
Though CTA funds can be a bit of a black box, the most likely are primarily volatility scaling, dynamic position sizing, cross-asset diversification, and signal smoothing.
Volatility scaling adjusts exposure based on recent market volatility. So positions shrink in unstable, noisy periods.
Dynamic position sizing reduces risk when signals weaken.
Cross-asset diversification spreads risk across commodities, currencies, rates, and equities to avoid overconcentration, which is standard.
Signal smoothing, such as using multiple lookback horizons or filtered momentum signals, helps prevent reacting to short-term reversals. This can cause whipsaw losses in sideways markets.
Expense ratio = 0.80%
Asset Correlations
| Name | Ticker | ASMF | SPY | TLT | GLD | Annualized Return | Daily Standard Deviation | Monthly Standard Deviation | Annualized Standard Deviation |
|---|---|---|---|---|---|---|---|---|---|
| Virtus AlphaSimplex Managed Futures ETF | ASMF | 1.00 | 0.49 | -0.11 | 0.53 | 3.29% | 0.69% | 2.45% | 8.47% |
| State Street SPDR S&P 500 ETF | SPY | 0.49 | 1.00 | 0.05 | 0.09 | 17.49% | 1.07% | 2.87% | 9.93% |
| iShares 20+ Year Treasury Bond ETF | TLT | -0.11 | 0.05 | 1.00 | 0.08 | 2.57% | 0.80% | 3.00% | 10.38% |
| SPDR Gold Shares | GLD | 0.53 | 0.09 | 0.08 | 1.00 | 53.10% | 1.37% | 4.02% | 13.93% |
| Asset correlations for time period 05/16/2024 – 02/20/2026 based on daily returns | |||||||||
MFUT – Cambria Chesapeake Pure Trend ETF
MFUT is managed by Chesapeake Capital, a well-known CTA founded by Jerry Parker, a “Turtle Trader.”
It focuses on pure price-based trend signals across global futures markets.
What makes it distinct is its commitment to classic, rules-based trend trading without overlays or volatility products. In short, it tries to stay faithful to traditional CTA methodology.
Expense ratio = 1.18%
Asset Correlations
| Name | Ticker | MFUT | SPY | TLT | GLD | Annualized Return | Daily Standard Deviation | Monthly Standard Deviation | Annualized Standard Deviation |
|---|---|---|---|---|---|---|---|---|---|
| Cambria Chesapeake Pure Trend ETF | MFUT | 1.00 | 0.38 | -0.04 | 0.50 | -6.25% | 0.85% | 3.98% | 13.80% |
| State Street SPDR S&P 500 ETF | SPY | 0.38 | 1.00 | 0.05 | 0.09 | 17.88% | 1.07% | 2.87% | 9.93% |
| iShares 20+ Year Treasury Bond ETF | TLT | -0.04 | 0.05 | 1.00 | 0.08 | 3.95% | 0.80% | 3.00% | 10.38% |
| SPDR Gold Shares | GLD | 0.50 | 0.09 | 0.08 | 1.00 | 55.55% | 1.37% | 4.02% | 13.93% |
| Asset correlations for time period 05/29/2024 – 02/20/2026 based on daily returns | |||||||||
ROPE – Coastal Compass 100 ETF
ROPE tracks an index that allocates among multiple managed futures managers or strategies rather than running a single in-house model.
This can diversify signal risk.
Instead of relying on one trend system, it spreads exposure across different systematic approaches.
Expense ratio = 0.80%
Asset Correlations
| Name | Ticker | ROPE | SPY | TLT | GLD | Annualized Return | Daily Standard Deviation | Monthly Standard Deviation | Annualized Standard Deviation |
|---|---|---|---|---|---|---|---|---|---|
| Coastal Compass 100 ETF | ROPE | 1.00 | 0.77 | 0.09 | 0.04 | 20.51% | 0.85% | 3.63% | 12.58% |
| State Street SPDR S&P 500 ETF | SPY | 0.77 | 1.00 | 0.11 | 0.06 | 13.31% | 1.18% | 3.00% | 10.40% |
| iShares 20+ Year Treasury Bond ETF | TLT | 0.09 | 0.11 | 1.00 | 0.02 | 3.26% | 0.74% | 3.00% | 10.40% |
| SPDR Gold Shares | GLD | 0.04 | 0.06 | 0.02 | 1.00 | 74.34% | 1.52% | 4.29% | 14.85% |
| Asset correlations for time period 12/18/2024 – 02/20/2026 based on daily returns | |||||||||
TFPN – Blueprint Chesapeake Multi-Asset Trend ETF
TFPN combines trend-following with broader asset allocation across equities, fixed income, and commodities.
It’s not strictly a pure managed futures product.
What sets it apart is its multi-asset orientation, blending traditional asset beta with systematic trend signals, which can make its return profile smoother but less explosive during strong trend cycles.
Expense ratio = 1.96%, which includes management fees, acquired fund fees, and expenses related to short positions
Asset Correlations
| Name | Ticker | TFPN | SPY | TLT | GLD | Annualized Return | Daily Standard Deviation | Monthly Standard Deviation | Annualized Standard Deviation |
|---|---|---|---|---|---|---|---|---|---|
| Blueprint Chesapeake Multi-Asst Trnd ETF | TFPN | 1.00 | 0.48 | -0.02 | 0.23 | 6.61% | 0.76% | 3.43% | 11.87% |
| State Street SPDR S&P 500 ETF | SPY | 0.48 | 1.00 | 0.13 | 0.11 | 19.97% | 0.97% | 3.38% | 11.70% |
| iShares 20+ Year Treasury Bond ETF | TLT | -0.02 | 0.13 | 1.00 | 0.13 | -0.11% | 0.90% | 4.13% | 14.30% |
| SPDR Gold Shares | GLD | 0.23 | 0.11 | 0.13 | 1.00 | 44.41% | 1.22% | 4.06% | 14.06% |
| Asset correlations for time period 07/12/2023 – 02/20/2026 based on daily returns | |||||||||
WTMF – WisdomTree Managed Futures Strategy ETF
WTMF applies a rules-based trend model across global futures with a relatively low expense ratio compared to peers.
It emphasizes diversification and balanced risk across asset classes.
Its distinguishing characteristic is cost efficiency combined with broad exposure.
WTMF is also less volatile than many CTA constructions, with less than half the volatility of the stock market.
It’s one of the more accessible options for investors focused on fee sensitivity.
Expense ratio = 0.66%
Asset Correlations
| Name | Ticker | WTMF | SPY | TLT | GLD | Annualized Return | Daily Standard Deviation | Monthly Standard Deviation | Annualized Standard Deviation |
|---|---|---|---|---|---|---|---|---|---|
| WisdomTree Managed Futures Strategy ETF | WTMF | 1.00 | 0.12 | 0.02 | 0.11 | 0.75% | 0.47% | 1.83% | 6.34% |
| State Street SPDR S&P 500 ETF | SPY | 0.12 | 1.00 | -0.28 | 0.04 | 13.84% | 1.08% | 4.03% | 13.95% |
| iShares 20+ Year Treasury Bond ETF | TLT | 0.02 | -0.28 | 1.00 | 0.22 | 2.54% | 0.94% | 3.92% | 13.56% |
| SPDR Gold Shares | GLD | 0.11 | 0.04 | 0.22 | 1.00 | 8.59% | 1.03% | 4.68% | 16.20% |
| Asset correlations for time period 01/05/2011 – 02/20/2026 based on daily returns | |||||||||
FFUT – Fidelity Managed Futures ETF
FFUT applies Fidelity’s quantitative models to trade futures across asset classes with a focus on trend and diversification.
It’s structured for integration into multi-asset portfolios.
Its key distinction is Fidelity’s large-scale portfolio construction expertise, which may prioritize smoother volatility characteristics rather than maximizing pure trend capture.
Expense ratio = 0.80%
Asset Correlations
| Name | Ticker | FFUT | SPY | TLT | GLD | Return | Daily Standard Deviation | Monthly Standard Deviation | Annualized Standard Deviation |
|---|---|---|---|---|---|---|---|---|---|
| Fidelity Managed Futures ETF | FFUT | 1.00 | 0.40 | -0.17 | 0.26 | 13.16% | 0.61% | 1.25% | 4.34% |
| State Street SPDR S&P 500 ETF | SPY | 0.40 | 1.00 | -0.02 | 0.08 | 16.69% | 0.69% | 1.78% | 6.15% |
| iShares 20+ Year Treasury Bond ETF | TLT | -0.17 | -0.02 | 1.00 | 0.04 | 6.62% | 0.61% | 2.06% | 7.12% |
| SPDR Gold Shares | GLD | 0.26 | 0.08 | 0.04 | 1.00 | 50.73% | 1.66% | 4.49% | 15.56% |
| Asset correlations for time period 06/05/2025 – 02/20/2026 based on daily returns | |||||||||
What to Consider When Choosing a CTA ETF
- Trend Replication vs. Direct Signals – Replicators like DBMF try to match institutional CTAs, while KMLM and CTA use first-principles signal generation and tend to follow trends more closely.
- Fees and Transparency – ETFs like DBMF and KMLM offer hedge-fund-like exposure with lower fees and daily holdings visibility.
- Market Coverage – Consider how many futures are used and how diversified the exposure is across commodities, currencies, rates, and equities.
- Rebalancing Frequency – More frequent signal updates may lead to higher responsiveness but also more trading costs.
Correlations to Traditional Asset Classes
CTA ETFs typically exhibit low to negative correlations with traditional asset classes such as stocks, nominal bonds, inflation-linked bonds, gold, and oil (as seen in the image below).
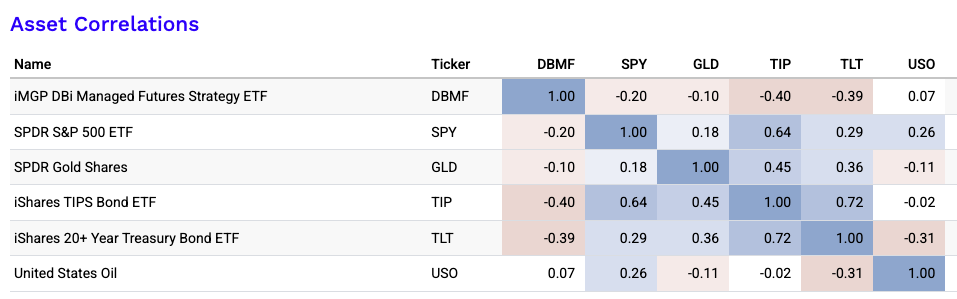
Correlations are not static.
Nonetheless, this decorrelation highlights their value as diversifiers, offering potential performance resilience during equity drawdowns, interest rate shocks, or inflationary disruptions.
Such uncorrelated return streams make CTA strategies attractive additions to multi-asset portfolios looking for risk-adjusted balance.
What Kind of Returns Do CTA ETFs Get Long-Term?
For this estimate, I’m going to use the two CTA ETFs I follow most closely (DBMF and CTA).
My best guess:
- DBMF: 5.5% to 7.5% annualized, net of fund fees, over a full cycle.
- CTA: 5.0% to 7.0% annualized, net of fund fees, over a full cycle.
My midpoint estimate would be about:
- DBMF: ~6.5%
- CTA: ~6.0%
Why I’d frame it that way:
Both funds are basically trying to monetize the same broad return engine: managed futures / trend-following across futures markets.
Academic work from AQR argues that managed futures returns are largely explained by time-series momentum.
Fees and trading costs are a major reason managers lag the raw underlying signal.
For the wrappers themselves:
- CTA’s goal is focused on the long-term capital appreciation via a systematic futures program (designed by Altis Partners); it launched in March 2022 and charges 0.75%. CTA is a more nimble construction than DBMF – i.e., it reacts to trend reversals faster.
- DBMF tries to replicate the pre-fee returns of the largest CTA hedge funds, and its pitch is explicitly that fee reduction and broad replication can improve investor outcomes versus paying hedge-fund economics; its ETF expense ratio is 0.85%.
So the economic intuition is:
long-run managed futures return ≈ collateral yield/cash yield + trend alpha − fees/costs
That matters because a lot of the long-run nominal return depends on cash yields themselves.
When T-bill yields are high, these funds can look much better.
When cash yields are near zero, expected nominal returns are lower even if the trend engine is unchanged.
Current medium-term assumptions are that cash yields and bond yields are higher than the 2021 lows. This supports better nominal return math than investors got in the zero-rate era.
So, to pin it down:
- In a normal long-run environment, I wouldn’t assume 9% to 10% type of long-run returns.
- I’d put them more at mid-single-digit nominal returns, with very uneven year-to-year delivery.
- As we’ve covered, the real value isn’t just return, but the fact that these strategies have historically had low correlation to traditional assets. They’ve often done best in extended market stress or strong macro trends.
They’re heavily about improving return/risk dynamics, which adds the second-order effect of being able to achieve higher returns off the same capital base for those engineering the portfolio to a specific risk level.
My cleanest practical assumption set would be:
- Conservative: 3% to 5%
- Base case: 5.5% to 6.5%
- Bullish: 7% to 8%
Between the two, I’d give DBMF a slightly higher expected-return estimate, but not by much.
The more important distinction is not return level. It is implementation style: DBMF is a replication product tied to the broad managed-futures hedge-fund complex, while CTA is an active systematic program from one manager stack.
Other ETFs with Low Correlation to Traditional Asset Classes
Here are several types of ETFs that often show low correlation to traditional asset classes like stocks and bonds, including arbitrage strategies and other alternative approaches:
The best…
Merger Arbitrage ETFs
- Example – ARB – AltShares Merger Arbitrage ETF
- How It Works – Invests in announced merger deals—long the target company, possibly short the acquirer—aiming to capture the spread.
- Correlation – Typically low correlation to both equities and fixed income because returns are driven by deal outcomes, not market direction.
Market Neutral ETFs
- Example – BTAL – AGFiQ US Market Neutral Anti-Beta ETF
- How It Works – Long low-beta stocks, short high-beta stocks. Seeks market neutrality by balancing exposure.
- Correlation – Very low correlation to market beta; often acts as a hedge during equity drawdowns.
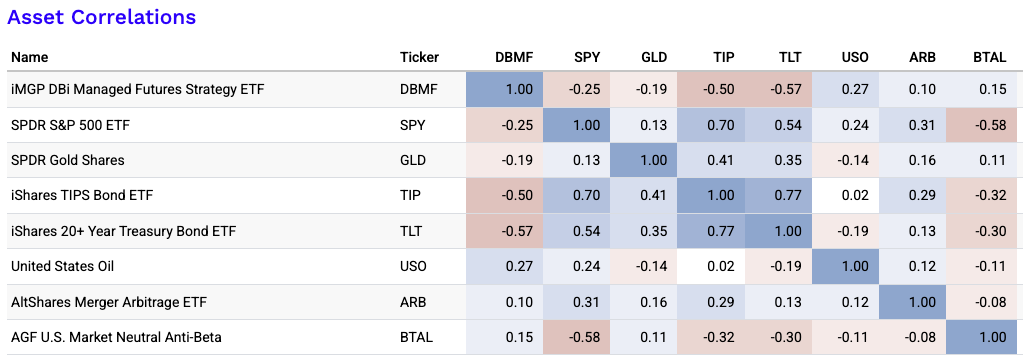
Our correlation matrix with ARB and BTAL added (past correlations not necessarily indicative of future correlations):
Only moderately…
Volatility Strategy ETFs
- Example – SVOL – Simplify Volatility Premium ETF
- How It Works – Uses VIX options or futures to capture volatility risk premium or hedge against volatility spikes.
- Correlation – Inverse or low correlation to equities – can spike in value when markets fall.
Options-Based or Hedged Equity ETFs
- Examples – JHEQX, PUTW, SWAN
- How It Works – Use options (puts, collars, etc.) to hedge downside risk or generate income.
- Correlation – Partial equity exposure with reduced beta and lower correlation during market stress. Not the best for diversification to equities, so can be overrated for this purpose.
And potentially…
Crypto Asset ETFs
- Examples – BITO (Bitcoin futures), ETHE (Ethereum trust)
- How It Works – Provide exposure to cryptocurrency price movements or blockchain ecosystems.
- Correlation – Correlation can shift, but often uncorrelated with traditional fixed income and only loosely correlated with equities.
Conclusion
CTA ETFs provide a compelling option for diversification, especially during macro dislocations or equity drawdowns.
By offering access to trend-following across asset classes, they bring institutional strategies to the retail shelf – liquid, transparent, and tax-efficient.
FAQs – CTA ETFs
What is the actual return engine here?
Naturally, CTA returns produce confusion because they’re unlike traditional investing.
What specifically is driving returns?
- Is it pure time-series momentum? (As investment shop AQR asserts)
- manager replication?
- multi-factor trend + carry + risk management?
- tail hedges or options overlays?
- collateral yield doing a lot of the work?
The actual return engine in CTA ETFs is usually a mix of collateral yield and systematic futures trading, with the exact balance depending on the fund.
The core driver for most is time-series momentum, meaning they go long rising markets and short falling ones across rates, currencies, commodities, and equity indices. Essentially anything liquid enough.
But not all CTAs do this the same way.
Some, like DBMF, rely more on manager replication. This means they try to mirror institutional CTA positioning.
Others use direct signals, sometimes blended with volatility scaling, carry, smoothing, or risk filters, like the CTA ETF (i.e., actual ticker CTA).
In some products, tail hedges or options overlays also affect returns, though often with some drag.
How crisis-reliable is the strategy?
Crisis reliability depends on the type of crisis.
CTA strategies have historically done best in extended, directional dislocations.
This includes moves like elongated equity selloffs, inflation shocks, or major rate trends.
In such caes, trends remain intact long enough to monetize.
They are less reliable in sharp V-shaped reversals or choppy, mean-reverting markets. In these cases, whipsaws can erode gains.
So they’re often useful crisis diversifiers, but certainly not going to give you a guaranteed hedge in every stress episode that can be thrown at you.
How much of the performance is structural beta versus true alpha?
A serious trader will want to separate:
- cash/collateral yield
- bond-duration effects
- commodity beta
- equity residual correlation
- actual trend-following skill or signal capture
Before committing, you’ll likely want to know how much return comes from true trend capture versus simpler embedded exposures.
Part of CTA ETF performance can come from cash or collateral yield, especially when short-term rates are high.
In some funds, this cash yield is distributed back to the trader toward the end of the year as a dividend.
Some also pick up bond-duration exposure, commodity beta, or a residual link to equities depending on positioning and construction.
The real question is what remains after stripping those out.
That remainder is the closest thing to true alpha: actual signal quality, position sizing skill, diversification, and efficient trend implementation.
How fast does it adapt, and what is the whipsaw cost?
Faster models can catch reversals sooner, but they usually suffer more whipsaw losses in choppy markets.
For example, the CTA ETF (relative to DBMF) is generally better at catching trends earlier because its more sensitive to trend-changing signals.
But the trade-off is that it’s more likely to be caught wrongfooted.
Slower models ride trends better, but often exit too late when conditions abruptly change.
What are the hidden exposures and implementation frictions?
Even when the strategy looks sound, results can be shaped by hidden exposures such as rates, commodities, gold, or residual equity beta.
The implementation also matters: fees (a big one), slippage, futures rolls, position concentration, collateral assumptions, replication error, and liquidity can all materially change realized outcomes vis-a-vis the stated strategy.
What portfolio role is it actually meant to have?
- Is it a crisis alpha allocation?
- an all-weather/risk parity/balanced beta diversifier?
- an inflation shock hedge?
- a bond substitute?
- a return-seeking alternative?
- or just a small satellite diversifier?
The portfolio role depends on the trader or investor’s objective.
But for most allocators CTA ETFs are best viewed as a diversifying return stream rather than a core holding.
They can serve as a crisis alpha sleeve in sustained macro dislocations, an inflation-shock hedge when commodity and rate trends persist, or an all-weather diversifier because they can go long or short across asset classes.
They’re usually less effective as a pure bond substitute.
For example, post-2008 and post-2020, bond yields were especially low, and this set off a widespread search for equity diversifiers that could replace bonds but with better yields.
But bonds are fundamentally different because their returns are relatively predictable.
CTA returns are heavily dependent on trend-following execution.
In most portfolios, the cleanest use is as a return-seeking alternative or modest satellite diversifier that improves the return-to-risk ratio of the portfolio.