Topology in Finance & Markets (Concepts & Applications)


Topology is a branch of mathematics focusing on the properties of space that are preserved under continuous transformations.
Like many forms of math, it’s increasingly finding applications in finance and markets.
This application comes from the ability of topological methods to analyze shapes and structures within data, which is relevant in understanding market dynamics and financial instruments.
Key Takeaways – Topology in Finance
- Topology in markets refers to the study of shapes and structures in financial data patterns.
- Applications of Topology in Markets
- Identifying market regimes – Uncovering hidden cyclical patterns and transitions in market behavior.
- Risk analysis – Detecting complex, non-linear relationships between assets to assess portfolio risk.
- Algorithmic trading – Enhancing strategies by understanding the topological characteristics of price movements.
- Challenges of Topology
- Topology is still a relatively new field in finance, and its applications are under development.
- The methods can be complex and require specialized knowledge.
- Interpreting the results of topological analysis can be challenging and requires careful consideration of the context.
- Example
- Below we provide a coding example of how you might think about using a topological financial model in financial contexts.
The Basics of Topological Analysis in Finance
Identifying Market Patterns
Topological analysis in finance involves studying the shapes and structures of financial data.
With topological methods, analysts can identify patterns and structures within market data that aren’t apparent through traditional statistical methods.
This includes understanding the interconnectedness of various financial instruments and how they evolve over time.
Continuity and Deformation
A key concept in topology is the idea of continuity and deformation.
In financial markets, this translates to understanding how changes in market conditions can lead to transformations in market behavior.
Topology helps in visualizing and analyzing these transformations.
Applications of Topology in Financial Markets
Some applications of topology in financial markets:
Network Analysis
Financial markets can be viewed as networks where assets, institutions, and market participants are nodes connected by relationships like ownership, trading, or information flow.
Topology helps analyze the structure of these networks.
It can help identify key players, clusters, and information pathways.
Risk Management
In risk management, topology assists in identifying complex relationships between various financial entities and instruments.
By understanding these relationships, financial institutions can better assess systemic risk and the impact of market movements on portfolios.
Time Series Analysis
Prices and returns of financial instruments exhibit complex patterns over time.
Topological data analysis (TDA) techniques – e.g., persistent homology – can extract hidden structures and relationships within these time series.
This can be used for anomaly detection, trend forecasting, and risk assessment.
Algorithmic Trading
In algorithmic trading, topological data analysis is used to detect patterns and trends in large datasets.
Traders use these insights to develop strategies that anticipate market movements.
Many quant traders use the same types of models and same data, which can lead to similar results and no “edge.”
Outperforming the mean dollar-weighted discounted line in markets isn’t easy.
Venturing into different forms of quantitative models and accurately modeling the cause-effect mechanics of markets can help provide an edge that nobody else has.
Portfolio Optimization
Topology can aid in optimizing portfolios.
This involves understanding the relationships between different assets and how changes in one can affect others.
Understanding these relationships can lead to more robust portfolio construction.
Specific Examples of Topology in Finance
With many forms of math, their applications to finance can be more theoretical and abstract, so let’s look at some substantive examples:
Topological Tail Dependence Theory
This theory uses topology to predict market volatility during turbulent times.
It identifies “persistent holes” in the network of relationships between assets, indicating potential weak spots and systemic risks.
Related
Persistent Homology for Market Regime Identification
This technique identifies different regimes or phases in the market based on the topological structure of asset returns.
This can be used for trend-following strategies or identifying potential turning points.
Topology in Portfolio Optimization (Risk Parity)
The risk parity or “all weather” approach likes to construct portfolios where there’s some form of:
- equal risk contribution either from the asset themselves or
- to construct a portfolio in such a way to make it insensitive to the economic environment (by balancing their environmental biases against each other)
This requires asset mapping.
Here’s how this might look on a 2D surface:
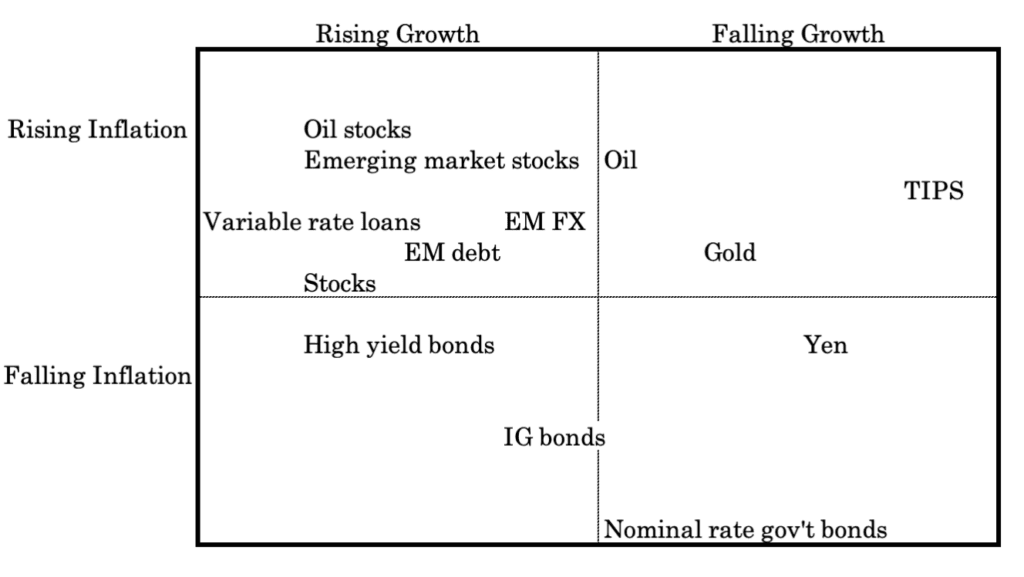
Topology can be used for asset mapping, especially when aiming to illustrate the sensitivity of different asset classes to factors like inflation, growth, risk premiums, and discount rates.
The conceptual framework of topology, which focuses on the properties of spaces that remain invariant under continuous deformations, provides a unique approach to visualizing and understanding complex financial landscapes.
Let’s look at how topology applies to asset mapping:
Continuity & Connectivity
Topology’s emphasis on continuity and connectivity can help identify how asset classes are interconnected and how they might respond similarly or differently to economic changes.
It can reveal clusters of assets that behave similarly (homotopy groups) or show how assets might transition from one state to another under economic stress or growth.
Mapping Sensitivities as Topological Spaces
Imagine the grid or space where each point represents an asset class, and the proximity between points reflects their sensitivity to inflation and growth in two dimensions and risk premiums and discount rates in other dimensions.
Topology can help analyze this space by focusing on the relationships and structural features of the grid without being bogged down by the precise distances or metric properties.
Identifying Invariant Properties
Through topological analysis, one could identify properties of asset classes or portfolios that remain invariant despite economic fluctuations.
For example, certain assets might consistently exhibit low sensitivity to inflation (e.g., short-term bonds or consumer staples stocks relative to tech stocks), serving as a “topological invariant” that can help in portfolio diversification.
Visualizing Complex Relationships
Topological data analysis (TDA) tools, like persistence homology, could be used to visualize and understand the complex relationships between asset classes and their sensitivities.
This can highlight the underlying structures and patterns that might not be apparent through traditional analysis.
Asset Class ‘Deformation’
By conceptualizing economic shocks or changes as “deformations” of the financial “space,” topology can offer insights into how asset classes might transform under different scenarios, and preserve some properties (like overall risk sensitivity) while altering others (like specific growth sensitivity).
Practical Implementation for Asset Mapping
Clustering and Classification
Use topological tools to cluster asset classes based on their sensitivities and risk profiles, which can help in portfolio construction and risk management.
Scenario Analysis
Apply topological concepts to simulate how asset sensitivities might change under various economic scenarios, which can be useful in stress testing and strategic planning.
Visualization
Employ TDA techniques to create visual representations of the financial landscape.
This can make it easier to communicate complex relationships and sensitivities to stakeholders.
Summary
While topology might not directly quantify the sensitivity of assets to inflation, growth, risk premiums, or discount rates, it provides a framework for understanding and visualizing the relationships and structural characteristics of asset classes in response to these factors (and others).
For quantification of geometric relationships, this falls under the purview of other fields, such as:
- Differential Geometry
- Symplectic Geometry
- Riemannian Manifolds
- Manifold Learning
- Differential Topology
- Geometric Mechanics
- Complex Analysis
Topological Data Analysis (TDA) in Finance
Machine Learning Integration
TDA is increasingly being integrated with machine learning models in finance.
This combination allows for more nuanced analysis of financial data.
They can help recognize complex patterns that traditional models might miss.
It can be useful for risk analysis, detecting market regimes, or identifying non-linear correlations between assets.
Predictive Modeling
TDA contributes to predictive modeling in finance by providing a framework to analyze historical data.
This helps in forecasting market trends and asset price movements with a higher degree of accuracy.
Nonetheless, applying historical data to the future has risk given the future can deviate from the past.
Portfolio Optimization and Correlations
For TDA, in a real-world scenario, we would analyze historical price data of the assets in a portfolio using TDA tools like persistent homology.
This could help uncover hidden structures and correlations.
Topological Data Analysis (TDA) Coding Example
We’ll analyze this portfolio that we’ve also looked at in other ways in other articles (example):
- 40% Stocks: +6% forward return, 15% annualized volatility using standard deviation
- 45% Bonds: +4% forward return, 10% annualized volatility using standard deviation
- 5% Commodities: +3% forward return, 15% annualized volatility using standard deviation
- 10% Gold: +3% forward return, 15% annualized volatility using standard deviation
To generate synthetic data for the portfolio and then use Topological Data Analysis (TDA) to uncover hidden structures and correlations, we’ll follow these steps:
Generate Synthetic Data
We’ll simulate daily returns for each asset class (stocks, bonds, commodities, gold) based on the given expected forward returns and volatilities.
For simplicity, we’ll assume a normal distribution of returns.
Create a Combined Portfolio Time Series
We’ll combine these returns into a portfolio time series based on the specified weights.
Apply TDA
We’ll use a TDA technique, such as persistent homology, to analyze the time series data.
TDA is great for capturing the shape of the data, which can reveal hidden structures not easily seen with traditional statistical methods.
Given the complexity of TDA and the need for specialized libraries, we’ll focus on generating the synthetic data and providing an overview of how TDA might be applied in this context.
For the TDA analysis, we’ll describe the conceptual approach, as performing TDA would require a more specialized setup than what we’re doing here for illustrative purposes.
How TDA Can Be Applied
Construct a Point Cloud
Transform the time series data into a high-dimensional point cloud.
Each point in this cloud could represent the state of the portfolio at a given time.
This encompasses information such as returns and volatilities of each asset.
Apply Persistent Homology
Use persistent homology (a key tool in TDA) to analyze the shape of the data.
This involves constructing a series of simplicial complexes (geometric representations) at various scales and tracking how features like loops and voids appear and disappear.
These features represent the underlying structure and relationships in the data.
Interpret the Results
The persistence of certain topological features can indicate strong relationships or patterns in the data.
For instance, a persistent loop might suggest a recurring regime or cycle in the portfolio’s performance.
Correlation Insights
By examining how these topological features relate to individual assets, we could potentially uncover non-linear correlations that aren’t evident through traditional correlation analysis.
Note that this is Python code:
import pandas as pd
import numpy as np

# Parameters

n_days = 252  # Trading days in a year
years = 5  # Sim data for 5 years
total_days = n_days * years

# Asset characteristics

asset_weights = np.array([0.40, 0.45, 0.05, 0.10])  # Weights for Stocks, Bonds, Commodities, Gold
asset_returns = np.array([0.06, 0.04, 0.03, 0.03])  # Annual expected returns
asset_volatility = np.array([0.15, 0.10, 0.15, 0.15])  # Annual standard deviation

# Synthetic daily returns for each asset

np.random.seed(78)
daily_returns = np.random.normal(asset_returns / n_days, asset_volatility / np.sqrt(n_days), (total_days, 4))

# Convert to DataFrame for easier manipulation

daily_returns_df = pd.DataFrame(daily_returns, columns=['Stocks', 'Bonds', 'Commodities', 'Gold'])

# Daily returns

portfolio_daily_returns = daily_returns_df.dot(asset_weights)

# Display the first few rows of the synthetic daily returns

daily_returns_df.head(), portfolio_daily_returns.head()
This code gives us daily returns data for each asset:
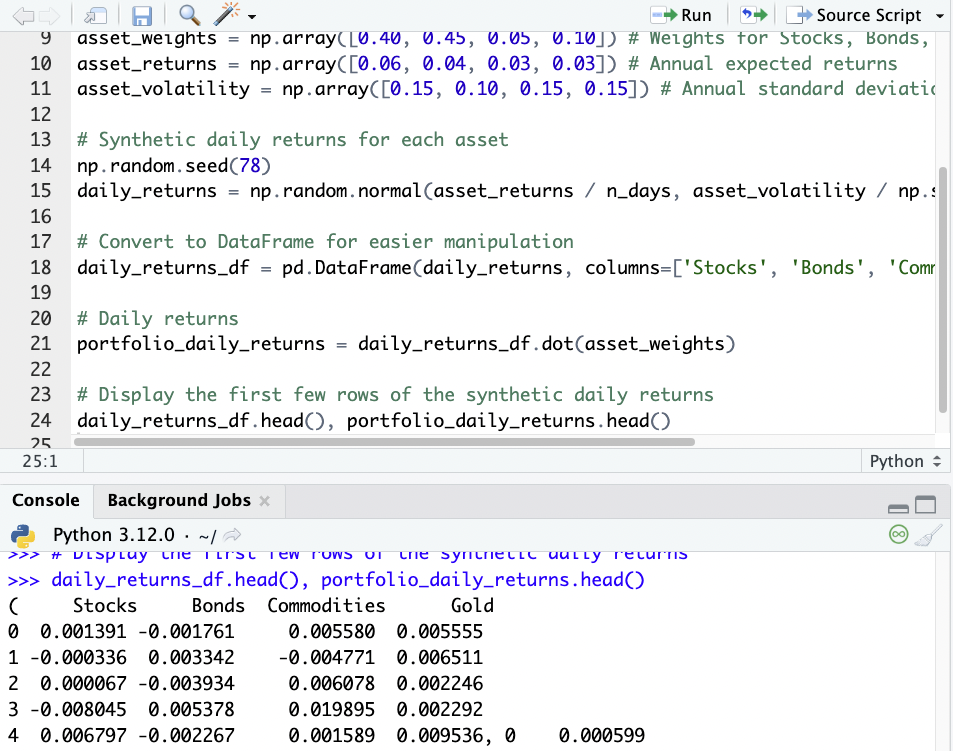
In a real-world scenario, this analysis would require specialized TDA programs and libraries – GUDHI, Ripser, or Dionysus – and a deep understanding of topological concepts.
The results could provide unique insights into the portfolio’s structure, to inform risk management and trading/investment strategies.
Plotting Correlations
Let’s plot some correlations so we have a visual.
This is two steps:
1) Calculate Rolling Correlation
We’ll compute the rolling correlation of the asset returns over a specified window (e.g., 30 days) to see how correlations change over time.
2) Plot the Rolling Correlation
Then visualize these correlations in a graph.
import matplotlib.pyplot as plt

# Rolling correlation
rolling_correlation = daily_returns_df.rolling(window=30).corr().dropna()

# Rolling correlations for each pair of assets
rolling_corr_stocks_bonds = rolling_correlation['Stocks']['Bonds'][::4] # Every 4th entry to avoid duplicates
rolling_corr_stocks_commodities = rolling_correlation['Stocks']['Commodities'][::4]
rolling_corr_stocks_gold = rolling_correlation['Stocks']['Gold'][::4]

# Plotting
plt.figure(figsize=(12, 6))
plt.plot(rolling_corr_stocks_bonds, label='Stocks-Bonds')
plt.plot(rolling_corr_stocks_commodities, label='Stocks-Commodities')
plt.plot(rolling_corr_stocks_gold, label='Stocks-Gold')
plt.xlabel('Days')
plt.ylabel('Rolling Correlation')
plt.title('30-Day Rolling Correlation of Asset Returns')
plt.legend()
plt.grid(True)
plt.show()
The plot shows the 30-day rolling correlation of asset returns between Stocks and Bonds, Stocks and Commodities, and Stocks and Gold over the simulated period.
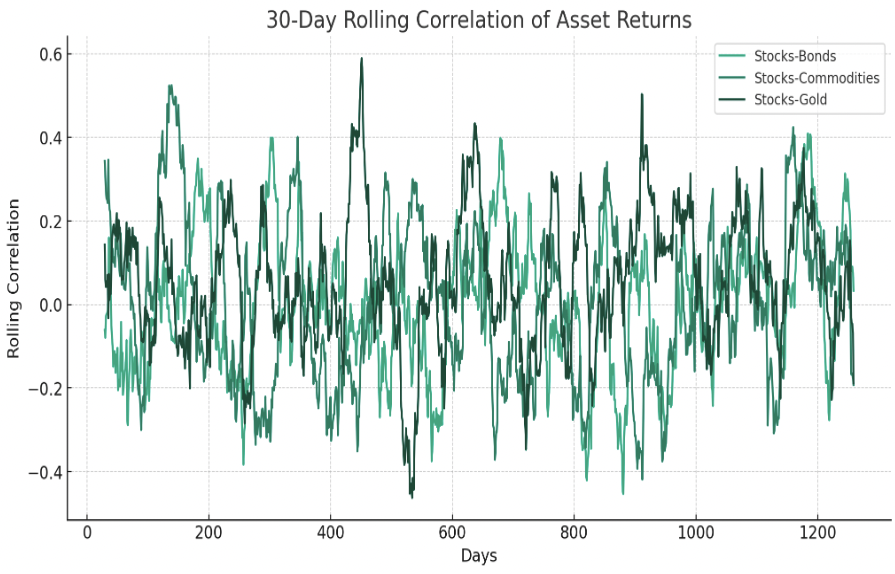
If there’s one take-home from this (even though it’s synthetic data) is that correlations can change rapidly over time.
Reliance on historical correlations to inform future correlations is generally not a good idea when the future can be different from the past.
TDA Visualizations
For TDA visualizations, one common approach is to create persistence diagrams or barcodes that represent the birth and death of topological features (like loops or holes) as one “scans” through the data.
Regarding TDA visualizations, specific tools and libraries are required to create them.
Nonetheless, here’s a conceptual overview of what such visualizations might entail:
Persistence Diagrams or Barcodes
These would show the birth and death of topological features (like loops or voids) in the data as we vary a parameter (like a distance threshold).
These features can reveal hidden structures in the data, such as cyclical patterns or clusters.
Mapper Algorithm Visualizations
The mapper algorithm is a popular TDA tool that creates a simplicial complex (a network-like structure) from high-dimensional data.
It can reveal the overall shape and structure of the data.
This shows how different states of the portfolio are connected or isolated.
Dimensionality Reduction with TDA
Techniques like t-SNE or UMAP, integrated with TDA insights, can create plots that reveal clusters and continuities in the data, which are indicative of underlying dynamics.
Such analyses would require a deep dive into the specific characteristics of the assets and the portfolio.
This could potentially reveal non-obvious insights that could be used for risk management and strategic decision-making.
These techniques are about forging new paths in financial analysis and can offer a unique perspective compared to traditional statistical methods.
Challenges & Future Directions
Complexity and Interpretation
One of the challenges in applying topology in finance is the complexity of topological models and the difficulty in interpreting the results.
There’s a need for tools and methodologies that make topological analysis more accessible and interpretable.
Integration with Traditional Models
Integrating topological methods with traditional financial models presents both challenges and opportunities.
This integration can lead to more comprehensive models that capture both linear and non-linear dynamics of financial markets.
Ongoing Research
There is ongoing research in exploring new applications of topology in finance, particularly in areas like high-frequency trading, where traditional financial models aren’t relevant.
Conclusion
The application of topology in finance and markets is a growing field that offer new insights into market data and financial instruments.
Through topological analysis, financial professionals can gain a deeper understanding of complex market behaviors and improve their decision-making processes.
Article Sources
- https://www.sciencedirect.com/science/article/pii/S0378437117309202
- https://pubsonline.informs.org/doi/abs/10.1287/mnsc.2021.3984
- https://www.sciencedirect.com/science/article/pii/S095741742030676X
The writing and editorial team at DayTrading.com use credible sources to support their work. These include government agencies, white papers, research institutes, and engagement with industry professionals. Content is written free from bias and is fact-checked where appropriate. Learn more about why you can trust DayTrading.com