Differential Topology in Finance, Markets & Trading


Differential topology is a field of mathematics concerned with the study of differentiable functions and differentiable manifolds.
It has several key concepts that can be theoretically and practically applied to finance and markets, mostly in the form of advanced visual data interpretation.
Key Takeaways – Differential Topology in Finance, Markets & Trading
- Model Flexibility
- Differential topology helps model complex financial instruments and market dynamics.
- Accommodates non-linear and intricate relationships.
- Risk Surface Analysis
- Enables a deeper understanding of risk landscapes.
- Advanced Data Interpretation
- Offers sophisticated methods for interpreting high-dimensional financial data.
- Reveals insights that standard models might miss.
- Topological data visualization can be useful for exploring complex financial datasets in a more intuitive way.
- Coding Examples
- We do some coding examples below.
Key Concepts in Differential Topology in Finance, Markets & Trading
Let’s explore some of these concepts and their potential applications:
Manifolds
In differential topology, a manifold is a space that locally resembles Euclidean space.
Financial markets can be thought of as manifolds, where each point on the manifold represents, e.g., a state of the market or portfolio defined by various parameters.
Understanding the manifold structure of markets can aid in understanding how different market conditions or combinations of assets are interconnected.
Tangent Spaces and Vectors
At each point on a manifold, there is a tangent space, a vector space consisting of the tangent vectors at that point.
In finance, tangent vectors could represent possible directions or changes in the market at a given point in time, such as price movements or changes in volatility.
Differential Forms and Integration
Differential forms extend the concept of functions and integrals to higher dimensions.
They can be used in finance for complex integrations over financial manifolds, like integrating a portfolio’s return probability distribution over different market conditions.
Vector Fields and Flows
A vector field assigns a tangent vector to each point on a manifold, representing a direction.
In finance, a vector field could model the direction in which a market is moving under various forces, like economic indicators or sentiment.
Understanding these fields can help in predicting market trends or in algorithmic trading strategies.
Morse Theory
Morse theory studies the topology of manifolds using smooth functions.
In finance, Morse theory could be used to analyze market data topologies.
This can identify critical points – like the optimization of risk-return in a portfolio or extreme concentration of risk – and understand how different asset allocation decisions transition between these points.
In risk-return frameworks, steep points generally show areas of higher portfolio risk or sensitivity to changing economic conditions (e.g., blue region below), while flatter regions generally represent asset allocations where the portfolio is less sensitive to changes in market conditions (e.g., yellow region).
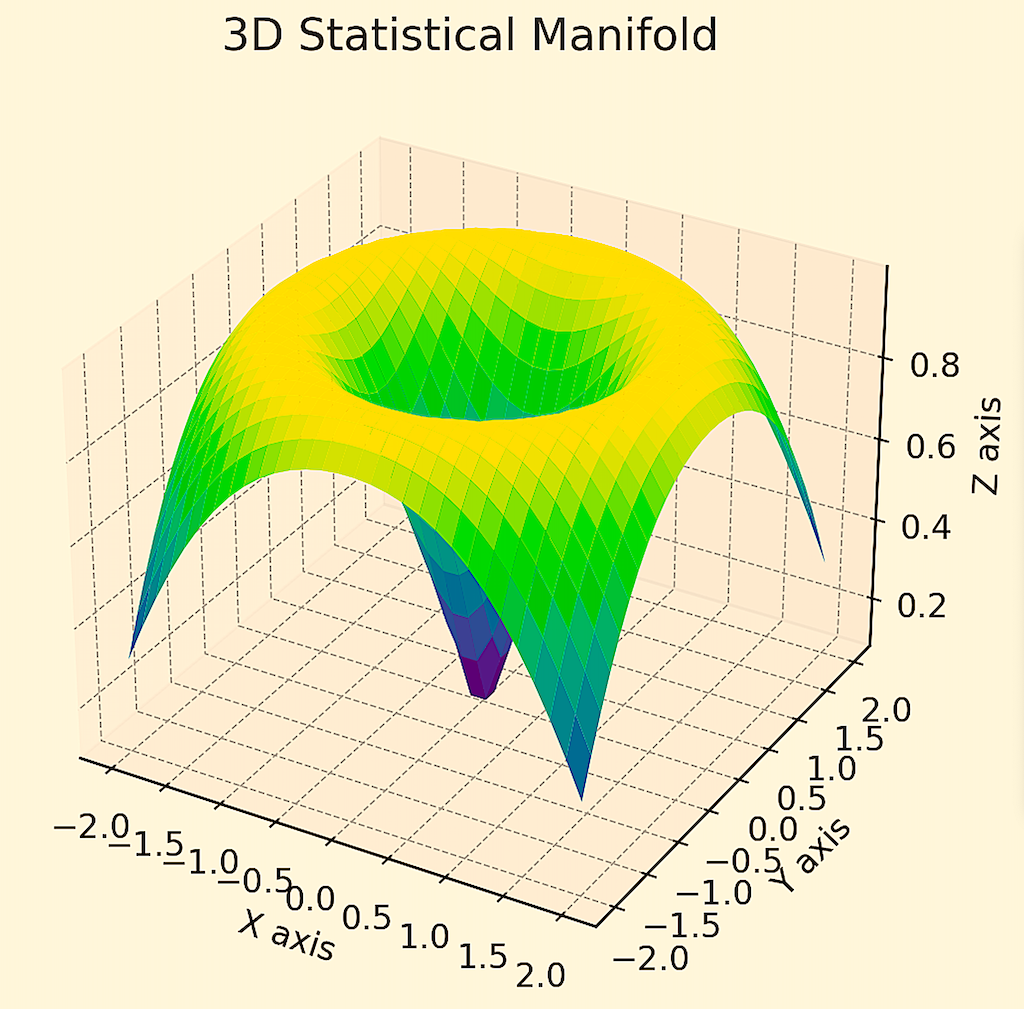
When financial/market data is shown in a geometric or topological sense, it generally favors the idea of diversifying and not being so dependent on one return stream in a portfolio – and making sure the returns streams are truly differentiated/uncorrelated.
Stable and Unstable Manifolds
These concepts are used in understanding the behavior of dynamic systems near equilibrium points.
In financial markets, they can be applied to study the stability of market equilibria and how markets react to perturbations, such as economic shocks or policy changes.
Homology and Homotopy
These are methods in topology used to classify and analyze the shapes of spaces.
- Homology – Measures and analyzes topological spaces’ shapes and connectivity.
- Homotopy – Studies continuous deformations between topological spaces (i.e., how shapes smoothly morph into each other).
In finance, they could theoretically be used to analyze and classify different market regimes, asset allocations, and trading/investment strategies to understand their fundamental characteristics and differences.
Fiber Bundles and Connections
These concepts deal with ways to systematically “glue together” various manifolds.
In markets, they could be used to describe the interconnection of different financial markets or instruments and how changes in one area can influence another.
Applications of Differential Topology in Trading
The connection may not be immediately obvious, as differential topology is a highly abstract field, but its concepts can be applied to model and understand complex financial systems and instruments.
Here are a few ways it’s applied:
Modeling of Financial Markets & Instruments
Differential topology can be used to model the complex structure of financial markets and instruments.
For instance, the concept of a manifold can be useful in understanding the multidimensional nature of financial markets, where each dimension represents a different aspect or variable of the market, like growth, inflation, discount rates/interest rates, risk premia.
Risk Management & Portfolio Optimization
In risk management and portfolio optimization, the geometric and topological aspects of differential topology can be used.
For example, the curvature of a manifold could represent the risk profile of a portfolio, where the aim is to navigate this manifold in a way that optimizes returns while minimizing risks.
Market Dynamics & Behavioral Analysis
For instance, the behavior of market participants and the evolution of asset prices over time can be modeled as dynamic systems on manifolds.
This allows for the study of their stability and changes under different conditions.
Algorithmic & Quantitative Trading
In algorithmic trading, differential topology can be used to model and predict market movements and to develop trading strategies.
Techniques from differential topology can help in understanding the structure of financial data and designing algorithms to take advantage.
Financial Derivatives Pricing
In the pricing of complex financial derivatives, the geometrical aspects of differential topology can be useful.
For example, understanding the topology of the space of possible paths that an underlying asset’s price can take can help in better modeling and pricing of derivatives.
Stress Testing & Scenario Analysis
Differential topology can be used in stress testing and scenario analysis by providing a framework to understand how different market conditions or external factors can affect the financial system.
Understanding Market Crises
Differential topology can understand the structure and dynamics of financial crises and market anomalies by helping model the complex interactions and feedback loops that are often present in such situations.
Differential Topology vs. Differential Geometry in Markets
Differential Topology focuses on the qualitative properties and “global features” of geometric structures.
It looks into the shape and connectivity of financial markets without concerning specific metrics.
It’s valuable for understanding topological data analysis and market patterns.
Differential Geometry, on the other hand, looks into the quantitative aspects of these structures, like curvature and angles.
It offers precise ways for modeling market trajectories, risk curvature, and asset price movements.
While topology offers a broad, qualitative view, geometry provides a detailed, quantitative framework, both essential for comprehensive financial analysis and strategy development in trading and markets.
Differential Topology vs. Algebraic Topology
Differential Topology is primarily used for modeling and understanding smooth, continuous market dynamics.
It helps in visualizing and analyzing market trends and patterns over continuous time or fluid surfaces (surfaces could represent the topology of market/financial/economic data).
Algebraic Topology is useful for analyzing complex financial networks and relationships.
It helps in understanding the overall structure and connectivity of financial systems, such as how different financial entities are interlinked or the robustness of financial networks.
Related: Topology
Coding Example – Differential Topology in Markets
Creating a manifold in the context of differential topology using Python requires generating (in this case) a synthetic dataset that represents a high-dimensional space.
In financial markets, this could be akin to simulating a set of financial indicators or asset prices and all the influences that affect their output over time.
We’ll use NumPy to create this synthetic data and then visualize a lower-dimensional representation of it, which can be thought of as a simplified “manifold.”
For this example, let’s simulate data for a hypothetical market scenario using a multi-dimensional Gaussian distribution.
Then we’ll use t-SNE (t-Distributed Stochastic Neighbor Embedding), a manifold learning technique, to visualize the high-dimensional data in a two-dimensional space.
t-SNE is useful in capturing the local structure of high-dimensional data and embedding that structure in lower dimensions.
Here’s some Python code to achieve this:
Example #1
import numpy as np
import matplotlib.pyplot as plt
from sklearn.manifold import TSNE

# Generate synthetic high-dimensional market data
np.random.seed(56)
n_samples = 1000
n_features = 50 # Number of features to simulate complex market scenario
data = np.random.normal(0, 1, (n_samples, n_features))

# Apply t-SNE for manifold learning
tsne = TSNE(n_components=2, perplexity=30, n_iter=300)
data_2d = tsne.fit_transform(data)

# Visualizing the manifold
plt.figure(figsize=(10, 6))
plt.scatter(data_2d[:, 0], data_2d[:, 1])
plt.title("2D Visualization of a High-Dimensional Synthetic Market Manifold")
plt.xlabel("Dimension 1")
plt.ylabel("Dimension 2")
plt.show()
Example #2
from sklearn.decomposition import PCA

# Apply PCA for dimensionality reduction
pca = PCA(n_components=2)
data_2d_pca = pca.fit_transform(data)

# Visualizing the manifold with PCA
plt.figure(figsize=(10, 6))
plt.scatter(data_2d_pca[:, 0], data_2d_pca[:, 1])
plt.title("2D Visualization of a High-Dimensional Synthetic Market Manifold using PCA")
plt.xlabel("Principal Component 1")
plt.ylabel("Principal Component 2")
plt.show()
This is plotted in the section below.
2D Representation
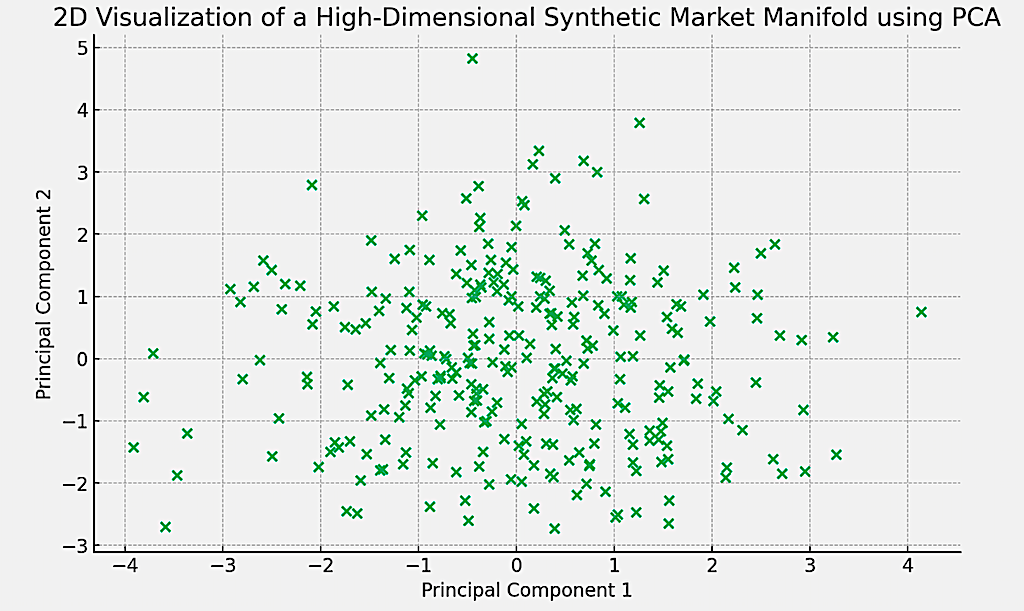
Above is the 2D visualization of the high-dimensional synthetic market data using PCA (Principal Component Analysis).
Each point in the graph represents an observation from the original high-dimensional space projected onto the first two principal components.
This visualization can help in identifying patterns or clusters in the data, and provide information on the structure of the synthetic market scenario.
3D Representation
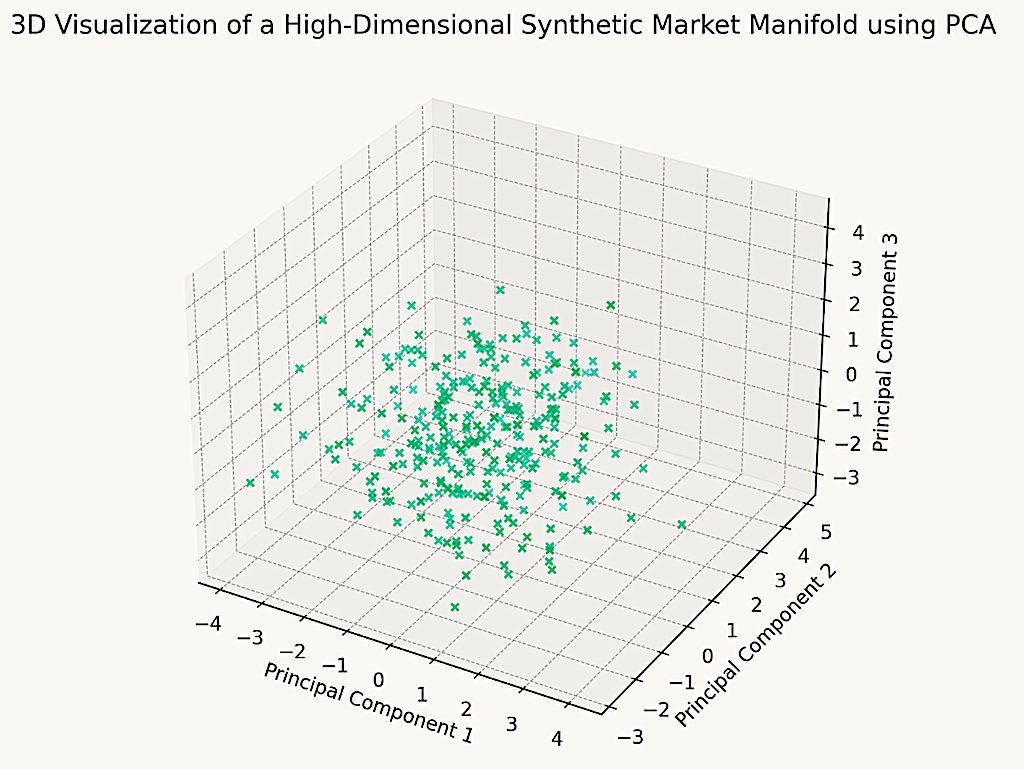
Here is the 3D visualization of the high-dimensional synthetic market data using PCA (Principal Component Analysis).
This plot represents the projection of the original data onto the first three principal components.
It provides a more nuanced view of the data structure, and potentially reveal clusters, trends, or relationships that might not be apparent in lower-dimensional representations.
The code for this is below (it uses the same libraries as listed in the above code):
# PCA for 3D dimensionality reduction
pca_3d = PCA(n_components=3)
data_3d_pca = pca_3d.fit_transform(data)

# Visualize the manifold in 3D
fig = plt.figure(figsize=(10, 8))
ax = fig.add_subplot(111, projection='3d')
ax.scatter(data_3d_pca[:, 0], data_3d_pca[:, 1], data_3d_pca[:, 2])

ax.set_title("3D Visualization of a High-Dimensional Synthetic Market Manifold using PCA")
ax.set_xlabel("Principal Component 1")
ax.set_ylabel("Principal Component 2")
ax.set_zlabel("Principal Component 3")
plt.show()
Conclusion
While these applications are theoretically possible, the practical application of differential topology in finance requires a deep understanding of both advanced mathematics and financial theory.
The field is more commonly used in academia and theoretical research rather than in day-to-day trading or financial decision-making.
Nonetheless, more “pure math” is being applied in quantitative finance and financial algorithms over time to forge new paths and gain a trading edge.