Differential Geometry in Finance, Trading & Markets


Differential geometry is a field of mathematics dealing with smooth shapes and the properties of surfaces and curves.
It has applications in financial markets and trading, mostly in risk management, portfolio optimization, and options pricing models.
Its value in these areas stems from its ability to model and analyze complex, multi-dimensional and non-linear relationships (while also providing a visual element).
Key Takeaways – Differential Geometry
- Differential geometry is a field of mathematics that uses calculus and algebra to study the geometry of curves and surfaces and can have value for quantitative traders.
- Understanding Market Dynamics through Manifolds
- Understanding the curvature and topology of manifolds representing financial data can help traders to identify unknown patterns or relationships between assets.
- Risk Management & Portfolio Optimization
- Differential geometry can help optimize portfolios in a curved space, which is more reflective of real-world financial markets as opposed to the flat space assumed in traditional linear models.
- This approach takes into account the non-linearities and complexities of markets/financial data.
- Advanced Derivatives Pricing & Hedging Strategies
- Differential geometry has value for modeling and understanding complex financial instruments (particularly derivatives).
- The geometric approach can offer deeper insights into their behavior under various market conditions.
- This can help develop effective pricing models and hedging strategies, mostly for options and other instruments whose values depend on multiple underlying variables.
Differential Geometry Concepts in Finance
Differential geometry, at its core, involves the study of smooth shapes and the rates at which quantities change.
In finance, this mathematical discipline can be applied to the curvature and topology of the manifold of trading/investment portfolios or probability distributions.
This approach can offer a better understanding of the risk-return profile of different financial instruments or portfolios.
Here are some key concepts where differential geometry might be used in finance:
Curvature and Market Dynamics
In differential geometry, curvature measures how a curve deviates from being a straight line, or a surface from being a plane.
In finance, this concept can be applied to understand the “curvature” (i.e., non-linearity and multi-dimensionality) of financial data.
Manifolds in Portfolio Optimization
Manifolds are spaces that locally resemble Euclidean space and can be used to represent complex financial instruments or portfolios.
In portfolio optimization, manifolds can represent the set of all possible portfolio combinations.
Tools from differential geometry, like tangent spaces and geodesics, can help find the optimal path or portfolio mix that maximizes returns for a given level of risk.
For example, say you have a 5-asset portfolio (assume all uncorrelated, all same return and same risk) where you’re trying to figure out how to get the most return for the level of risk you’re taking on.
Differential geometry can help show the shape of this optimization exercise via a manifold.
In this case, concentrating everything into just one asset is riskiest (i.e., the blue part of the manifold at the tip where it’s steepest) and spreading it among all five gets the highest return-to-risk ratio (the yellow, flat part of the surface).
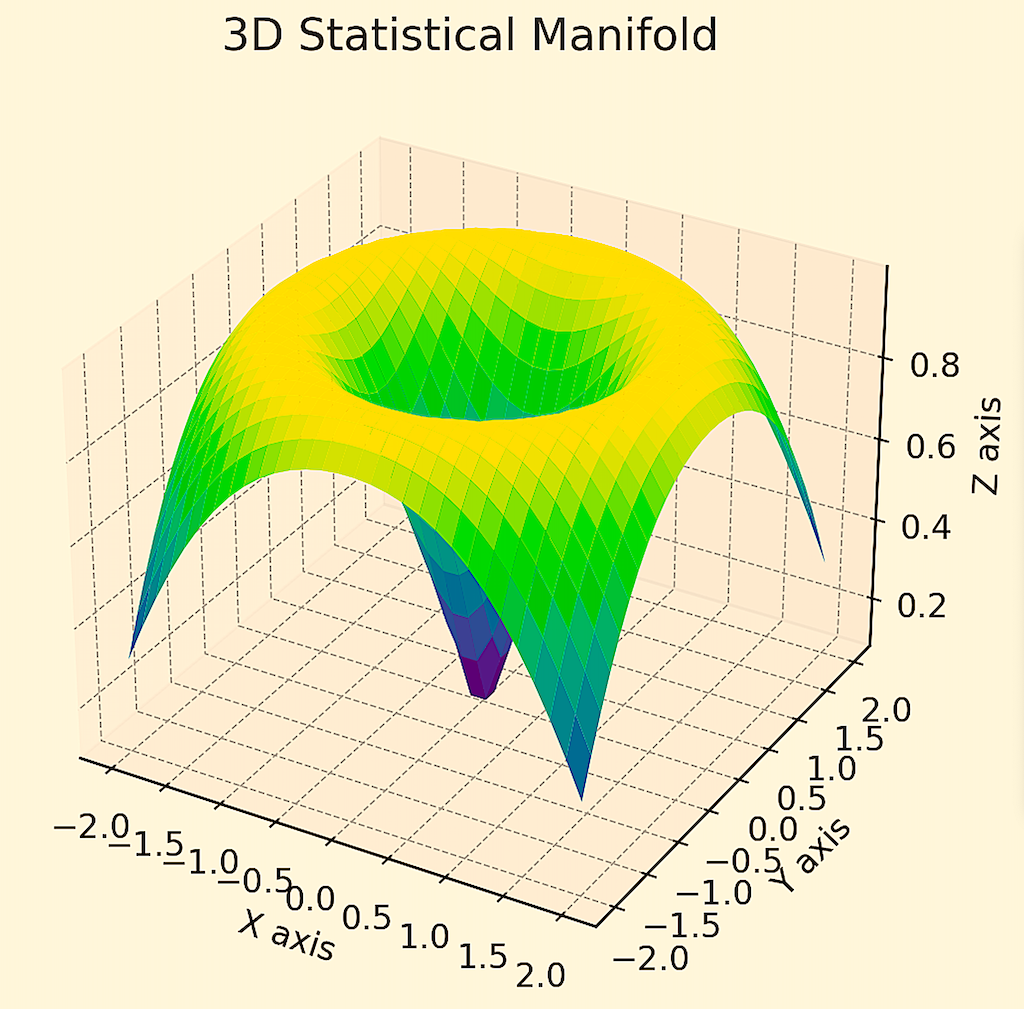
We showed a 2D curve of this data in a separate article.
Geometric Brownian Motion in Option Pricing
Used notably in the Black-Scholes model for option pricing,
Geometric Brownian Motion is a continuous-time stochastic process where the logarithm of the variable follows a Brownian motion (a random walk).
Differential geometry provides a way to analyze such stochastic processes, which are used in understanding and predicting price movements of derivatives.
Risk Metrics and Hypersurfaces
Risk metrics like Value at Risk (VaR) and Conditional Value at Risk (CVaR) can be represented as hypersurfaces in a multi-dimensional space where each dimension represents a different asset or risk factor.
Differential geometry allows for more sophisticated analysis of these hypersurfaces.
This can help with understanding the structure and behavior of risks in a portfolio.
Fiber Bundles in Financial Networks
Fiber bundles, structures that consist of a “base” space and “fibers” at each point of the base space, can be used to model financial networks.
Each node (e.g., a financial institution) is a point in the base space, and the fibers represent the state or behavior of that node.
This approach helps in understanding systemic risk and the interconnectedness of financial entities.
Optimal Transport Theory
This field, which has roots in differential geometry, involves optimizing the movement of resources (like goods or commodities) and is relevant in cost minimization strategies.
It also has applications in model calibration and in measuring distances between probability distributions, which is useful in risk management.
Differential Topology in Algorithmic Trading
In algorithmic trading, differential topology can be applied to analyze the structure of financial market data and to design algorithms that adapt to changing market conditions.
The study of the topology of price movement patterns may uncover insights into market behavior.
Moments and Cumulants of Probability Distributions
Moments (like mean, variance, skewness, kurtosis) are quantitative measures that describe the shape of a probability distribution.
Cumulants, related to moments, provide a complementary way to characterize distributions, most useful in dealing with non-Gaussian/non-normal processes common in financial markets.
Application to Portfolio Optimization
In portfolio optimization, the traditional mean-variance framework can be significantly enhanced using differential geometry.
This framework typically focuses on the first two moments (mean and variance), but incorporating higher moments (like skewness and kurtosis) can lead to a more accurate representation of the return distribution of a portfolio.
Differential geometry allows for the exploration of these higher-dimensional moments in a more tractable and intuitive way.
Geometric Interpretation of Risk and Return
By viewing the space of portfolio returns as a geometric object, one can use differential geometry to understand how small changes in portfolio composition can lead to changes in the risk-return profile.
This can involve studying the curvature of the space, which relates to how risk (of which variance is a part of) changes as one moves from one portfolio to another.
Advanced Models and Algorithms
The combination of differential geometry with stochastic processes enables the development of sophisticated models and algorithms for portfolio selection.
These models can more accurately capture the complexities of financial markets, including the non-linear relationships and tail risks that are often overlooked in simpler models.
Practical Implications
For practitioners, applying differential geometry to portfolio optimization might involve using tools like manifold learning, which can uncover the intrinsic geometry of high-dimensional financial data.
This can lead to better portfolio construction techniques that are sensitive to the underlying geometric structures of the data.
Differential Geometry & Machine Learning in Finance
Differential geometry, with its focus on curves, surfaces, and shapes, combined with machine learning, provides quant traders with another analysis framework for modeling the complex, non-linear relationships in financial data.
This synergy enhances the ability to uncover hidden patterns and dependencies in market data, which can help devise better trading strategies and a better edge.
By employing techniques like manifold learning, traders can extract meaningful insights from high-dimensional financial datasets.
Differential Geometry vs. Information Geometry in Finance & Markets
Differential geometry and information geometry are two similar mathematical disciplines that have applications in finance and markets.
Understanding their differences and specific uses can provide insights into financial modeling and analysis.
Differential Geometry in Finance and Markets
Curvature and Market Dynamics
Differential geometry’s concepts of curvature and shapes help analyze the curvature in different asset allocations.
Risk Surfaces and Portfolio Optimization
It’s used to visualize and optimize complex risk surfaces in portfolio management.
For example, the curvature of a risk surface can indicate the stability of the portfolio under market stress.
Modeling of Complex Financial Instruments
Differential geometry is used in modeling the complex structures of various financial instruments and understanding their behavior under different market conditions.
This could include exotic options where there are various non-linear or probabilistic structures that can be modeled geometrically.
Geometric Brownian Motion
This concept, a cornerstone in the Black-Scholes model for option pricing, is a key application of differential geometry.
It models stock price movements and helps in option valuation.
Information Geometry in Finance and Markets
Probability Distributions and Data Analysis
Information geometry applies to the study of probability distributions, particularly in understanding the market data structure.
It focuses on the geometry of statistical models.
Risk and Uncertainty Measurement
It’s used to quantify uncertainty in financial models.
The divergence between different probability distributions can be analyzed using information geometry.
Asset Price Dynamics
Information geometry provides tools to understand the dynamics of asset prices by examining the statistical manifold of price movements and how it changes over time.
Algorithmic Trading and Market Prediction Models
In creating models for algorithmic trading, information geometry helps in analyzing data patterns and predicting future market trends.
Comparison and Application in Finance
Focus
- Differential geometry focuses on the structural, shape-based aspects of financial models.
- Information geometry deals with the statistical properties and uncertainties within these models.
Complexity and Dimensionality
- Differential geometry deals with the curvature and shapes in higher-dimensional spaces, which is important for modeling complex financial instruments.
- Information geometry, on the other hand, deals with the shape of statistical models.
- It focuses on the underlying probability distributions of market data.
Modeling Approach
- Differential geometry provides a framework for understanding the geometrical structure of financial models.
- Information geometry provides a way to understand the uncertainty and information contained within these models.
Practical Applications
- Differential geometry is more about the structure and relationship between different financial instruments and markets.
- Information geometry is more about extracting insights from market data, understanding market dynamics, and making predictions based on statistical models.
In short, differential geometry is more about the geometrical and physical structure of financial models, while information geometry focuses on the statistical and probabilistic nature of market data and models.
Coding Example – Differential Geometry
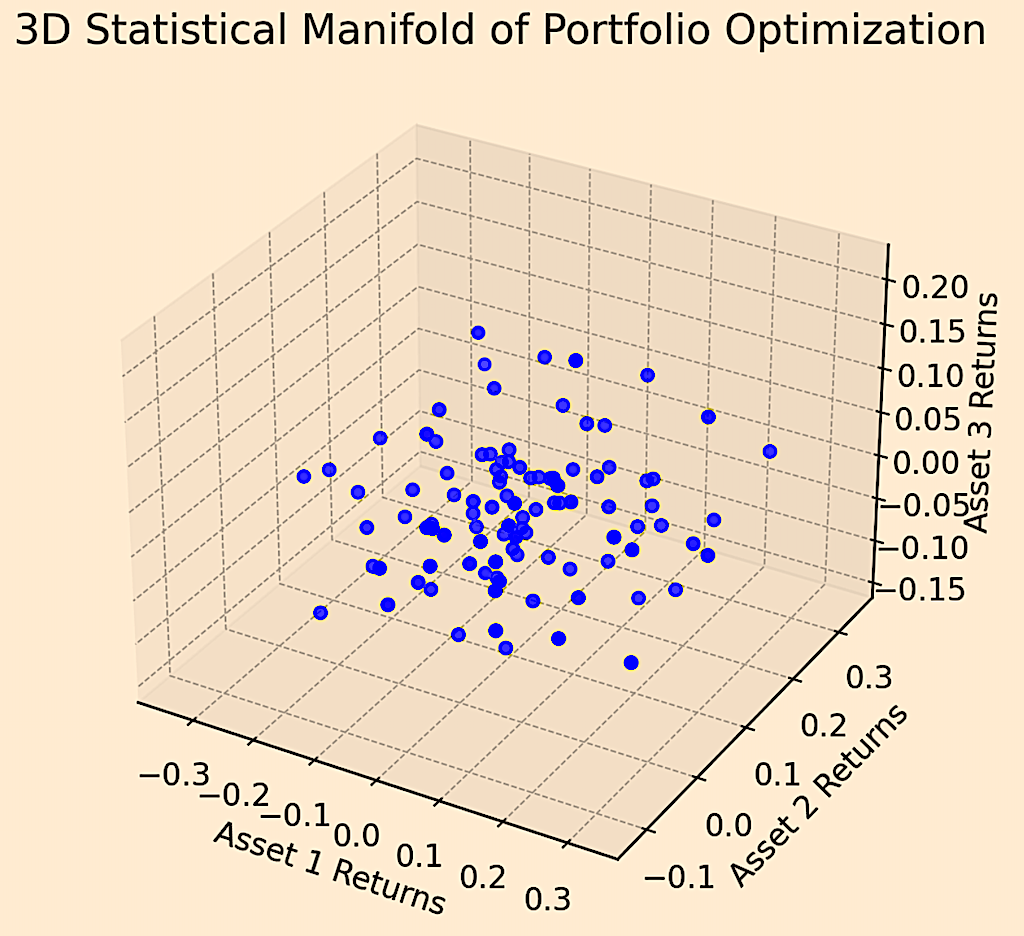
Below is a 3D plot representing a statistical manifold for portfolio optimization of financial assets.
Each point in the plot represents a possible state of a portfolio consisting of three different assets. The axes show the returns of these assets.
This visualization aids in understanding the multi-dimensional nature of financial asset relationships and portfolio dynamics.
Code used to generate the graph:
import numpy as np
import matplotlib.pyplot as plt
from mpl_toolkits.mplot3d import Axes3D

# Generate random data to sim returns of three financial assets
np.random.seed(17)
asset1_returns = np.random.normal(0.05, 0.15, 100)
asset2_returns = np.random.normal(0.07, 0.1, 100)
asset3_returns = np.random.normal(0.02, 0.05, 100)

# Create 3D plot
fig = plt.figure()
ax = fig.add_subplot(111, projection='3d')

# Scatterplot to rep the 3D statistical manifold
ax.scatter(asset1_returns, asset2_returns, asset3_returns, c='blue', marker='o')

# Labels & title
ax.set_xlabel('Asset 1 Returns')
ax.set_ylabel('Asset 2 Returns')
ax.set_zlabel('Asset 3 Returns')
ax.set_title('3D Statistical Manifold of Portfolio Optimization')

# Show plot
plt.show()
Stochastic Differential Geometry
Stochastic differential geometry combines differential geometry (the study of smooth shapes and their properties) with stochastic calculus (which deals with systems influenced by random processes) to model and analyze complex, dynamically changing systems like financial markets.
Here are some of its key applications:
Portfolio Optimization on Manifolds
Traditional portfolio optimization often assumes linear relationships between assets, typically modeled in Euclidean spaces.
Stochastic differential geometry extends this by allowing portfolio optimization to occur on manifolds, which are more general, curved spaces.
This approach can capture more complex asset relationships and dependencies, and various non-linear interactions and constraints.
Modeling Tail Risk
Tail risk refers to the risk of extreme financial losses, often underestimated in normal market conditions.
Stochastic differential geometry enables the modeling of asset price dynamics in a way that better captures the likelihood of these rare, extreme events.
This is achieved through the use of differential equations on manifolds.
This allows for more accurate modeling of the heavy tails often observed in financial return distributions.
Asset Price Dynamics on Manifolds
Financial markets are complex, often exhibiting non-linear dynamics that standard models fail to capture.
By modeling asset price dynamics on manifolds, stochastic differential geometry provides a framework for understanding these complexities (if modeled well).
It allows for the incorporation of various factors, such as changing market volatility and correlations, into a coherent and mathematically rigorous model.
Risk Management and Derivative Pricing
Stochastic differential geometry helps in developing models for pricing complex derivatives and managing risks associated with financial instruments.
These models take into account the curvature and topology of the space in which asset prices evolve.
For complex derivatives, especially those with path-dependent features or those involving multiple underlying assets, stochastic differential geometry can provide a framework for more accurately capturing their price dynamics.
Machine Learning and Data Analysis
In machine learning and data analysis, stochastic differential geometry provides a way to analyze high-dimensional data spaces common in finance.
It provides methods to understand the shape and structure of data, which is essential for tasks like anomaly detection, pattern recognition, and predictive modeling.
Market Microstructure Analysis
Understanding market microstructure, including the behavior of high-frequency trading and order book dynamics, can benefit from the application of stochastic differential geometry.
Stochastic differential geometry can offer models that account for both the random nature of order flow and the structured nature of market depth.
High-Dimensional Trading Strategies
Algorithmic trading often involves making decisions in high-dimensional spaces with complex relationships between variables.
Stochastic differential geometry can provide a way to navigate and optimize strategies in these spaces.
Volatility Surface Modeling
The geometry of volatility surfaces, which represent how implied volatility varies with strike price and expiration, can be analyzed using stochastic differential geometry to better understand and predict changes in market volatility.
Example: Tensors = Assets, Manifold = Portfolio, Curvature = Risk
Assets as Tensors
Imagine each asset or asset class (like stocks, bonds, gold, etc.) as a multi-dimensional “data cube” or a tensor.
This tensor contains all the variables and data influencing its movement and returns, such as price history, growth, inflation, risk premiums, discount rates/interest rates, correlations, and so on.
- Simple Analogy: Think of this tensor like a multi-layered spreadsheet. Each layer (or slice) of the spreadsheet could represent a different attribute of the asset, such as one layer for prices over time, another for volatility, and another for external factors like economic indicators. The whole “stack” of these layers gives a comprehensive, multi-dimensional view of the asset.
Portfolio Configuration as a Manifold
Now, envision the entire universe of possible portfolio configurations as a surface or a shape, which we mathematically call a “manifold.”
Each point on this manifold represents a specific portfolio mix, with different allocations of your assets or asset classes.
- Geometric Space Analogy: Imagine a landscape with hills, valleys, and plateaus. Each point on this landscape represents how you’ve mixed different assets in your portfolio. The “height” at any point on this landscape indicates the return-to-risk ratio of that specific portfolio mix.
Curvature and Portfolio Risk
In this landscape, curvature represents risk. Areas with high curvature (like the steep parts of a hill) represent high risk, while flatter areas (like plateaus) represent lower risk.
- Simple Interpretation: If you’re standing on a steep hill, you’re more likely to slip and fall (high risk), whereas standing on flat ground is much safer (low risk). In portfolio terms, being in a “steep” part of the manifold means small changes can have big impacts on your returns, indicating higher risk.
- Steep parts would represent areas of high portfolio concentration.
Objective: High Up & Low Curvature
Your goal in this landscape (manifold) is to find a spot where you are as high up as possible (maximizing return to risk ratio) while also being in an area of low curvature (minimizing sensitivity).
An example of acceptably high curvature could be when the risk of falling far isn’t high (e.g., prudent risk hedging, such as options cutting off left-tail risk after a point).
- Ideal Spot Analogy: You’re looking for a high plateau or a gentle hilltop. This represents a portfolio configuration where you’ve achieved a great balance of maximizing your returns relative to risk while also keeping the sensitivity of the portfolio (curvature) as low as possible.
Mathematical Approach
The core idea is to:
Define the Tensor for Each Asset
Mathematically, you’d represent each asset as a tensor that encapsulates its influencing factors and performance metrics.
Map Portfolio Configurations to the Manifold
Construct a manifold where points represent portfolio mixes, and the geometry (curvature) of the manifold encodes the risk.
Optimization on the Manifold
Use techniques from differential geometry to find points on the manifold that optimize your desired outcomes (e.g., using gradient ascent to climb to high points while avoiding steep areas).
Article Sources
- https://ir.stonybrook.edu/xmlui/handle/11401/76685
- https://lesniewski.us/papers/presentations/Bloomberg112505.pdf
- https://books.google.com/books?hl=en&lr=&id=4cn3CAAAQBAJ&oi=fnd&pg=PR9&dq=stochastic+differential+geometry&ots=nUC507MYs5&sig=V25ACrF9OVjk3Op4LC9d4YjaZZI
The writing and editorial team at DayTrading.com use credible sources to support their work. These include government agencies, white papers, research institutes, and engagement with industry professionals. Content is written free from bias and is fact-checked where appropriate. Learn more about why you can trust DayTrading.com